Clinical Trial
. 2021 Feb 9;34(6):108684.
doi: 10.1016/j.celrep.2020.108684.

Atypical B cells are part of an alternative lineage of B cells that participates in responses to vaccination and infection in humans

Affiliations
Clinical Trial

Atypical B cells are part of an alternative lineage of B cells that participates in responses to vaccination and infection in humans

Henry J Sutton et al. Cell Rep. .

Abstract

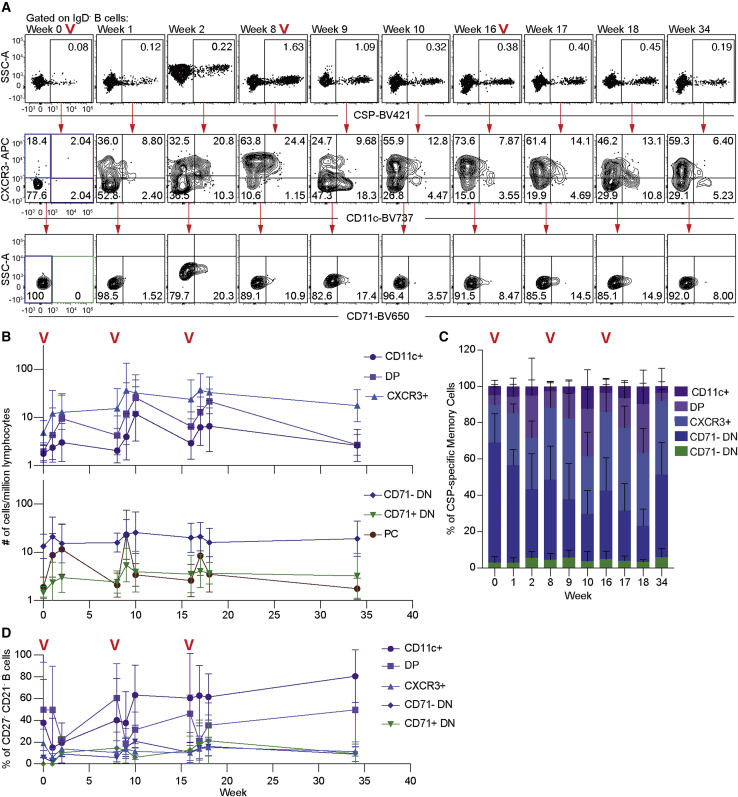
The diversity of circulating human B cells is unknown. We use single-cell RNA sequencing (RNA-seq) to examine the diversity of both antigen-specific and total B cells in healthy subjects and malaria-exposed individuals. This reveals two B cell lineages: a classical lineage of activated and resting memory B cells and an alternative lineage, which includes previously described atypical B cells. Although atypical B cells have previously been associated with disease states, the alternative lineage is common in healthy controls, as well as malaria-exposed individuals. We further track Plasmodium-specific B cells after malaria vaccination in naive volunteers. We find that alternative lineage cells are primed after the initial immunization and respond to booster doses. However, alternative lineage cells develop an atypical phenotype with repeated boosts. The data highlight that atypical cells are part of a wider alternative lineage of B cells that are a normal component of healthy immune responses.

Keywords: B cell memory; CITE-seq; alternative B cell lineage; atypical B cells; malaria; single cell RNA-seq; sporozoite; vaccination.


Conflict of interest statement

Declaration of interests S.C., N.K., B.K.L.S., and S.L.H. are salaried employees of Sanaria, the developer and owner of PfSPZ Vaccine and the investigational new drug (IND) application sponsor of the clinical trials. S.L.H. and B.K.L.S. have a financial interest in Sanaria. All other authors declare no competing interests.

Figures

None
Graphical abstract
Figure 1
Figure 1
Three distinct populations of antigen-experienced B cells revealed by single-cell RNA-seq CSP-, MSP1-, and TT-specific B cells were index, single-cell sorted from malaria vaccinated and exposed donors; transcriptomic information for each cell was generated using Smart-seq2 methodology. (A) Representative flow cytometry plots showing the gating strategy used to sort mature IgD− antigen-specific B cells. (B) Heatmap showing the expression of the top 25 DEGs (row) per cluster for each cell (column). (C) Unsupervised clustering of circulating antigen-specific B cells visualized using uniform manifold approximation and projection (UMAP). Each point represents a cell and is colored by cluster. (D) Heatmap displaying the normalized enrichment scores of multiple GSEAs comparing each cluster versus previously published gene sets from atBCs, naive B cells, and actBCs. (E) Percentage of mutations found in the heavy-chain V(D)J region of each antigen-specific cell per cluster; analysis was by two-way ANOVA, including each subject as a blocking factor; bars represent mean ± SD. (F) Percentage of antibody isotype usage by each cluster; analysis was by chi-square test on the absolute values, which are given above each bar. (G) Percentage of cells specific for each antigen that were found in each cluster; analysis was by chi-square test on the absolute values, which are given above each bar. Where the exact p value is not quoted, p < 0.05, ∗∗p < 0.01, and ∗∗∗p < 0.001.
Figure 2
Figure 2
High-throughput, single-cell analysis reveals the full diversity of circulating B cell populations Single B cells were sorted from 2 malaria exposed and 2 non-exposed individuals, and gene expression was assessed using 10× Chromium methodology. (A) Unsupervised clustering of circulating mature IgD B cells pooled from all individuals visualized using UMAP. Each cell is represented by a point and colored by cluster. (B) Phylogenetic tree based on the “average cell” from each cluster, showing relationships in gene expression patterns between clusters. (C) Heatmap displaying the normalized enrichment scores of multiple GSEAs comparing each cluster against previously published gene sets. (D) Unsupervised clustering of B cells from an integrated 10× and Smart-seq2 dataset visualized using UMAP split by sequencing technique. Each cell is represented by a point and colored by either 10× or Smart-seq2 clusters. (E) Percentage of cells from each Smart-seq2 cluster found in each 10× Chromium cluster. (F) Pseudotime analysis of circulating B cells generated visualized using UMAP. Each point represents a cell and is colored by cluster or progression along pseudotime. Pseudotime begins at “1,” rooted on the naive cluster. (G) Percentage of IgD B cells from each individual found in each cluster. Where the exact p value is not quoted, p < 0.05, ∗∗p < 0.01, and ∗∗∗p < 0.001.
Figure 3
Figure 3
Lack of association between BCR variable and constant regions with different B cell subsets V(D)J and constant region sequences for each cell from each donor described in Figure 2 were mapped to the individual transcriptomes and relationships analyzed. (A) Percentage of isotype usage for each cluster per individual. (B) Percentage of mutations found in the heavy-chain V(D)J region of cells for each cluster in each donor; mean ± SD shown. (C) Heatmaps displaying the pairwise p values from Tukey’s post-tests based on one-way ANOVA of the data in (B) to determine the association between cell type and mutation frequency with subclass and individual also included in the model as fixed factors. (D) Circos plots showing clonal B cell populations per individual; the thickness of the lines between or within clusters denotes the number of cells that belong to shared/expanded clones.
Figure 4
Figure 4
CITE-seq analysis reveals a cryptic population of atBCs found predominantly in non-exposed individuals CITE-seq analysis to correlate expression of cell surface markers with gene expression was performed on cells from the four donors described in Figure 2. (A) Surface protein expression measured by CITE-seq projected onto UMAP plots. Color was scaled for each marker with highest and lowest centered log ratio (CLR)-normalized expression level noted. (B) Contour plots showing the CLR-normalized expression of CD27 and CD21 as measured by CITE-seq; data are concatenated from all individuals. (C) Quantification of (B); data show the mean proportion ± SD of the CD21/CD27 CLR-normalized expression per individual. (D) Histogram plots showing the CLR-normalized expression of CD11c on the different atBC, MBC, and actBC clusters; the gray histogram represents expression on naive B cells; data are concatenated from all individuals. Bar graph shows mean ± SD of the surface protein expression of CD11c for each individual, with triangles representing non-exposed and squares representing malaria-exposed individuals; analysis was performed using one-way ANOVA with each individual as a blocking factor, only comparisons to the naive population are shown. (E) Histogram plots showing the CLR-normalized expression of CXCR3 on the different atBC, MBC, and actBC clusters; the gray histogram represents expression on naive B cells; data are concatenated from all individuals. Bar graph shows the mean ± SD of the surface protein expression of CXCR3 for each individual, with triangles representing non-exposed and squares representing malaria-exposed individuals; analysis was performed using one-way ANOVA with each individual as a blocking factor, only comparisons to the naive population are shown.
Figure 5
Figure 5
CD11c, CXCR3, and CD71 identify atBC, actBCs, and MBCs via flow cytometry PBMCs from 7 non-exp and 11 malaria-exp donors were isolated and analyzed by flow cytometry for expression of markers associated with different B cell populations. (A) Flow cytometry plots from representative individuals showing the CD11c, CXCR3, and CD71 expression on mature IgD B cells. (B) Quantification of (A) showing the percentage of cells found in each cell type by country; bars represent mean ± SD. (C) The expression of surface markers on each cell type, measured by mean fluorescence intensity (MFI); analysis was performed using two-way ANOVA; bars represent mean ± SD. (D) Representative flow cytometry plots showing the expression of CD27 and CD21 per cell type. (E) Quantification of (D) showing the percentage of cells separated by expression of CD27 and CD21 found in each cell type; bars represent the mean proportion ± SD. Where the exact p value is not quoted, p < 0.05, ∗∗p < 0.01, ∗∗∗p < 0.001, and ∗∗∗∗p < 0.0001.
Figure 6
Figure 6
Influenza-specific atBCs expand following vaccination 9 individuals were vaccinated with inactivated influenza vaccine (IIV) with blood drawn at baseline and 14 or 28 days later. (A) Panel shows representative flow cytometry plots showing the number of either B/Phuket or H1-specific IgD B cells and the CD11c, CXCR3, and CD71 expression found in these cells over time. (B) Kinetics of the influenza-specific B cell response quantified by the number of cells of each population per mL of blood; analysis performed with a two-way ANOVA. (C) The log10 fold change of cell numbers between days 0 and 14 for each cell type; analysis performed using two-way ANOVA; bars represent mean ± SD. (D) The percentage of influenza-specific memory cells divided by CD11c, CXCR3, and CD71 expression (mean ± SD shown). Where the exact p value is not quoted, p < 0.05, ∗∗p < 0.01, ∗∗∗p < 0.001, and ∗∗∗∗p < 0.0001.
Figure 7
Figure 7
Antigen-specific atBCs arise during the primary response to the PfSPZ vaccine and can be effectively recalled 15 individuals were vaccinated with 3 doses of 9 × 105 PfSPZ at 8-week intervals, with blood drawn at the indicated time points. (A) Panel shows representative flow cytometry plots from a single individual of the gating of CSP-specific IgD B cells and the CD11c, CXCR3, and CD71 expression found in these cells over time. Red “V”s indicate time points where booster immunizations were given. (B) Kinetics of the CSP-specific B cell response quantified by the number of cells of each population per million lymphocytes; mean ± SD shown. (C) The percentage of CSP-specific memory cells divided by CD11c, CXCR3, and CD71 expression over time; mean ± SD shown. (D) Proportion of CD21 CD27 cells per cell population over time; mean ± SD shown.

Comment in

References

    1. Andrews S.F., Chambers M.J., Schramm C.A., Plyler J., Raab J.E., Kanekiyo M., Gillespie R.A., Ransier A., Darko S., Hu J. Activation dynamics and immunoglobulin evolution of pre-existing and newly generated human memory B cell responses to influenza hemagglutinin. Immunity. 2019;51:398–410.e5. - PubMed
    1. Avery D.T., Ellyard J.I., Mackay F., Corcoran L.M., Hodgkin P.D., Tangye S.G. Increased expression of CD27 on activated human memory B cells correlates with their commitment to the plasma cell lineage. J. Immunol. 2005;174:4034–4042. - PubMed
    1. Aye R., Sutton H.J., Nduati E.W., Kai O., Mwacharo J., Musyoki J., Otieno E., Wambua J., Bejon P., Cockburn I.A., Ndungu F.M. Malaria exposure drives both cognate and bystander human B cells to adopt an atypical phenotype. Eur. J. Immunol. 2020;50:1187–1194. - PMC - PubMed
    1. Butler A., Hoffman P., Smibert P., Papalexi E., Satija R. Integrating single-cell transcriptomic data across different conditions, technologies, and species Nat. Biotech. 2018;36:411–420. - PMC - PubMed
    1. Charles E.D., Brunetti C., Marukian S., Ritola K.D., Talal A.H., Marks K., Jacobson I.M., Rice C.M., Dustin L.B. Clonal B cells in patients with hepatitis C virus-associated mixed cryoglobulinemia contain an expanded anergic CD21low B-cell subset. Blood. 2011;117:5425–5437. - PMC - PubMed

Publication types