

Specification and epigenomic resetting of the pig germline exhibit conservation with the human lineage
- PMID: 33567277
- PMCID: PMC7873836
- DOI: 10.1016/j.celrep.2021.108735
Specification and epigenomic resetting of the pig germline exhibit conservation with the human lineage
Abstract
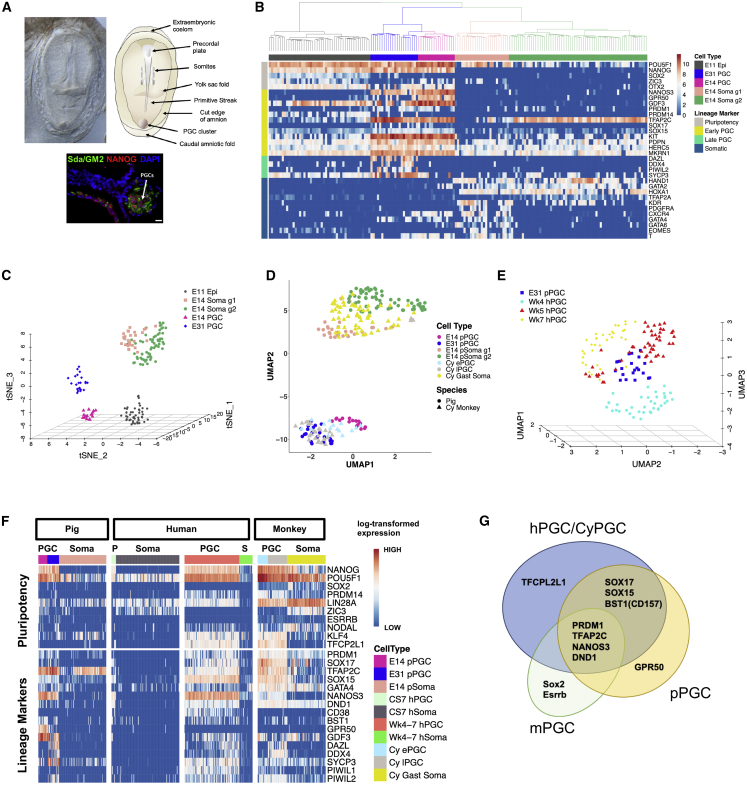
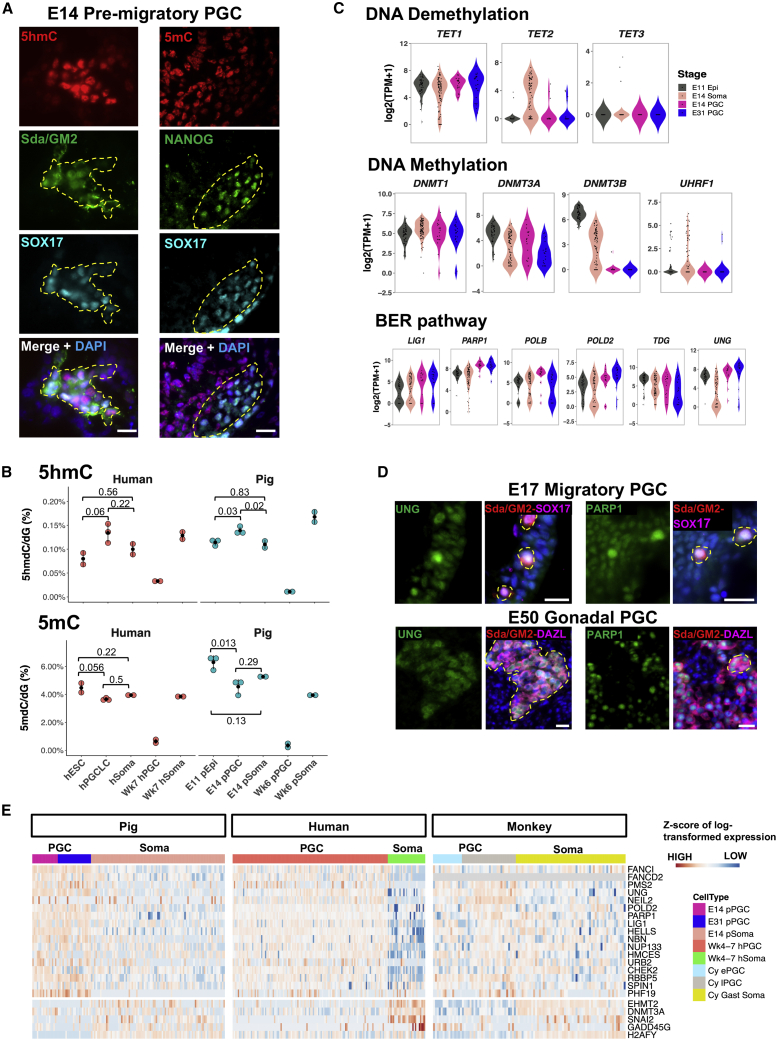
Investigations of the human germline and programming are challenging because of limited access to embryonic material. However, the pig as a model may provide insights into transcriptional network and epigenetic reprogramming applicable to both species. Here we show that, during the pre- and early migratory stages, pig primordial germ cells (PGCs) initiate large-scale epigenomic reprogramming, including DNA demethylation involving TET-mediated hydroxylation and, potentially, base excision repair (BER). There is also macroH2A1 depletion and increased H3K27me3 as well as X chromosome reactivation (XCR) in females. Concomitantly, there is dampening of glycolytic metabolism genes and re-expression of some pluripotency genes like those in preimplantation embryos. We identified evolutionarily young transposable elements and gene coding regions resistant to DNA demethylation in acutely hypomethylated gonadal PGCs, with potential for transgenerational epigenetic inheritance. Detailed insights into the pig germline will likely contribute significantly to advances in human germline biology, including in vitro gametogenesis.
Keywords: DNA demethylation; X-chromosome reactivation; epigenetic resetting; escapees; germ cells; pig; single-cell RNA-seq; transgenerational inheritance.
Copyright © 2021 The Authors. Published by Elsevier Inc. All rights reserved.
Conflict of interest statement
Declaration of interests The authors declare no competing interests.
Figures


Similar articles
-
Analysis of the pluripotent and germline marker gene expression, and the state of X chromosome reactivation of primordial germ cells in pig gonads.Theriogenology. 2025 Jan 1;231:52-61. doi: 10.1016/j.theriogenology.2024.10.008. Epub 2024 Oct 11. Theriogenology. 2025. PMID: 39413538
-
Single-cell RNA-seq identifies protracted mouse germline X chromosome reactivation dynamics directed by a PRC2-dependent mechanism.Dev Cell. 2025 May 5;60(9):1321-1335.e5. doi: 10.1016/j.devcel.2024.12.028. Epub 2025 Jan 10. Dev Cell. 2025. PMID: 39798575
-
PRDM14 controls X-chromosomal and global epigenetic reprogramming of H3K27me3 in migrating mouse primordial germ cells.Epigenetics Chromatin. 2019 Jun 20;12(1):38. doi: 10.1186/s13072-019-0284-7. Epigenetics Chromatin. 2019. PMID: 31221220 Free PMC article.
-
Human Germline: A New Research Frontier.Stem Cell Reports. 2015 Jun 9;4(6):955-60. doi: 10.1016/j.stemcr.2015.04.014. Epub 2015 May 28. Stem Cell Reports. 2015. PMID: 26028529 Free PMC article. Review.
-
Epigenetic reprogramming in mouse and human primordial germ cells.Exp Mol Med. 2024 Dec;56(12):2578-2587. doi: 10.1038/s12276-024-01359-z. Epub 2024 Dec 13. Exp Mol Med. 2024. PMID: 39672813 Free PMC article. Review.
Cited by
-
Conserved features of non-primate bilaminar disc embryos and the germline.Stem Cell Reports. 2021 May 11;16(5):1078-1092. doi: 10.1016/j.stemcr.2021.03.011. Stem Cell Reports. 2021. PMID: 33979595 Free PMC article. Review.
-
Pluripotent stem cells related to embryonic disc exhibit common self-renewal requirements in diverse livestock species.Development. 2021 Dec 1;148(23):dev199901. doi: 10.1242/dev.199901. Epub 2021 Dec 7. Development. 2021. PMID: 34874452 Free PMC article.
-
Stay on the road: from germ cell specification to gonadal colonization in mammals.Philos Trans R Soc Lond B Biol Sci. 2022 Dec 5;377(1865):20210259. doi: 10.1098/rstb.2021.0259. Epub 2022 Oct 17. Philos Trans R Soc Lond B Biol Sci. 2022. PMID: 36252219 Free PMC article. Review.
-
Does supplementation of oocytes with additional mtDNA influence developmental outcome?iScience. 2023 Jan 11;26(2):105956. doi: 10.1016/j.isci.2023.105956. eCollection 2023 Feb 17. iScience. 2023. PMID: 36711242 Free PMC article.
-
Epigenetic resetting in the human germ line entails histone modification remodeling.Sci Adv. 2023 Jan 18;9(3):eade1257. doi: 10.1126/sciadv.ade1257. Epub 2023 Jan 18. Sci Adv. 2023. PMID: 36652508 Free PMC article.
References
-
- Andrews S. Babraham Bioinformatics; 2010. FastQC: A Quality Control Tool for High Throughput Sequence Data.
-
- Black J.L., Erickson B.H. Oogenesis and ovarian development in the prenatal pig. Anat. Rec. 1968;161:45–55. - PubMed
-
- Bendsen E., Byskov A.G., Laursen S.B., Larsen H.P.E., Andersen C.Y., Westergaard L.G. Number of germ cells and somatic cells in human fetal testes during the first weeks after sex differentiation. Hum. Reprod. 2003;18:13–18. - PubMed
Publication types
MeSH terms
Substances
Grants and funding
- BB/M001466/1/BB_/Biotechnology and Biological Sciences Research Council/United Kingdom
- BB/T01346X/1/BB_/Biotechnology and Biological Sciences Research Council/United Kingdom
- 209475/WT_/Wellcome Trust/United Kingdom
- MC_U120092689/MRC_/Medical Research Council/United Kingdom
- 648879/ERC_/European Research Council/International
LinkOut - more resources
Full Text Sources
Other Literature Sources
Molecular Biology Databases
Miscellaneous
