. 2021 Feb 9;34(6):108739.
doi: 10.1016/j.celrep.2021.108739.

Natural genetic variation determines microglia heterogeneity in wild-derived mouse models of Alzheimer's disease

Affiliations

Natural genetic variation determines microglia heterogeneity in wild-derived mouse models of Alzheimer's disease

Hongtian Stanley Yang et al. Cell Rep. .

Abstract

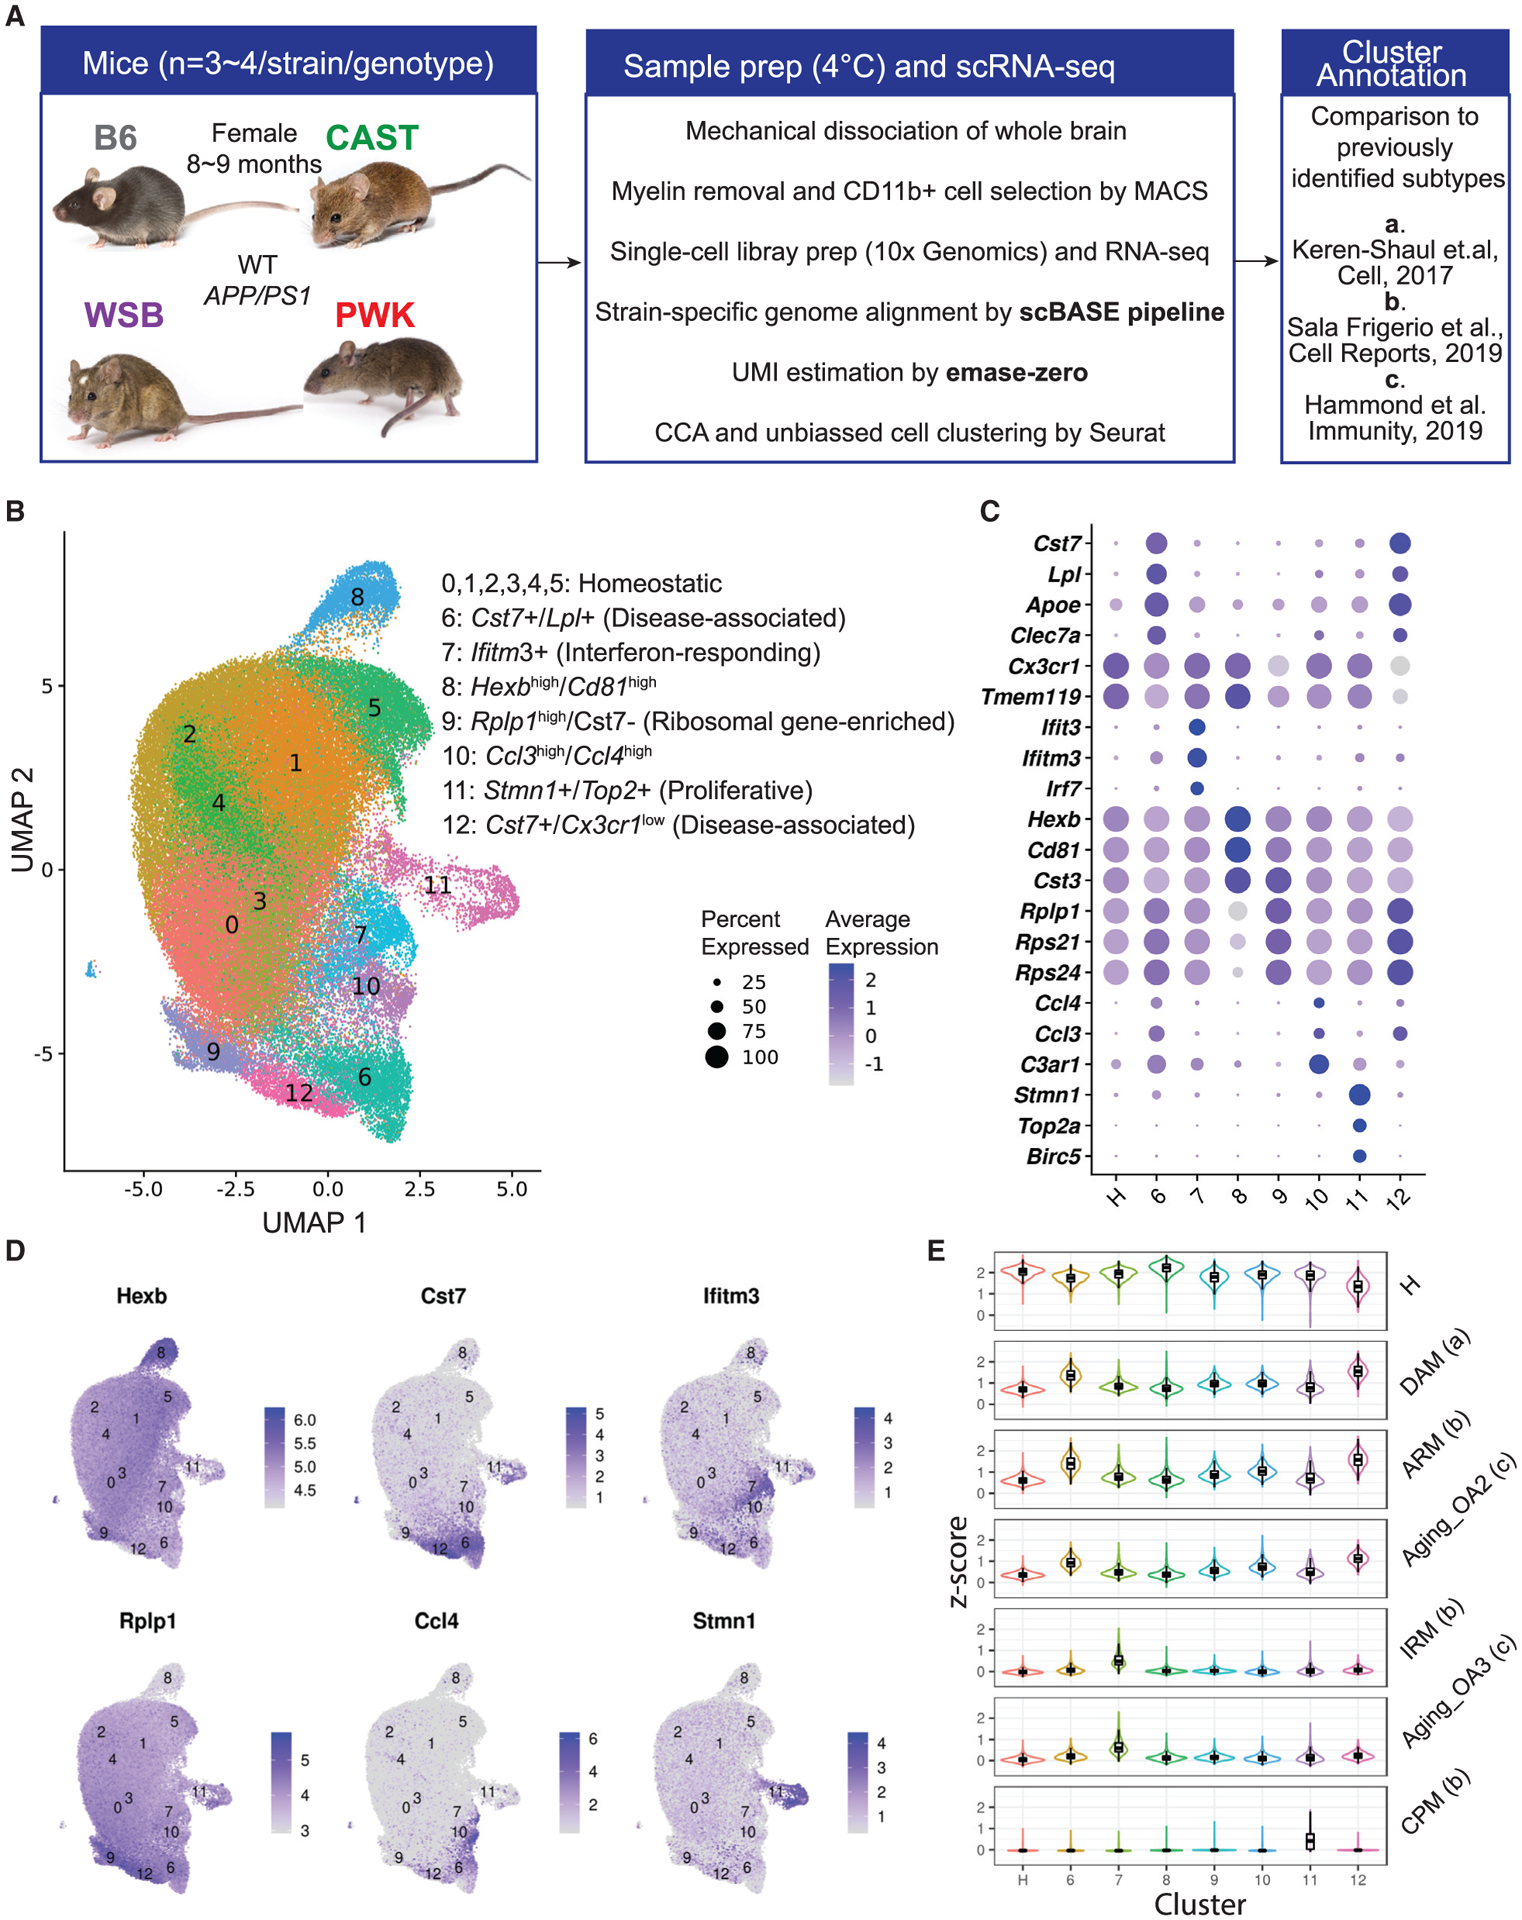
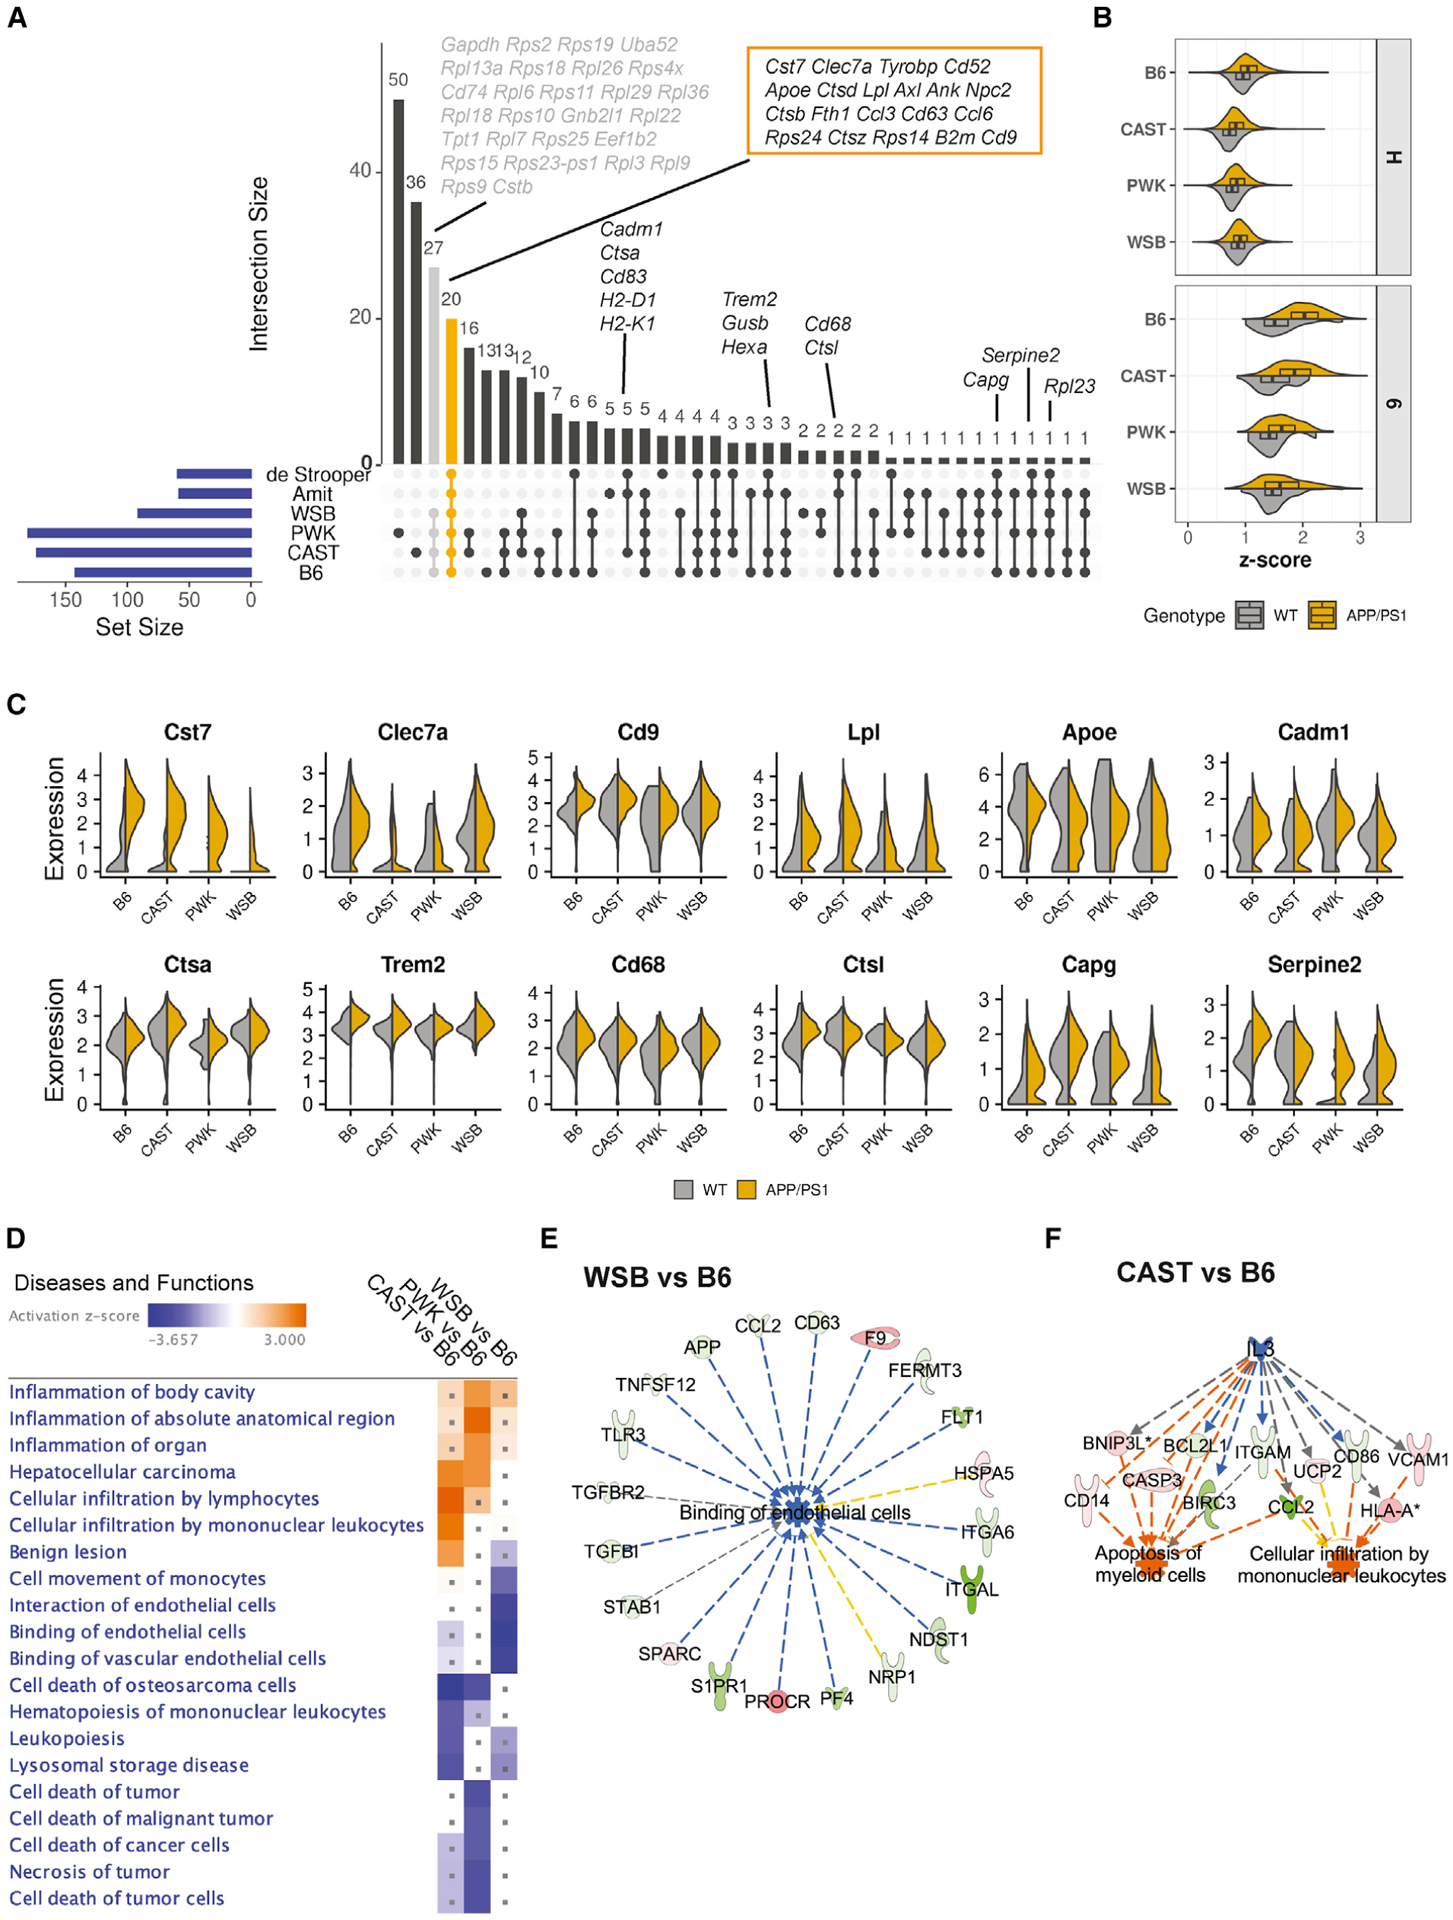
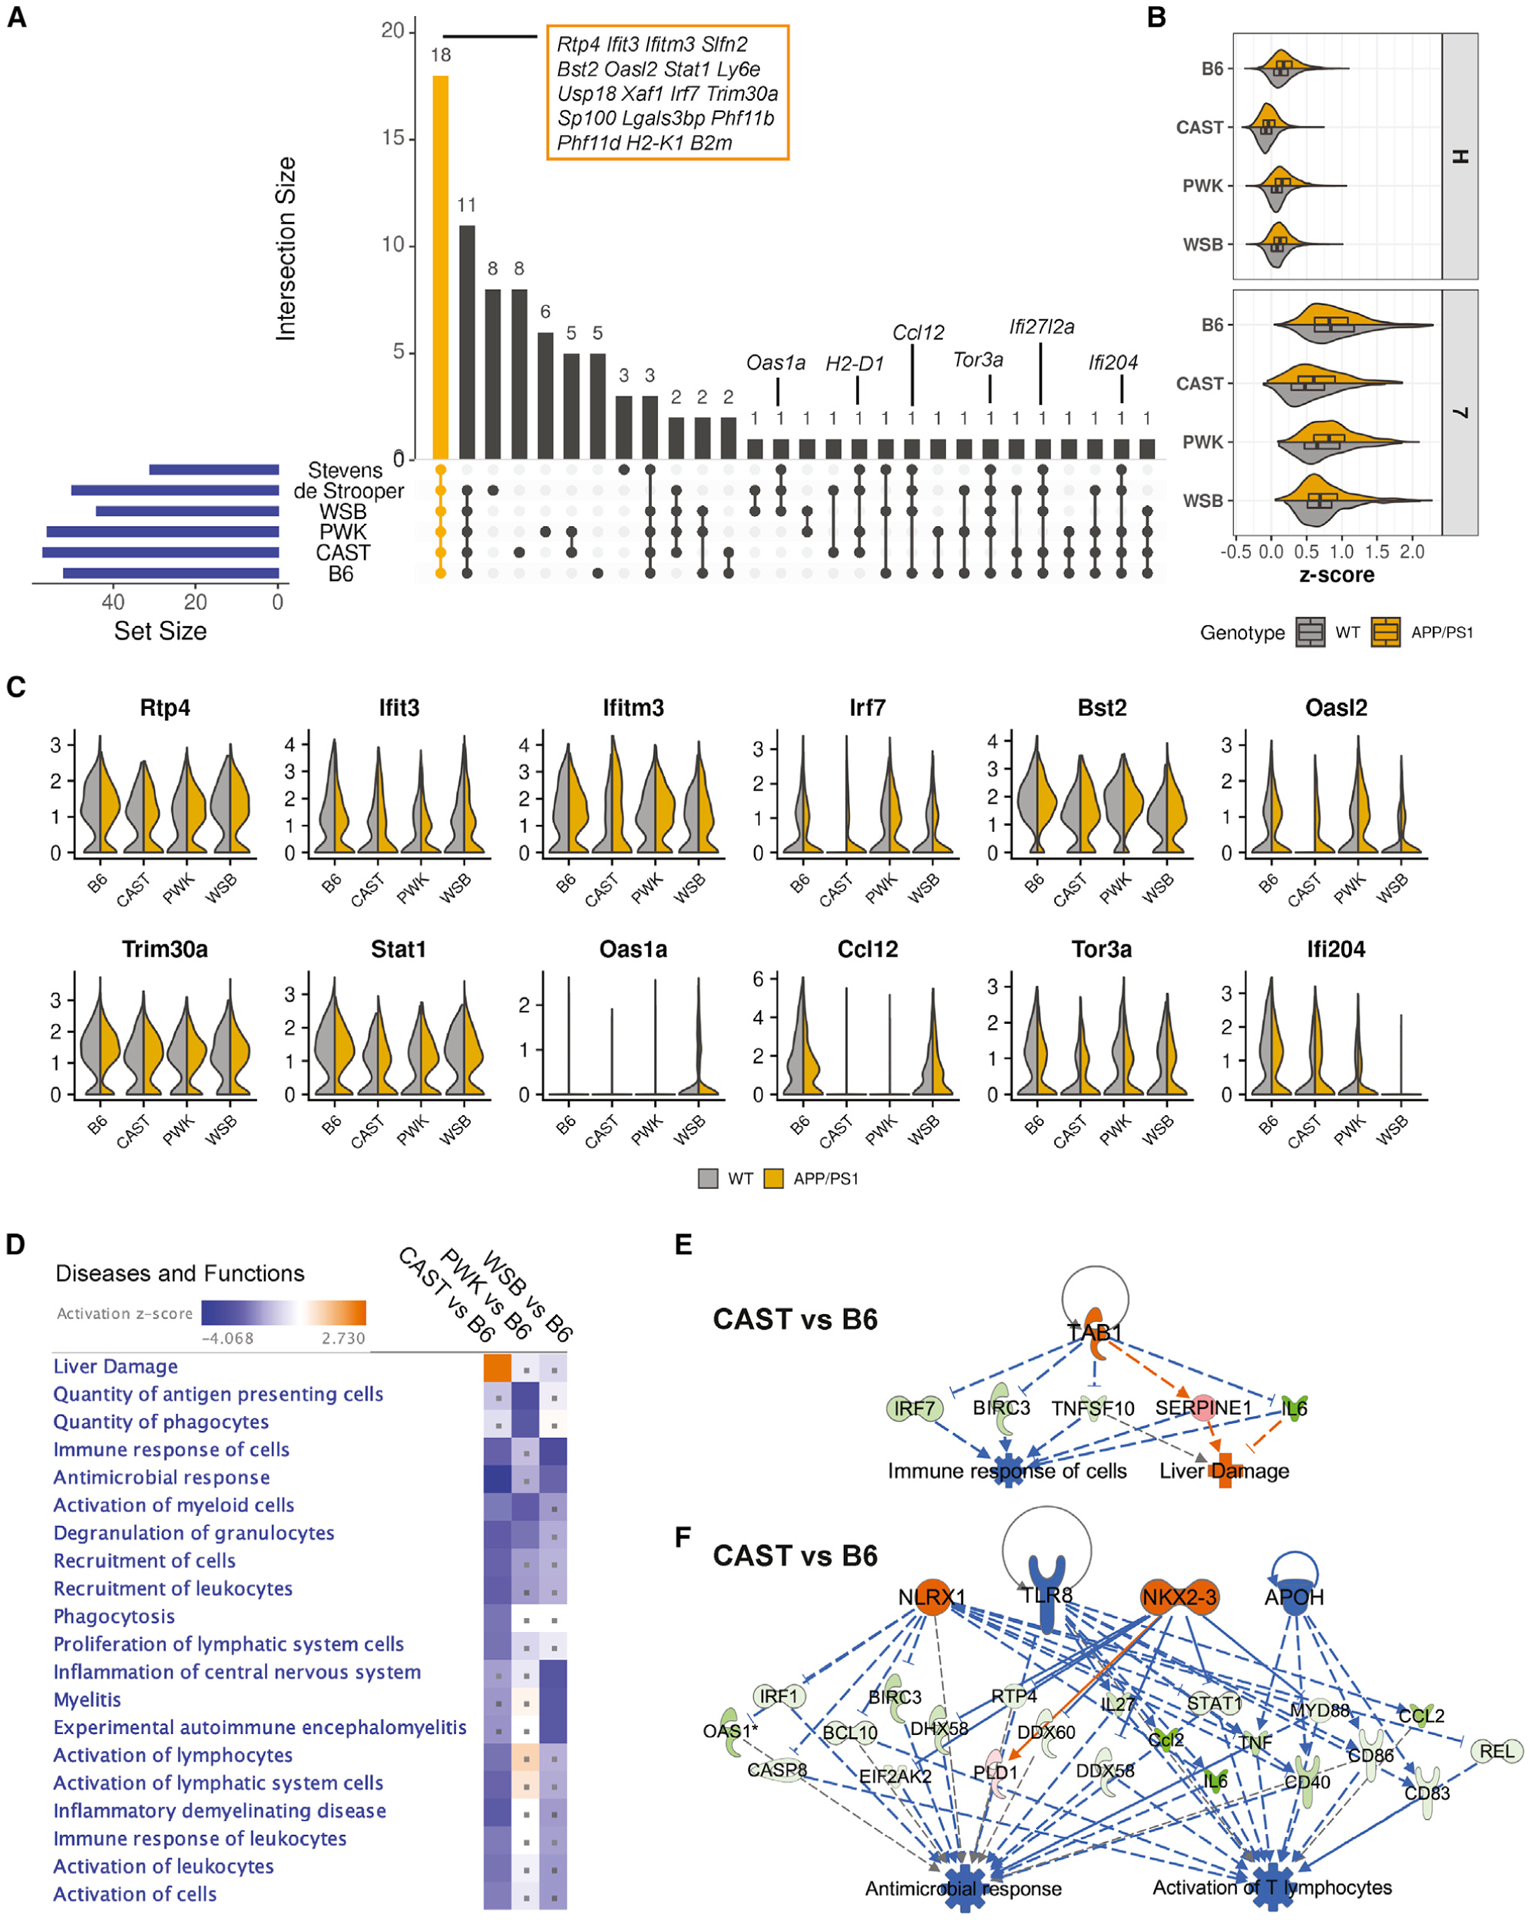
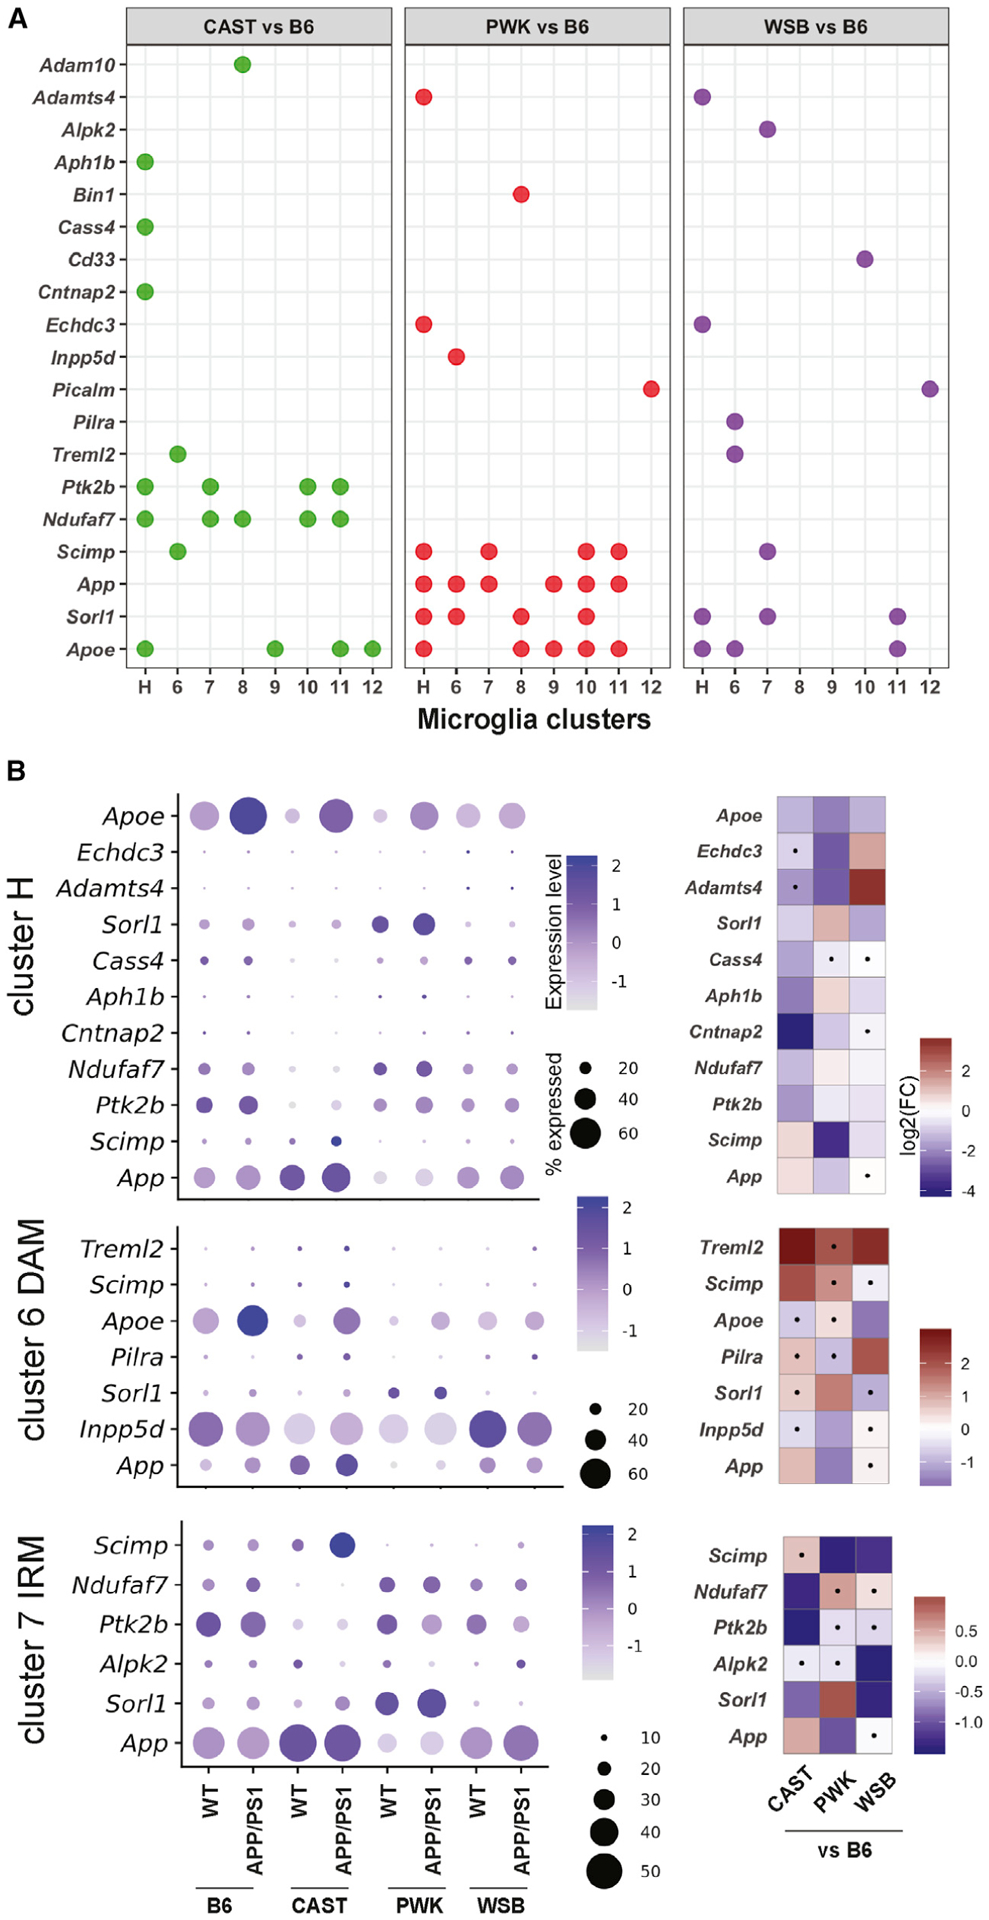
Genetic and genome-wide association studies suggest a central role for microglia in Alzheimer's disease (AD). However, single-cell RNA sequencing (scRNA-seq) of microglia in mice, a key preclinical model, has shown mixed results regarding translatability to human studies. To address this, scRNA-seq of microglia from C57BL/6J (B6) and wild-derived strains (WSB/EiJ, CAST/EiJ, and PWK/PhJ) with and without APP/PS1 demonstrates that genetic diversity significantly alters features and dynamics of microglia in baseline neuroimmune functions and in response to amyloidosis. Results show significant variation in the abundance of microglial subtypes or states, including numbers of previously identified disease-associated and interferon-responding microglia, across the strains. For each subtype, significant differences in the expression of many genes are observed in wild-derived strains relative to B6, including 19 genes previously associated with human AD including Apoe, Trem2, and Sorl1. This resource is critical in the development of appropriately targeted therapeutics for AD and other neurological diseases.

Keywords: AD; APP/PS1; Alzheimer's disease; CAST/EiJ; DAM; IRM; PWK/PhJ; WSB/EiJ; disease-associated microglia; genetic diversity; interferon-responding microglia; microglia; wild-derived.


Conflict of interest statement

Declaration of interests The authors declare no competing interests.

Figures

Figure 1.
Figure 1.. Clustering and annotation of microglia subtypes in B6 and wild-derived mice
(A) Overview of the experimental strategy. (B) UMAP plot showed 87,746 strain-integrated microglia from all 29 mice (20,732 from B6, 24,124 from CAST, 19,702 from PWK, and 23,188 from WSB), reflecting diverse microglia subtypes including homeostatic (clusters 0–5), disease-associated (clusters 6 and 12), interferon-responding (cluster 7), Hexbhigh/Cd81high (cluster 8), ribosomal gene-enriched (cluster 9), Ccl3high/Ccl4high (cluster 10), and proliferative microglia (cluster 11). (C) Dot plot showing the classical marker genes for microglia subtypes with their percentage expressed (dot size) and average expression (color intensity). (D) UMAP plots highlighting microglia subtype marker genes including Hexb, Cst7, Ifitm3, Rplp1, Ccl4, and Stmn1. (E) Violin boxplots showing the enrichment Z score for each cluster (all strains combined) based on marker genes from previously identified microglia subtypes. Microglia subtypes from previous studies for comparison include homeostatic microglia (Keren-Shaul et al., 2017; Sala Frigerio et al., 2019; Hammond et al., 2019; Gosselin et al., 2017; Butovsky and Weiner, 2018), disease-associated microglia (DAM) (Keren-Shaul et al., 2017), activated-response microglia (ARM) (Sala Frigerio et al., 2019), interferon-responding microglia (IRM) (Sala Frigerio et al., 2019), aging-associated microglia (OA2, OA3) (Hammond et al., 2019), and cycling and proliferative microglia (CPM) (Sala Frigerio et al., 2019). Significant variation in enrichment score was detected across the clusters (p < 2 × 10⁻¹⁶, one-way ANOVA), which supported identification of clusters 6 and 12 as DAM/ARM and cluster 7 as IRM.
Figure 2.
Figure 2.. The abundance of microglia subtypes is highly variable in B6 and wild-derived strains
(A) Percentage of microglia subtypes in WT and APP/PS1 mice of B6, CAST, PWK, and WSB. (B) Histogram of the pseudotime (the first dimension of the diffusion map) showing the distribution of 1,000 microglia randomly sampled from each group. (C) Boxplots showing the percentage of microglia subtypes in all groups of mice. Strain, genotype, and strain-by-genotype effects were assessed by 2-way ANOVA followed by Tukey’s post hoc test. All comparisons (comparing WT and APP/PS1 within each strain for a given cluster) were significant (adjusted p value [p. adj] < 0.05) except for those labeled with NS (not significant, p. adj ≥ 0.05). Detailed p. adj values and confidence intervals for within and across strain/genotype comparisons are reported in Table S2.
Figure 3.
Figure 3.. Strain-specific gene expression of homeostatic microglia
(A) Violin boxplots showing the enrichment Z score of 23 classical homeostatic microglia markers (Method details) in homeostatic (clusters 0–5), Hexbhigh/Cd81high (cluster 8), and DAM (cluster 6) in each strain and genotype. Significant strain and genotype effect was detected for each cluster (p ≈ 0, two-way ANOVA). (B) Violin plots showing the expression of homeostatic microglia marker genes in each strain and genotype. (C) Heatmap summarizing top 20 significantly enriched terms of diseases and functions based on DE genes from comparisons of wild-derived versus B6 samples (corrected p value using Benjamini-Hochberg FDR (pval-BH) < 0.05, and |Z score| ≥ 2). The dot indicates the enrichment of diseases and functions term is not significant for a given comparison (pval-BH ≥ 0.05). (D and E) Examples of REs for PWK versus B6 (D) and WSB versus B6 (E) highlighting upstream regulators (top), downstream targets (middle), and diseases and functions (bottom). The orange and blue colors indicate predicted up- or down-regulation of an upstream regulator or a diseases and functions term for a given comparison of wild-derived strain to B6. The red and green colors show up- or down-regulation of the downstream targets as DE genes comparing a given wild-derived strain to B6.
Figure 4.
Figure 4.. Strain-specific gene expression of DAM (cluster 6)
(A) Upset plot illustrating the intersection of the top DAM signature genes in B6 and wild-derived strains and top signature genes defining DAM from the Amit study (Keren-Shaul et al., 2017) and ARM in the de Strooper study (Sala Frigerio et al., 2019). Specific genes in selected intersections are detailed on the plot. Core genes shared by all datasets are highlighted in the orange box; genes shared only in our B6 and wild-derived strains are colored in gray. (B) Violin boxplots showing the enrichment Z score of the core DAM genes in cluster H (homeostatic) and cluster 6 for each strain and genotype. Significant strain and genotype effects were detected (p ≈ 0, two-way ANOVA). (C) Violin plots showing the expression of selected DAM core genes in cluster 6 for each strain and genotype. (D) Heatmap summarizing top 20 significantly enriched diseases and functions (IPA) terms based on DE genes from comparisons of wild-derived versus B6 mice (pval-BH < 0.05, |Z score| ≥ 2). The dot indicates the enrichment of diseases and functions term is not significant for a given comparison (pval-BH ≥ 0.05). (E) Example of an RE for WSB versus B6 highlighting the of “binding of endothelial cells.” (F) Example of an RE for CAST versus B6 highlighting network of “apoptosis of myeloid cells” and “cellular infiltration by mononuclear leukocytes.” The color code is the same as described in Figures 3D and 3E.
Figure 5.
Figure 5.. Strain-specific gene expression of IRM
(A) Upset plot illustrating the intersection of the top IRM marker genes in B6 and wild-derived strains integrated with Aging_OA3 cluster from the Stevens study (Hammond et al., 2019) and IRM from the de Strooper study (Sala Frigerio et al., 2019). The genes in selected intersections are detailed in the plot. Core genes shared by all datasets are highlighted in the orange box. (B) Violin boxplots showing the enrichment Z score of the 18 core IRM signature genes in cluster H (homeostatic) and cluster 7 (IRM) for each strain and genotype. Significant strain and genotype effects were detected for each cluster (p ≈ 0, two-way ANOVA). (C) Violin plots showing the expression of selected IRM core genes in cluster 7 for each strain and genotype. (D) Heatmap summarizing top 20 significantly enriched terms of diseases and functions based on DE genes from comparisons of wild-derived versus B6 mice (pval-BH < 0.05, |Z score| ≥ 2). The dot indicates the enrichment of diseases and functions term was not significant for a given comparison (pval-BH ≥ 0.05). (E) Example of an RE for CAST versus B6 highlighting network of “immune response of cells” and “liver damage.” (F) Example of a second RE for CAST versus B6 highlighting “antimicrobial response” and “activation of T lymphocytes.” The color code is the same as described in Figures 3D and 3E.
Figure 6.
Figure 6.. Comparison of cluster 6 (DAM) with human microglia
(A) Violin boxplots showing the enrichment Z score of the top marker genes defining microglia from four studies: Mic1 from Tsai (Mathys et al., 2019); Micro0 from Colonna (Zhou et al., 2020); aged microglia from Bradshaw (Olah et al., 2018); and M4 microglia module from Seyfried (Johnson et al., 2020). (B) Violin boxplots showing the enrichment Z score of the top marker genes of the Mic1 cluster from the Tsai study for each strain and genotype. Significant strain and genotype effects were detected for each cluster (p ≈ 0, two-way ANOVA). (C) Upset plot illustrating the intersection of the top DAM marker genes in B6 and wild-derived strains integrated with top marker genes associated with human Mic1 cluster (Tsai) (Mathys et al., 2019). The genes in selected intersections are detailed in the plot. Core genes shared by all datasets are highlighted in the orange box; genes shared in our B6 and wild-derived strains but not Mic1 are colored in gray. (D) Violin plots showing the expression of selected genes for each strain and genotype.
Figure 7.
Figure 7.. Microglia subtypes from wild-derived strains show differentially expressed AD-relevant GWAS genes
(A) Nineteen AD-relevant GWAS genes were DE comparing wild-derived strains to B6 for all eight microglia clusters. The dot indicates the gene was significantly DE (FDR < 0.05) comparing CAST, PWK, or WSB to B6 in a given cluster. (B) Dot plot (left) showing the percentage of cells expressed and the expression levels of significant strain-specific DE genes in homeostatic microglia (cluster H), DAM (cluster 6), and IRM (cluster 7) across all groups. Heatmap (right) highlighting the log2-based fold change (log2FC) of the corresponding gene expression comparing CAST, PWK, and WSB to B6 in clusters H, 6, and 7. The dot in the heatmap indicates the fold change for a given comparison was not significant (FDR ≥ 0.05).

References

    1. Abdul-Sater AA, Saïd-Sadier N, Lam VM, Singh B, Pettengill MA, Soares F, Tattoli I, Lipinski S, Girardin SE, Rosenstiel P, and Ojcius DM (2010). Enhancement of reactive oxygen species production and chlamydial infection by the mitochondrial Nod-like family member NLRX1. J. Biol. Chem 285, 41637–41645. - PMC - PubMed
    1. Adriouch S, Dox C, Welge V, Seman M, Koch-Nolte F, and Haag F (2002). Cutting edge: a natural P451L mutation in the cytoplasmic domain impairs the function of the mouse P2X7 receptor. J. Immunol 169, 4108–4112. - PubMed
    1. Agora Consortium (2020). Agora. https://agora.ampadportal.org/genes.
    1. Alsema AM, Jiang Q, Kracht L, Gerrits E, Dubbelaar ML, Miedema A, Brouwer N, Woodbury M, Wachter A, Xi HS, et al. (2020). Profiling microglia from AD donors and non-demented elderly in acute human post-mortem cortical tissue. bioRxiv 10.1101/2020.03.18.995332. - DOI - PMC - PubMed
    1. Angerer P, Haghverdi L, Buttner M, Theis FJ, Marr C, and Buettner F (2016). destiny: diffusion maps for large-scale single-cell data in R. Bioinformatics 32, 1241–1243. - PubMed

Publication types

LinkOut - more resources