. 2021 Feb 9;34(6):108733.
doi: 10.1016/j.celrep.2021.108733.

Plasma cell dynamics in the bone marrow niche

Affiliations

Plasma cell dynamics in the bone marrow niche

Zachary Benet et al. Cell Rep. .

Abstract

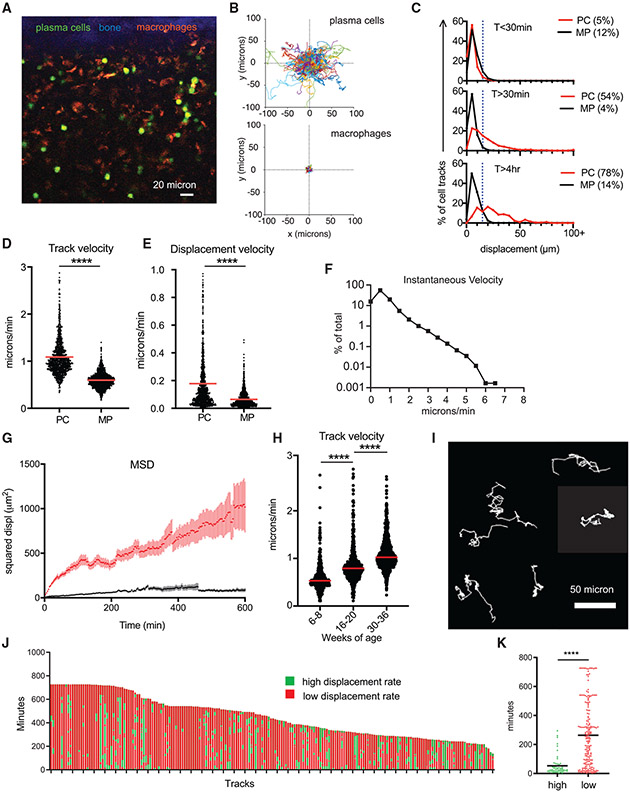
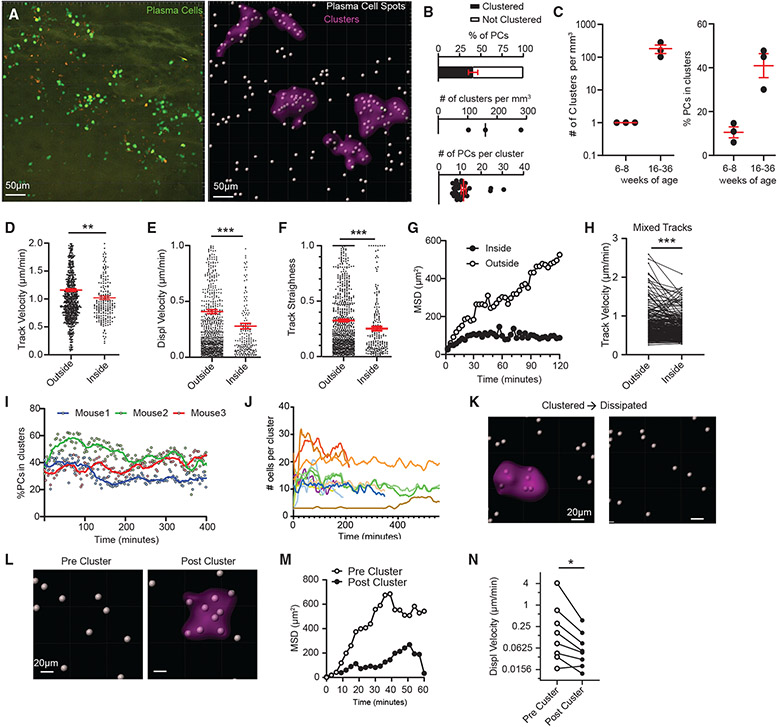
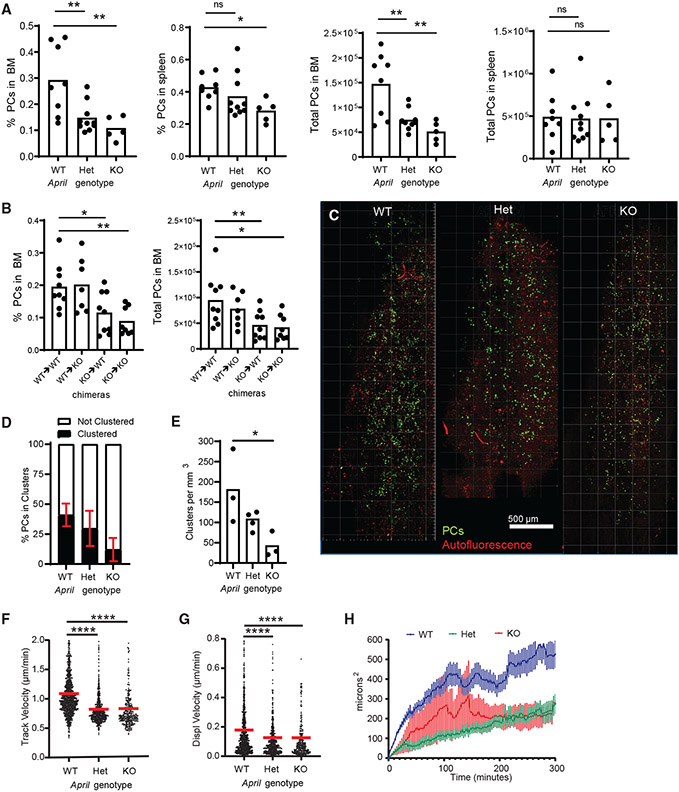
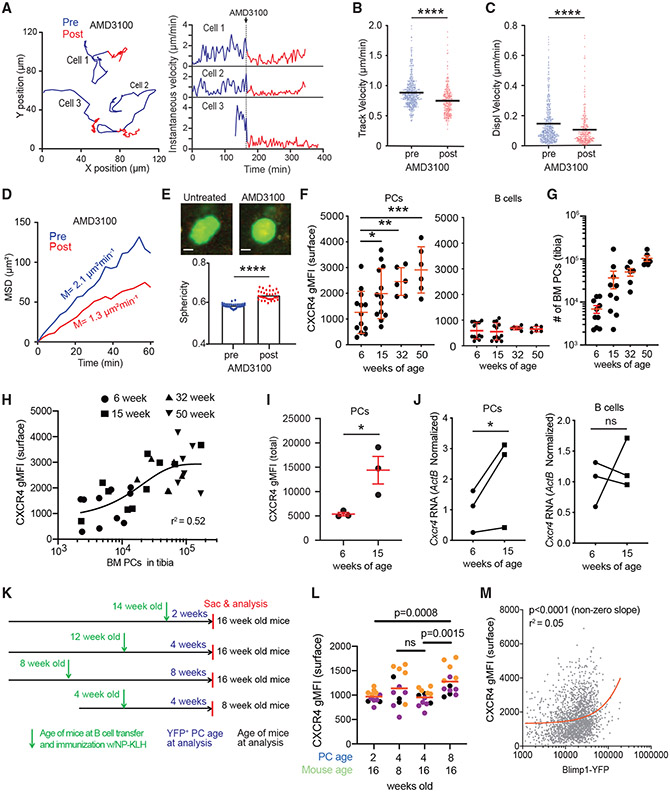
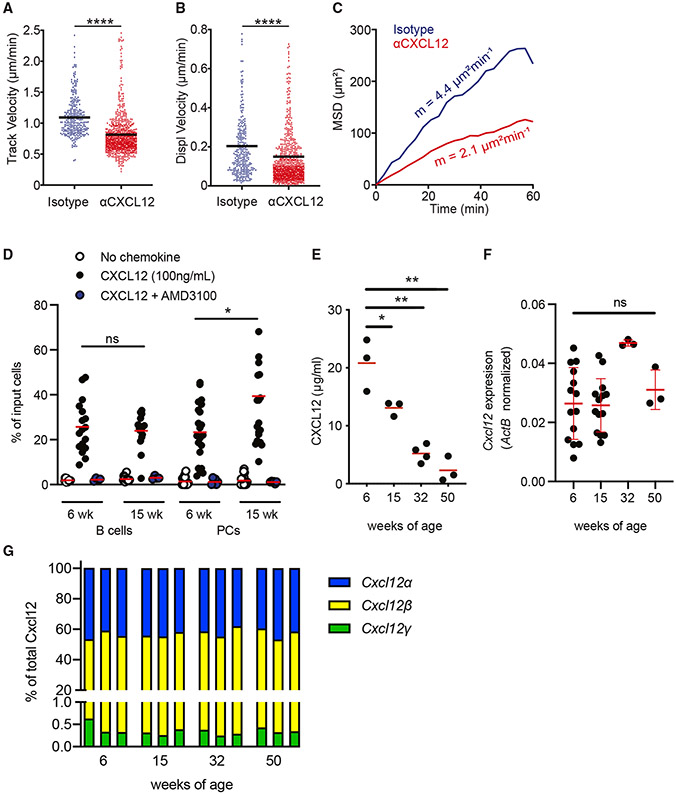
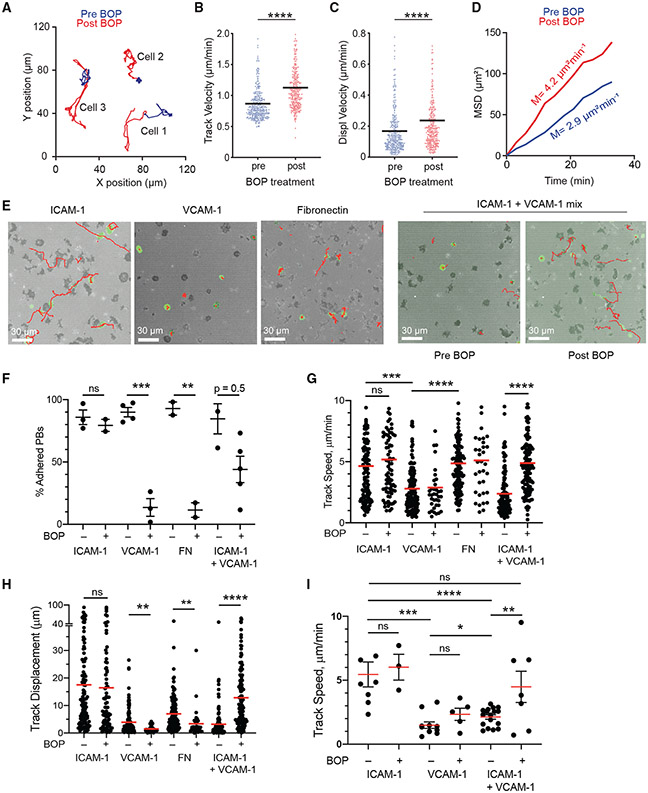
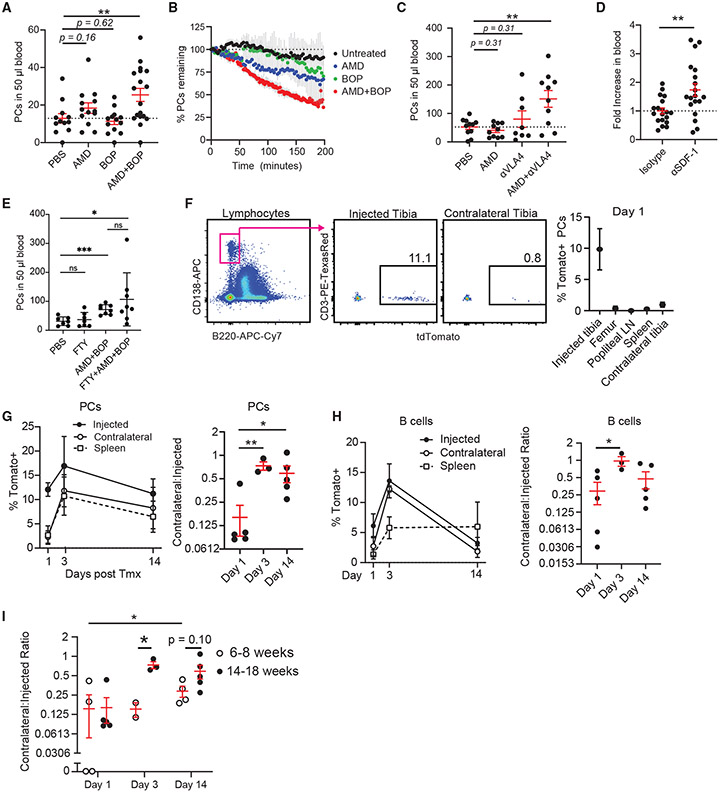
Using intravital imaging, we report that bone marrow (BM) plasma cells (PCs) are motile. BM PCs exhibit a unique migration pattern, characterized by intermittent periods of high motility and longer stretches of confined migration or arrest. BM PCs accumulate into clusters, which have reduced cell motility. APRIL promotes cluster formation and overall PC motility in the BM. Although CXCL12 and its receptor, CXCR4, promote PC motility in the BM, VLA4 activity promotes arrest. However, blocking either pathway promotes PC egress from the BM. Under steady-state conditions, BM PCs recirculate to other bones and spleen. In older mice, overall PC motility and recirculation increase, and this is correlated with increased CXCR4 expression, which depends on PC age or maturation rather than mouse age. Altogether, these results suggest that changes in PC motility and CXCR4 expression are linked with survival of long-lived PCs in the BM.

Keywords: APRIL; CXCL12; CXCR4; VLA-4; antibody secreting cells; bone marrow; intravital imaging; migration; plasma cells.


Conflict of interest statement

Declaration of interests The authors declare no competing interests.

Figures

Figure 1.
Figure 1.. BM PCs are motile at hourlong timescales
(A) Intravital image of tibial BM in XY showing compact bone (blue), autofluorescent macrophages (MPs, orange), and Blimp1-YFP+ PCs (green). (B) Plotted 2-dimensional (x and y axes) cell tracks of PCs and MPs with a common origin. (C) Displacement of PCs and MPs at different timescales, with the percentage of moving cells (displacement > 20 μm) in parentheses. (D) Track velocity analysis. (E) Displacement velocity. (F) Frequency histogram of instantaneous velocities. (G) MSD plots for MPs and PCs. Error reflect SEM. (H) Comparison of track velocities versus ranges of mouse ages. (I) Samples of BM PC tracks exhibiting periods of both high and low displacement. (J) Analysis of all PC tracks with durations longer than 4 h. (K) Comparison of high and low displacement periods. Data in (B)–(K) except (H) were pooled from movies of three separate mice aged 16–36 weeks (n = ~1,200 cells, ~300 cells/mouse). Bars reflect means. Mann-Whitney t tests were conducted. ****p < 0.0001.
Figure 2.
Figure 2.. BM PC motility is reduced in PC clusters
(A) Representative intravital 3D flattened image of raw (left) and processed (right) PCs to classify PCs and clusters. (B) Percentage of all PCs in clusters (top), number of clusters normalized to imaging volume (middle), and number of PCs per cluster (bottom). (C) Comparison of parameters in (B) at different mouse ages (n = 1 mouse/dot, 3 independent experiments). (D–G) Comparison of PC tracks entirely inside or outside clusters. (D) Track velocity. (E) Displacement velocity. (F) Track straightness. (G) MSD. (H) Per-cell analysis of track speed of mixed PC tracks that entered and exited clusters. (I) Analysis of the percentage of PCs in clusters (as in B) over time. (J) Number of PCs per individual cluster. (K) Example spots of defined PCs before and after cluster dissipation. (L–N) Spots of defined PCs before and after cluster formation (L), and (M) their respective MSD and (N) paired track velocity. Scale bar is 20 μm. For (B)–(J) except (C), PCs from three 15- to 36-week-old mice were pooled and analyzed. All bars represent mean, and error is SEM. *p < 0.05, **p < 0.01, and ***p < 0.001 by Mann-Whitney tests, except (H), (N), which used paired t test analysis.
Figure 3.
Figure 3.. APRIL contributes to PC organization and motility
(A) Comparisons of PC frequencies and total numbers in BM and spleen with April+/+ (WT), April+/− (Het), and April−/− (KO) backgrounds. (B) Analysis of PC frequencies and total cell numbers in the BM of recipient mice 8 weeks following irradiation and reconstitution after donor BM, annotated as donor → recipient notation. (C) Sample tiled BM images of PCs (green) and autofluorescence (red) from Blimp-1 YFP bred into WT, Het, and KO backgrounds, analyzed in (D) and (E). (D) Analysis of the percentage of PCs in clusters per mouse in each background. (E) Comparison of the number of PC clusters, normalized to 1 mm3 of BM parenchyma. (F–H) Comparison of PC dynamics based on (F) track velocity, (G) displacement velocity, and (H) MSD analysis of displacement. Analysis is pooled from 3 or more mice in each April genetic background. For cell tracking, n = ~1,000 tracks, with ~300 cells/mouse, for (F)–(H). For plots in (A)–(E), n = 1 mouse/dot. All bars represent mean, and error is SEM. *p < 0.05, **p < 0.01, ***p < 0.001, and ****p < 0.0001 by Mann-Whitney t tests.
Figure 4.
Figure 4.. CXCR4 is required for BM PC motility
(A–E) Blimp1-YFP mice were injected intravenously (i.v.) with CXCR4 inhibitor AMD3100. Cell movement was tracked by intravital imaging of the tibia for 2–3 h before treatment (blue) and for 2–3 h immediately after treatment (red). (A) Examples of PC track movement of 3 individual PCs, color coded for before (blue) and after (red) AMD3100 treatment (left), with corresponding measurements of instantaneous velocity for each cell over time (right). (B–E) Pooled measurement of PC motility before and after AMD3100 treatment from 2 independent experiments, with ~200 cells/mouse. (B) Track velocity. (C) Displacement velocity. (D) MSD. (E) Example images of PC morphology and analysis of sphericity of PCs. Scale bar is 5 μm. (F–L) Each dot represents a mouse, and each color represents mice from 3 independent experiments. (F) Analysis of surface CXCR4 levels on PCs (CD138high B220) or B cells (B220high) of BM cells in 6-, 15-, 32-, and 50-week-old mice. (G) Enumeration of BM PCs in mice in (F). (H) Analysis of CXCR4 as a function of BM PC numbers pooled from mice of different ages, as labeled in the legend. (I) Total (intracellular and surface) CXCR4 levels in BM PCs in 6- and 15-week-old mice. (J) Cxcr4 RNA, normalized to β-actin in fluorescence-activated cell-sorted PCs and B cells in 6- and 15-week-old mice. (K) Experimental schema for comparing age-matched, de novo-generated, NP-specific (YFP+) PCs and age-matched recipients following immunization with NP-KLH. (L) Analysis of CXCR4 surface levels on NP-specific (YFP+ CD138high) BM PCs, with PC and mouse ages marked. (M) Pooled single-cell analysis of CXCR4 versus BLIMP values for PBs and PCs from experiments in (K) and (L). Linear fit (red) was found to be a significant (non-zero) positive slope. All bars reflect mean, errors are SEM. Comparisons were conducted by Mann-Whitney t test. *p < 0.05, **p < 0.01, ***p < 0.001, ****p < 0.0001.
Figure 5.
Figure 5.. CXCL12 promotes PC motility in the BM
(A–C) Blimp 1-YFP mice were injected i.v. with either CXCL12 neutralizing antibody or isotype control antibody. Cell movement was tracked by intravital imaging of the tibia for at least 4 h after treatment. (A) Track velocity of PCs. (B) Displacement velocity of PCs. (C) MSD of PCs over time. Numbers depict the average mean motility coefficient of 3 and 2 individual experiments for CXCL12 neutralizing antibody and isotype control antibody treatments, respectively. Data are pooled from 3 and 2 individual experiments for CXCL12 neutralizing antibody and isotype control antibody treatments, respectively, with ~300 cells/mouse. (D) Transwell migration analysis of BM B cells and PCs, analyzed and normalized to input bulk BM from 6- and 15-week-old mice, in the presence or absence of CXCL12 in the lower chamber and with or without AMD3100 pretreatment. (E) Analysis of CXCL12 protein in BM supernatant by ELISA. (F) Analysis of Cxcl12 total RNA in 6-, 15-, 32-, and 50-week-old mice normalized to a β-actin transcript. (G) Analysis of Cxcl12 α, β, and γ isoforms, shown as the percentage of the total Cxcl12 transcript. Data in (D)–(F) were pooled from 2 independent experiments, each dot represents 1 mouse. In (G), technical replicates (3 per sample) and biological replicates (n = 4 mice total) from two experiments were averaged. All quantification plots show mean. *p < 0.05, **p < 0.01, ***p < 0.001, and ****p < 0.0001 by unpaired Mann-Whitney U test.
Figure 6.
Figure 6.. VLA4 promotes PC arrest in the BM
(A–D) Blimp1-YFP mice were injected i.v. with VLA4 inhibitor BOP. Cell movement was tracked by intravital imaging of the tibia for 2–3 h before treatment (blue) and for 5–6 h immediately after treatment (red). (A) Examples of movement of 3 individual PCs shown by colored trajectories before (blue) and after (red) BOP treatment. (B) Track velocity of PCs. (C) Displacement velocity of PCs. (D) MSD of PCs over time. Slopes indicate the average mean motility coefficient of 2 individual experiments. Data are pooled from 2 individual mouse experiments, with ~300 cells/mouse. All quantification plots show mean. *p < 0.05, **p < 0.01, ***p < 0.001, and ****p < 0.0001 by unpaired Mann-Whitney U test. (E–I) In vitro live-cell imaging and analysis of PB/PC motility and adhesion on various substrates with or without BOP treatment. (E) Interference reflection microscopy (IRM) footprint in gray, Blimp1-YFP+ (green) PB/PC cell, and tracks (red lines) on ICAM-1, VCAM-1, fibronectin, or ICAM-1+VCAM-1 (20:80 mix) substrates. (F) Analysis of frequency of PBs with adhesion (based on an IRM pattern) on various substrates with or without BOP pretreatment (dots indicate the average for each independent experiment). (G) PB track velocity from imaging ± BOP treatment. (H) PB track displacement (20-minute fixed movies) ± BOP treatment. (I) Track velocity from BM PCs, ex vivo imaging ± BOP treatment. Each dot in (G)–(I) is a single-cell track, pooled from 2–3 independent experiments per mouse per condition. All quantification plots show mean. Errors are SEM. *p < 0.05, **p < 0.01, ***p < 0.001, and ****p < 0.0001 by Mann-Whitney test.
Figure 7.
Figure 7.. BM PC mobilization and steady-state recirculation patterns
(A) Number of PCs in the blood of C57BL/6 mice i.v. treated with PBS, 80 μg of AMD3100, 250 μg of BOP, or both AMD3100 and BOP for 4 h. Bars represent mean, and error is SEM (each dot is an independent mouse, n = 4–7 mice/group, 3 experiments). (B) Percentage of PCs detected in intravital two-photon imaging compared with the initial imaging frame of the tibial BM (2–4 mice per group). (C) Number of PCs in the blood of C57BL/6 mice i.v. treated with PBS, 80 of μg AMD3100, 300 of μg αVLA4 antibody, or both AMD3100 and αVLA4 antibody for 4 h. Bars represent mean, and error is SEM (n = 2–4 mice/group, 4 experiments). (D) Fold change of PCs in the blood of C57BL/6 mice treated with 80 μg of anti-CXCL12 antibody or isotype. Bars represent mean, and error is SEM (n = 4–5 mice/group, 4 experiments, normalized to isotype). (E) Number of PCs in the blood of C57BL/6 mice i.v. treated with PBS, FTY720 (FTY), AMD+BOP as before, and FTY720+AMD+BOP. (F–I) Direct tibial labeling of PCs. (F) Specificity of labeling at 1 day post treatent. with 5 μg of 4HT on gated PCs. Kinetics of recirculation of (G) labeled PCs and (H) B cells (left), and their ratios of labeled cells in the CL to the injected tibia (right). (I) Comparison of ratios of the percentage of tomato+-labeled PCs in the CL versus the injected paired tibia of 14- to 18-week-old mice (closed circle, data shown in G) and 6- to 8-week-old mice (open circle). In (F)–(H), n = 1–3 mice/group, 3 experiments. All bars represent mean, and error is SEM. *p < 0.05, **p < 0.01, ***p < 0.001, and ****p < 0.0001.

References

    1. Beck TC, Gomes AC, Cyster JG, and Pereira JP (2014). CXCR4 and a cell-extrinsic mechanism control immature B lymphocyte egress from bone marrow. J. Exp. Med 211, 2567–2581. - PMC - PubMed
    1. Cancro MP (2020). Age-Associated B Cells. Annu. Rev. Immunol 38, 315–340. - PubMed
    1. Cao B, Zhang Z, Grassinger J, Williams B, Heazlewood CK, Churches QI, James SA, Li S, Papayannopoulou T, and Nilsson SK (2016). Therapeutic targeting and rapid mobilization of endosteal HSC using a small molecule integrin antagonist. Nat. Commun 7, 11007. - PMC - PubMed
    1. Chu VT, Fröhlich A, Steinhauser G, Scheel T, Roch T, Fillatreau S, Lee JJ, Löhning M, and Berek C (2011). Eosinophils are required for the maintenance of plasma cells in the bone marrow. Nat. Immunol 12, 151–159. - PubMed
    1. Cornelis R, Hahne S, Taddeo A, Petkau G, Malko D, Durek P, Thiem M, Heiberger L, Peter L, Mohr E, et al. (2020). Stromal cell-contact dependent PI3K and APRIL induced NF-κB signaling prevent mitochondrial- and ER stress induced death of memory plasma cells. Cell Rep. 32, 107982. - PMC - PubMed

Publication types

MeSH terms

LinkOut - more resources