. 2021 Apr;592(7855):616-622.
doi: 10.1038/s41586-021-03324-6. Epub 2021 Feb 10.

mRNA vaccine-elicited antibodies to SARS-CoV-2 and circulating variants

Affiliations

mRNA vaccine-elicited antibodies to SARS-CoV-2 and circulating variants

Zijun Wang et al. Nature. 2021 Apr.

Abstract

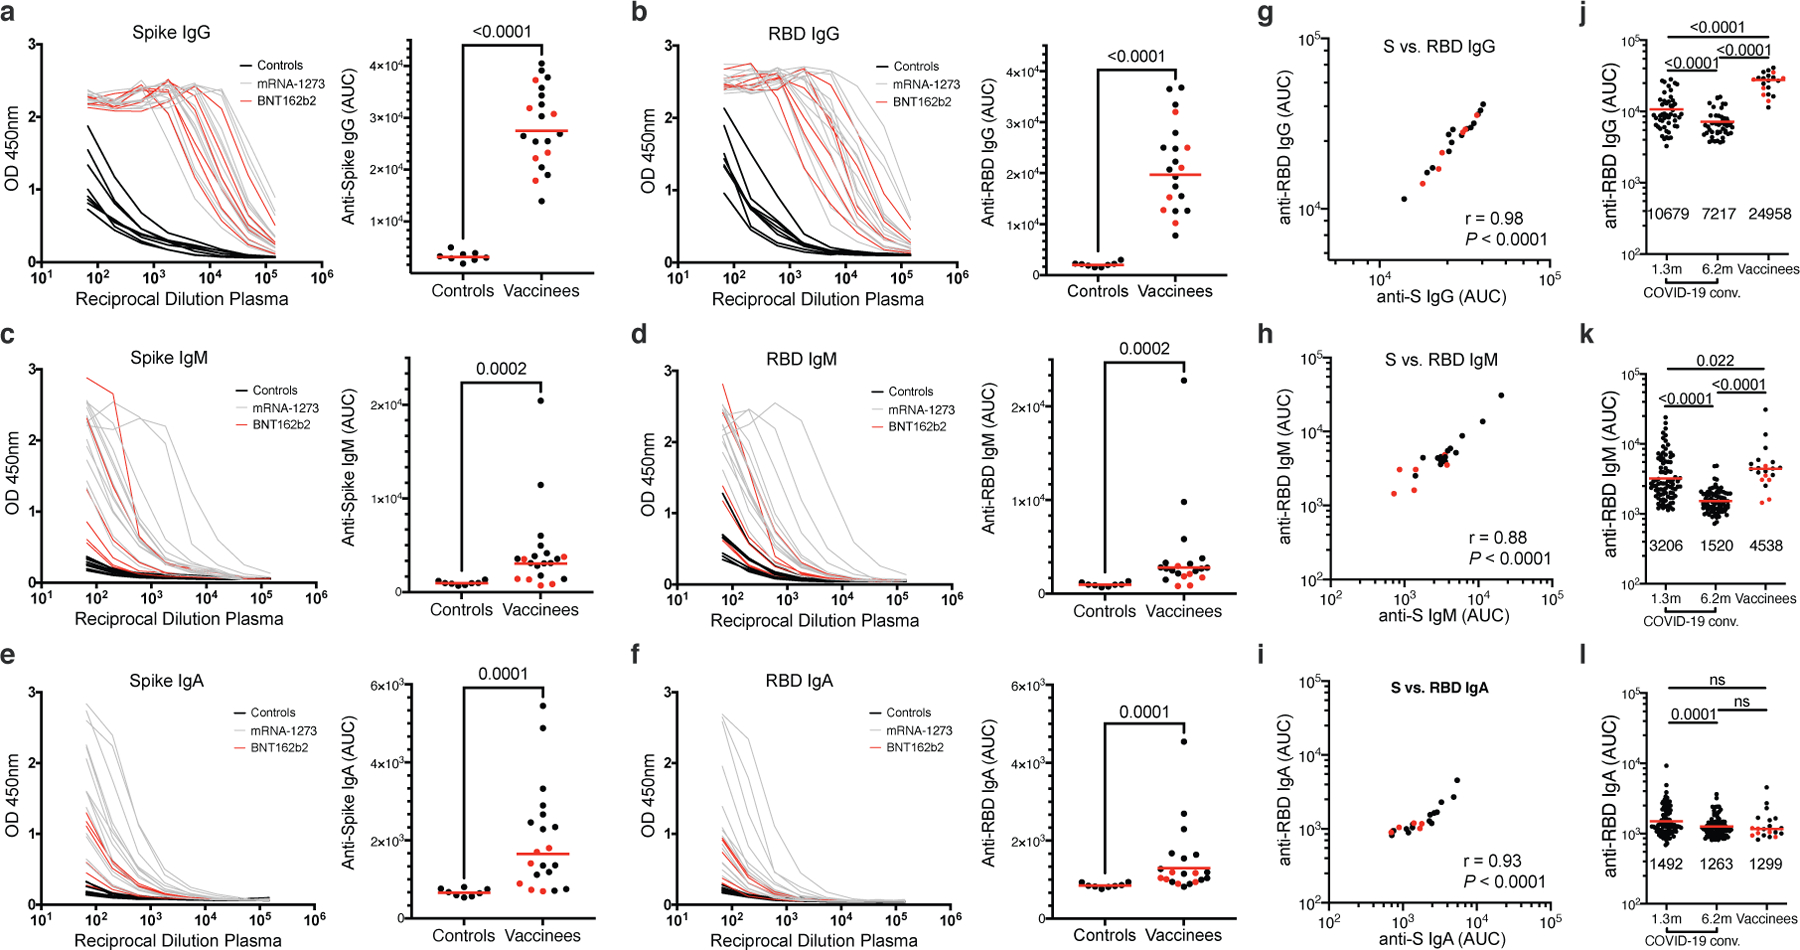
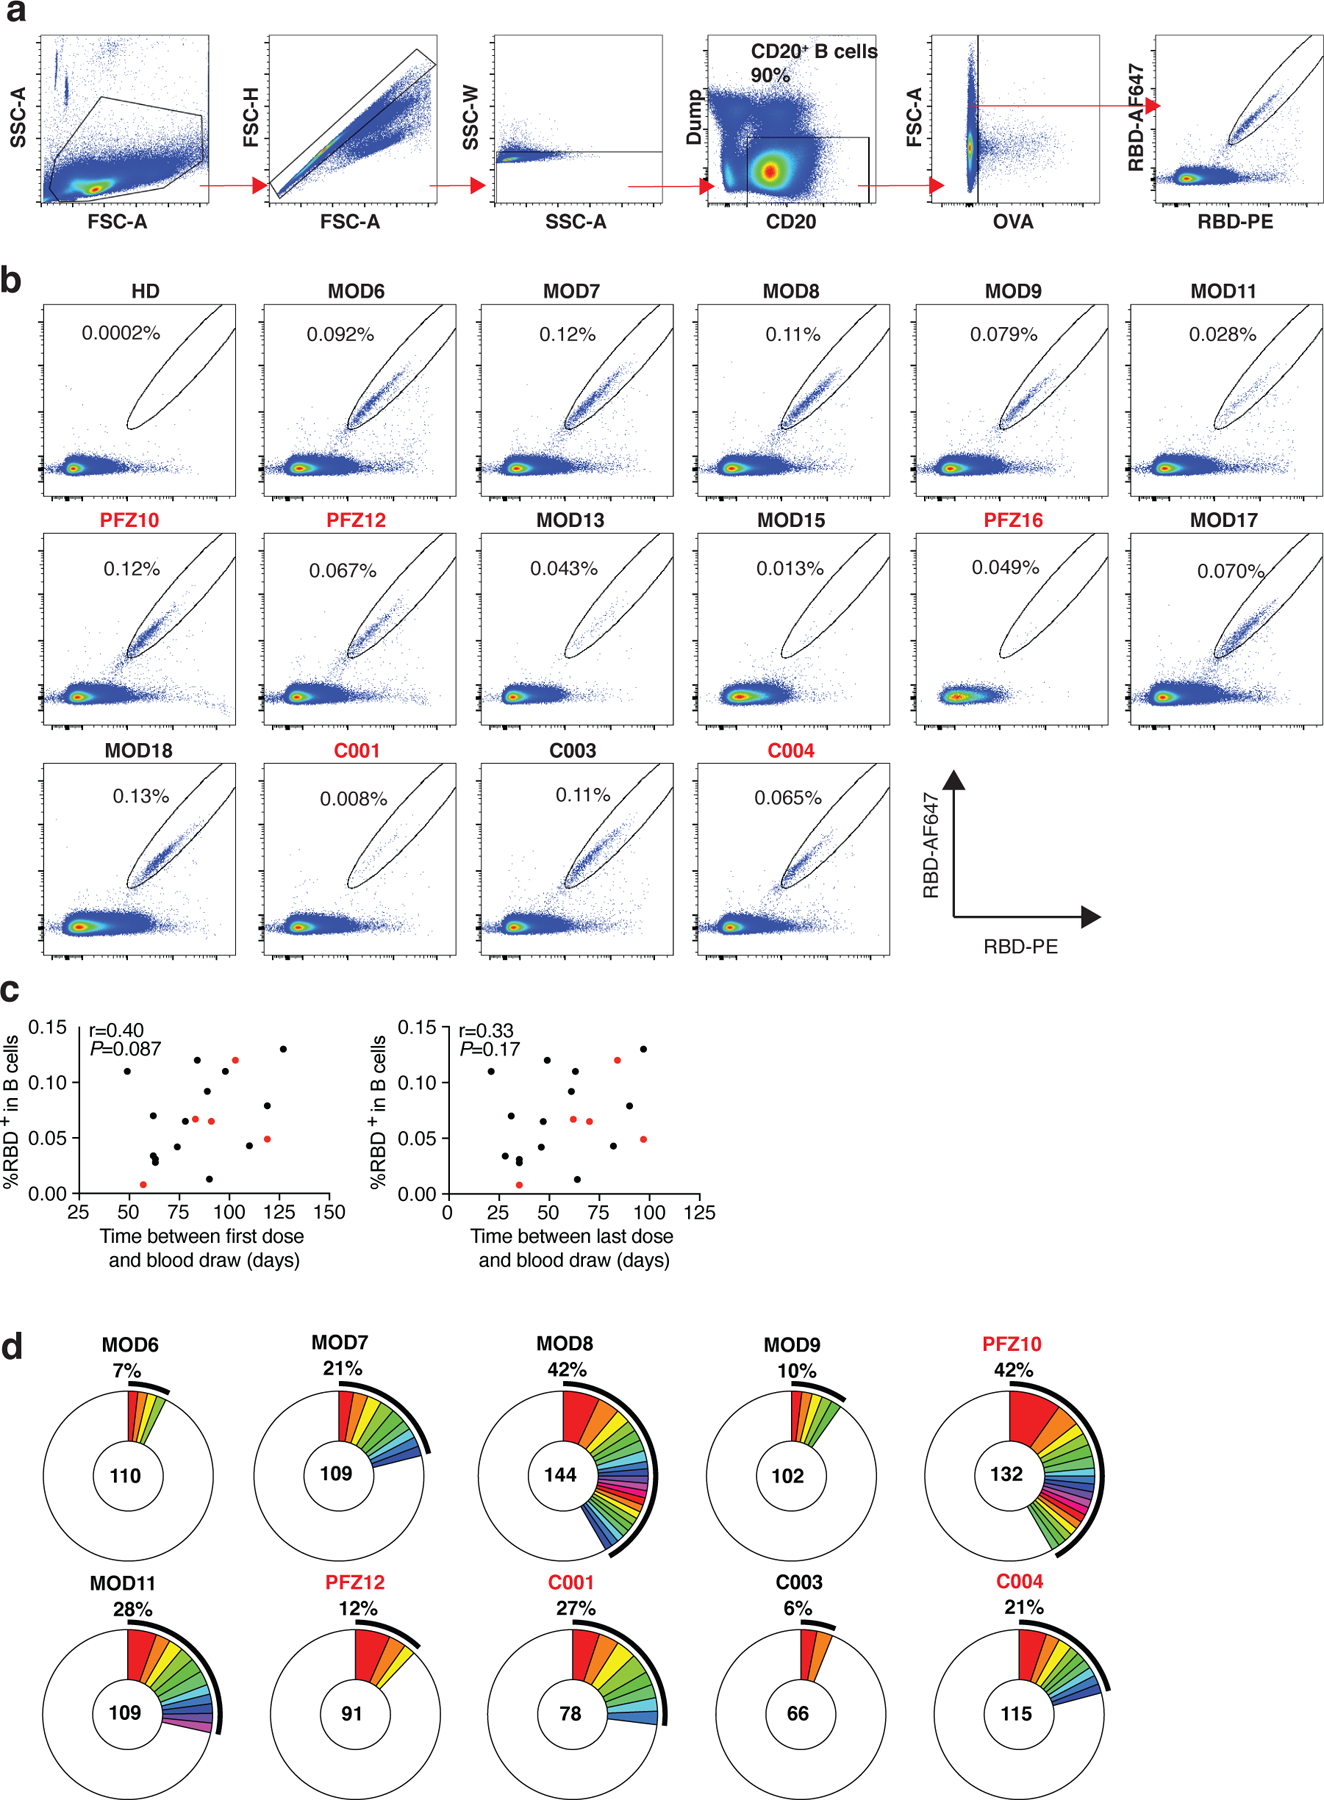
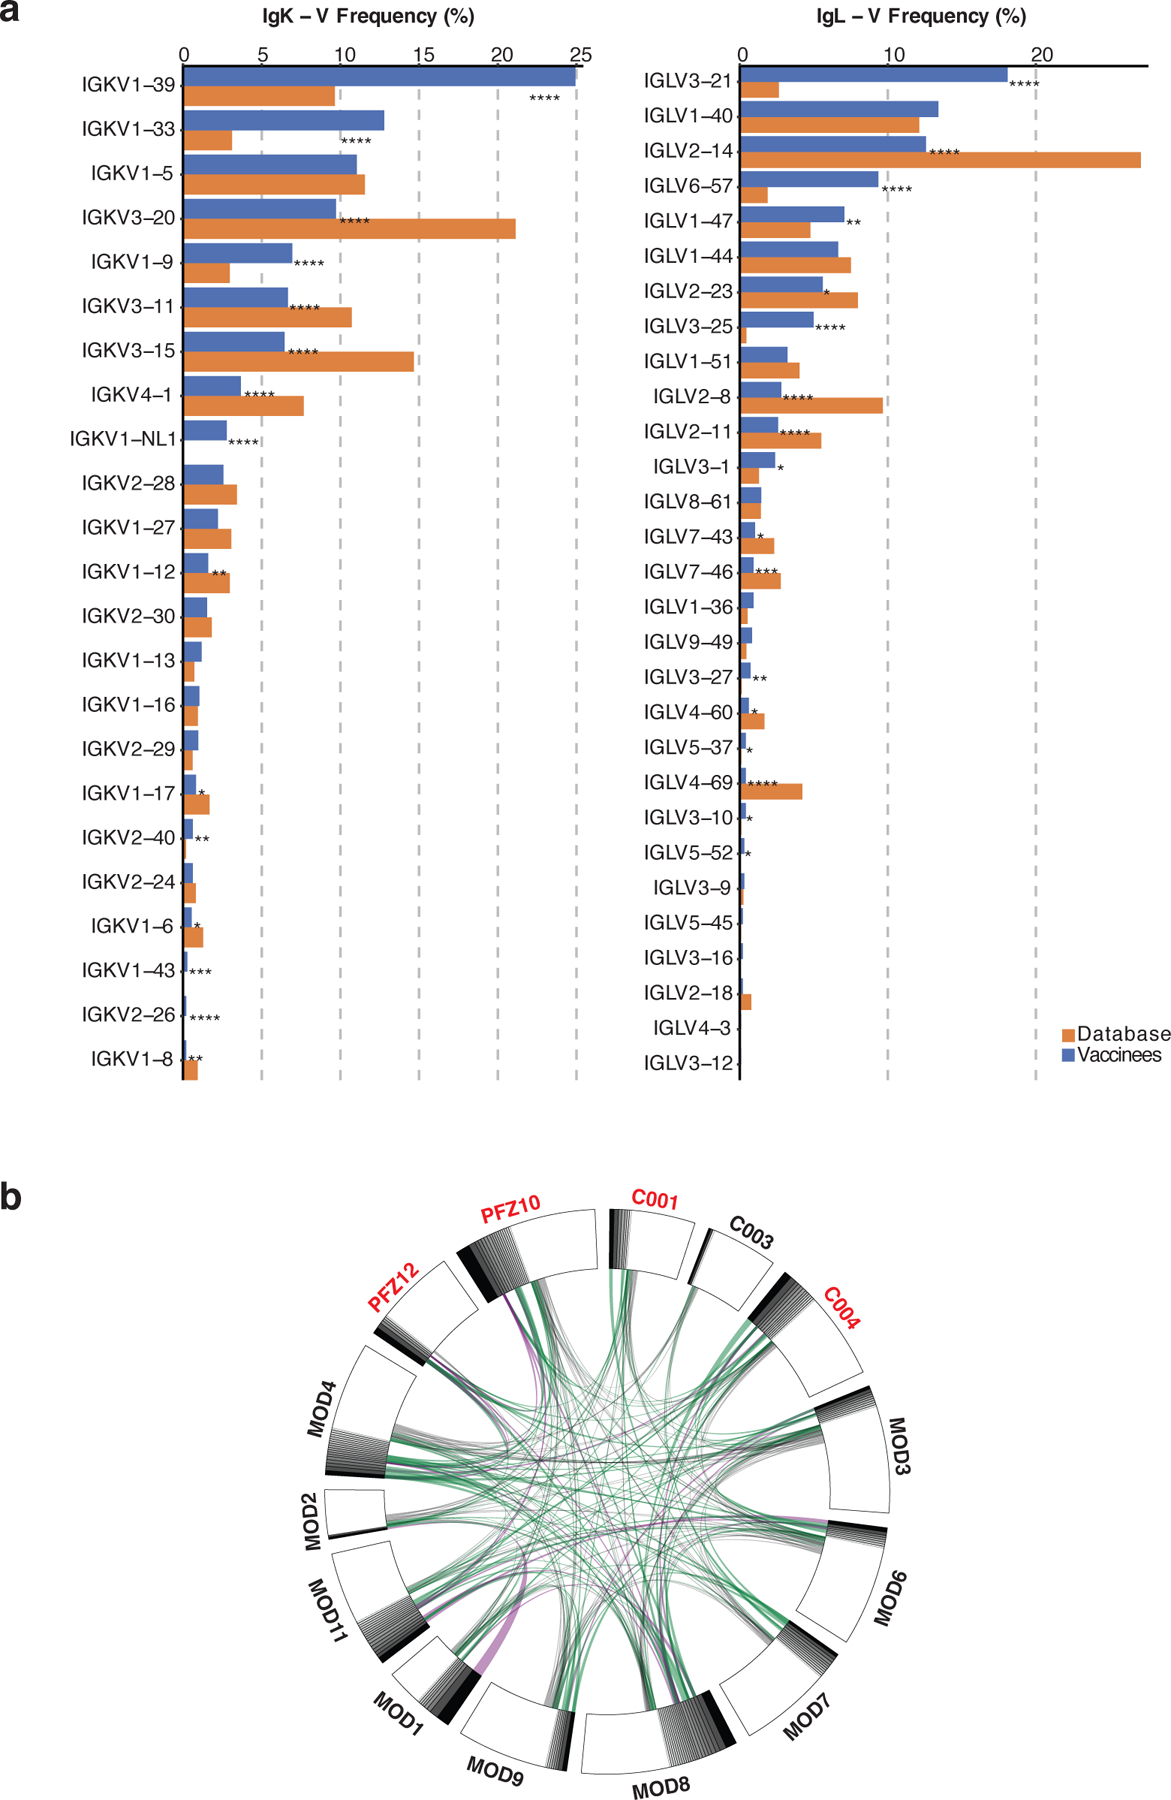
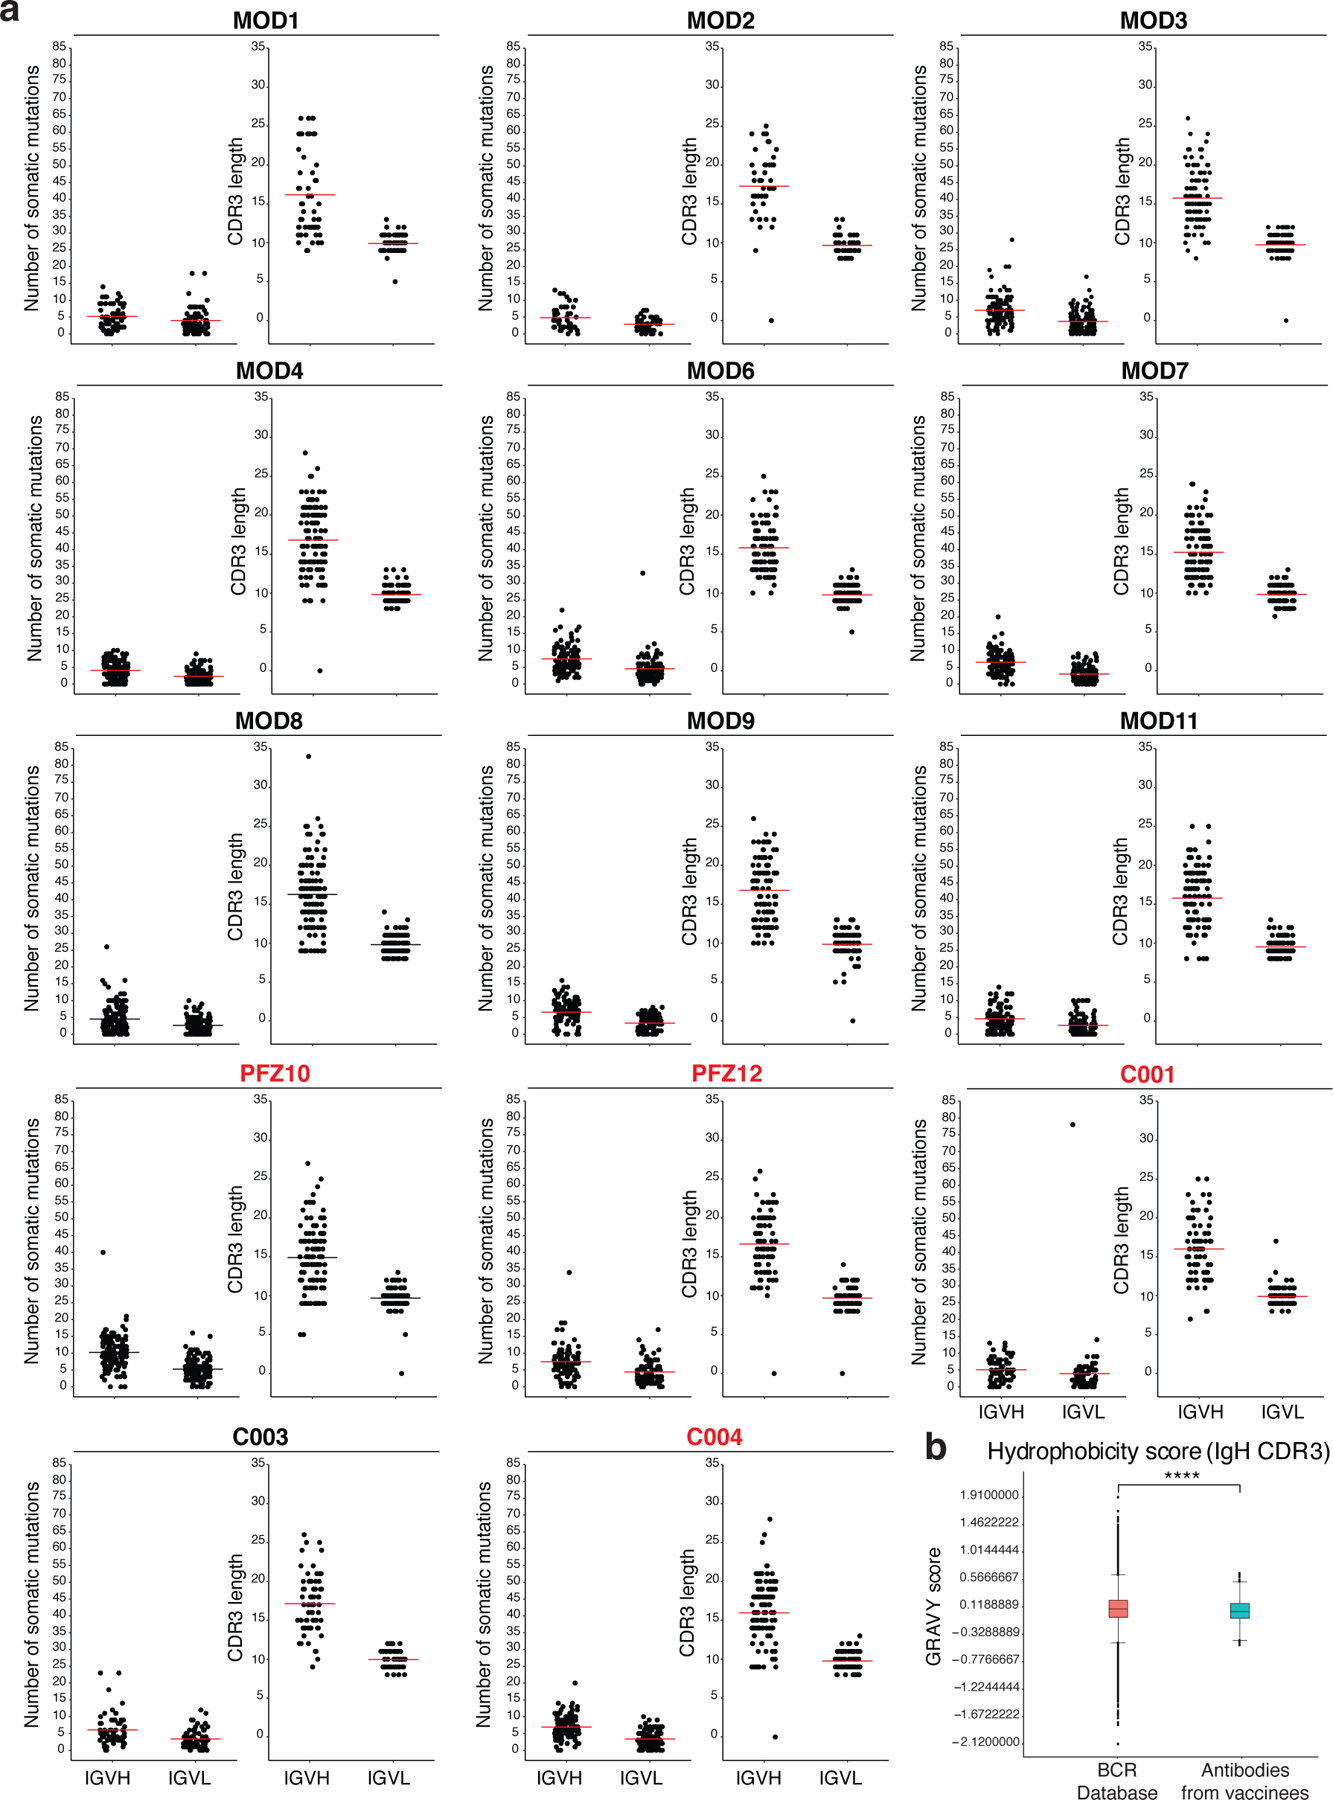
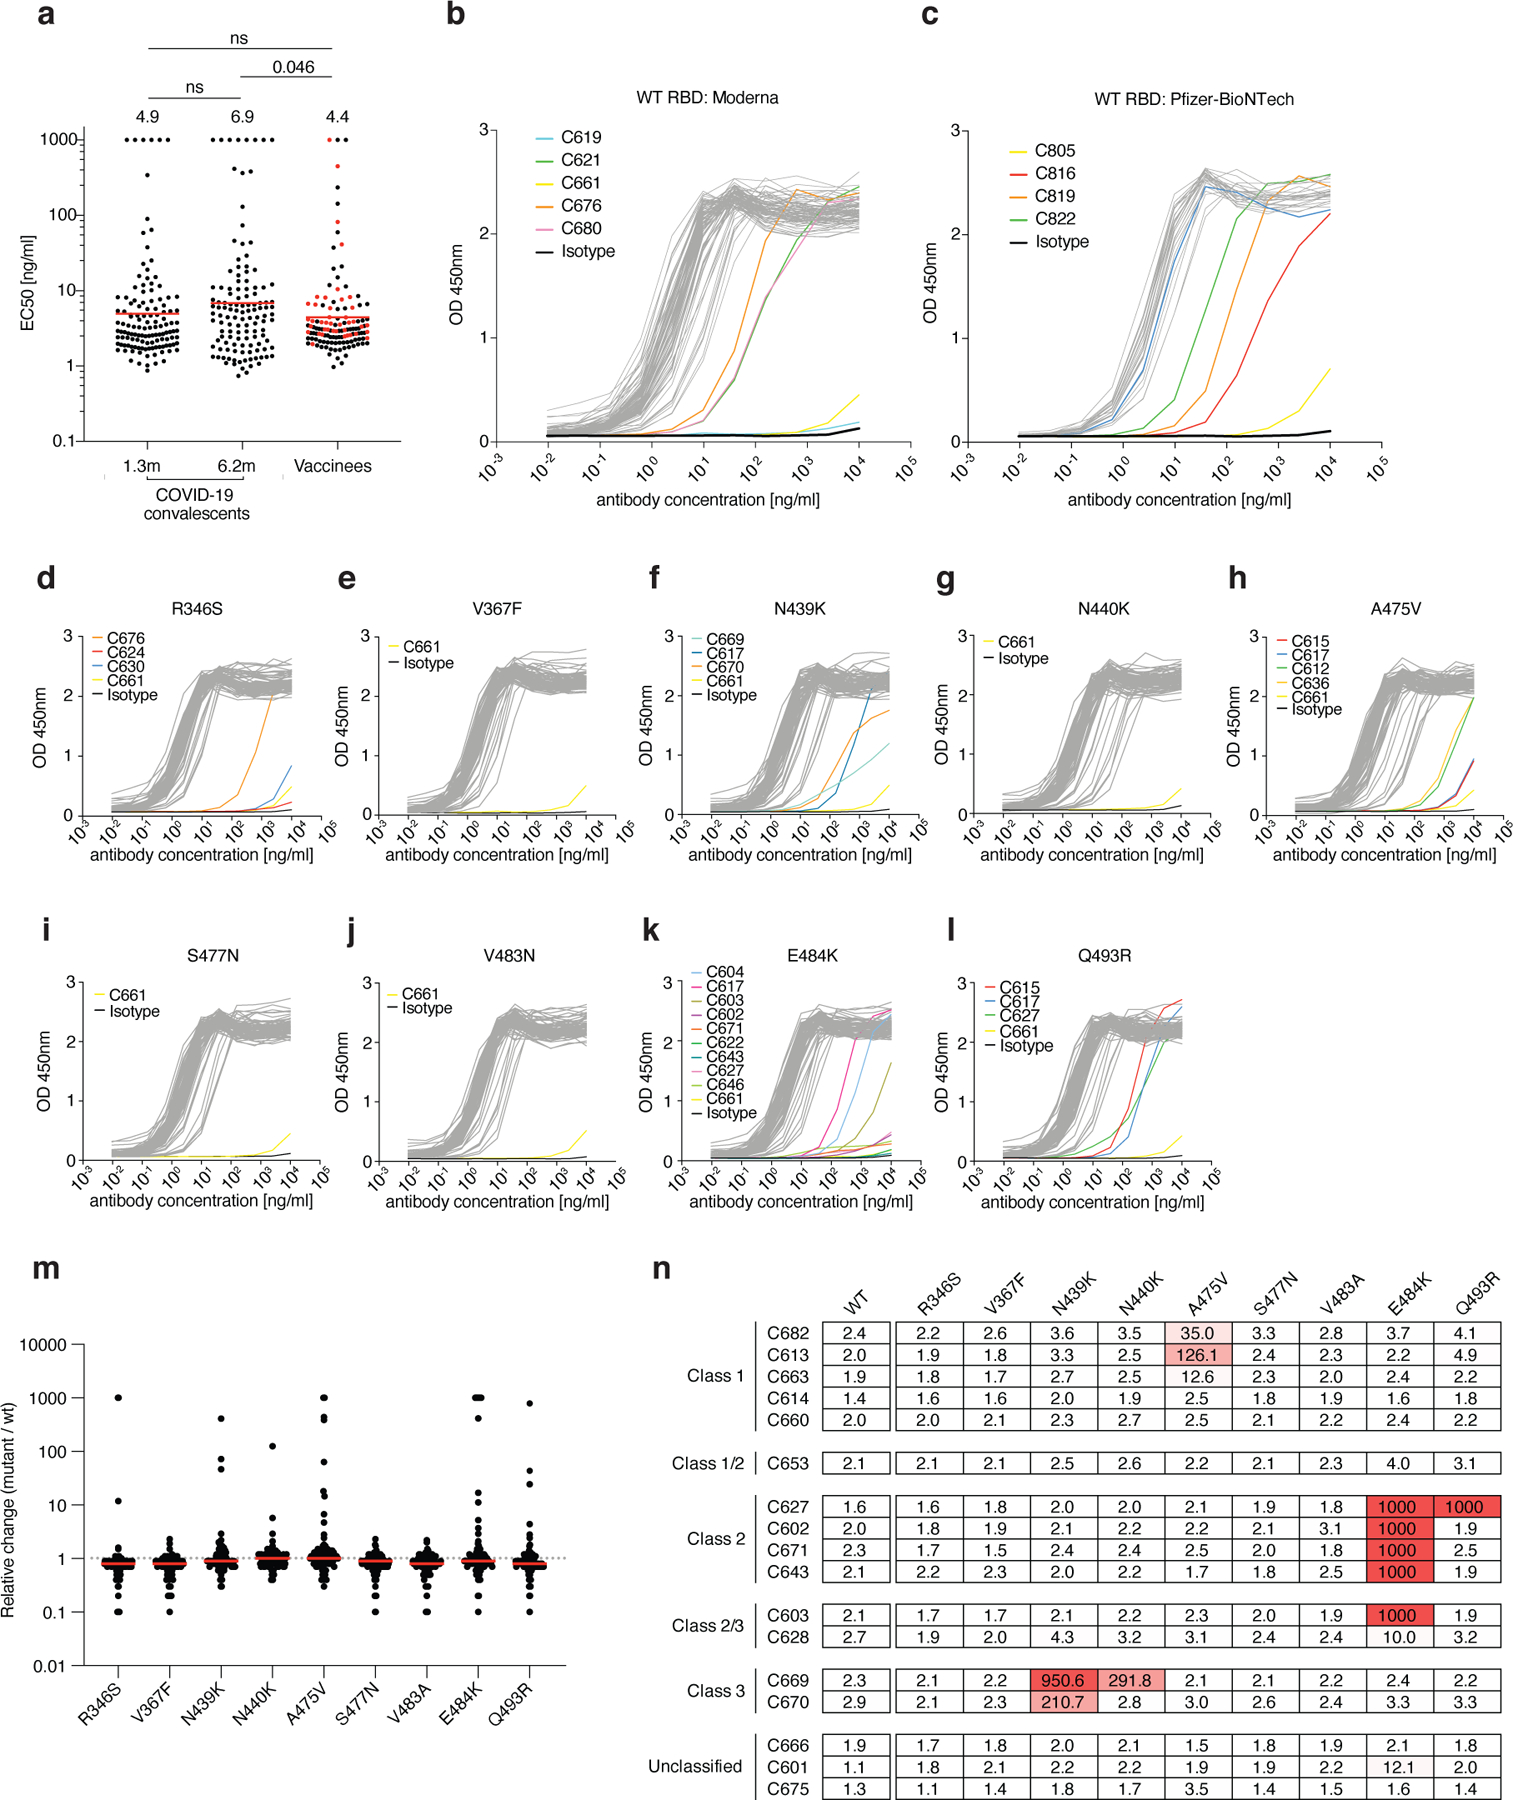
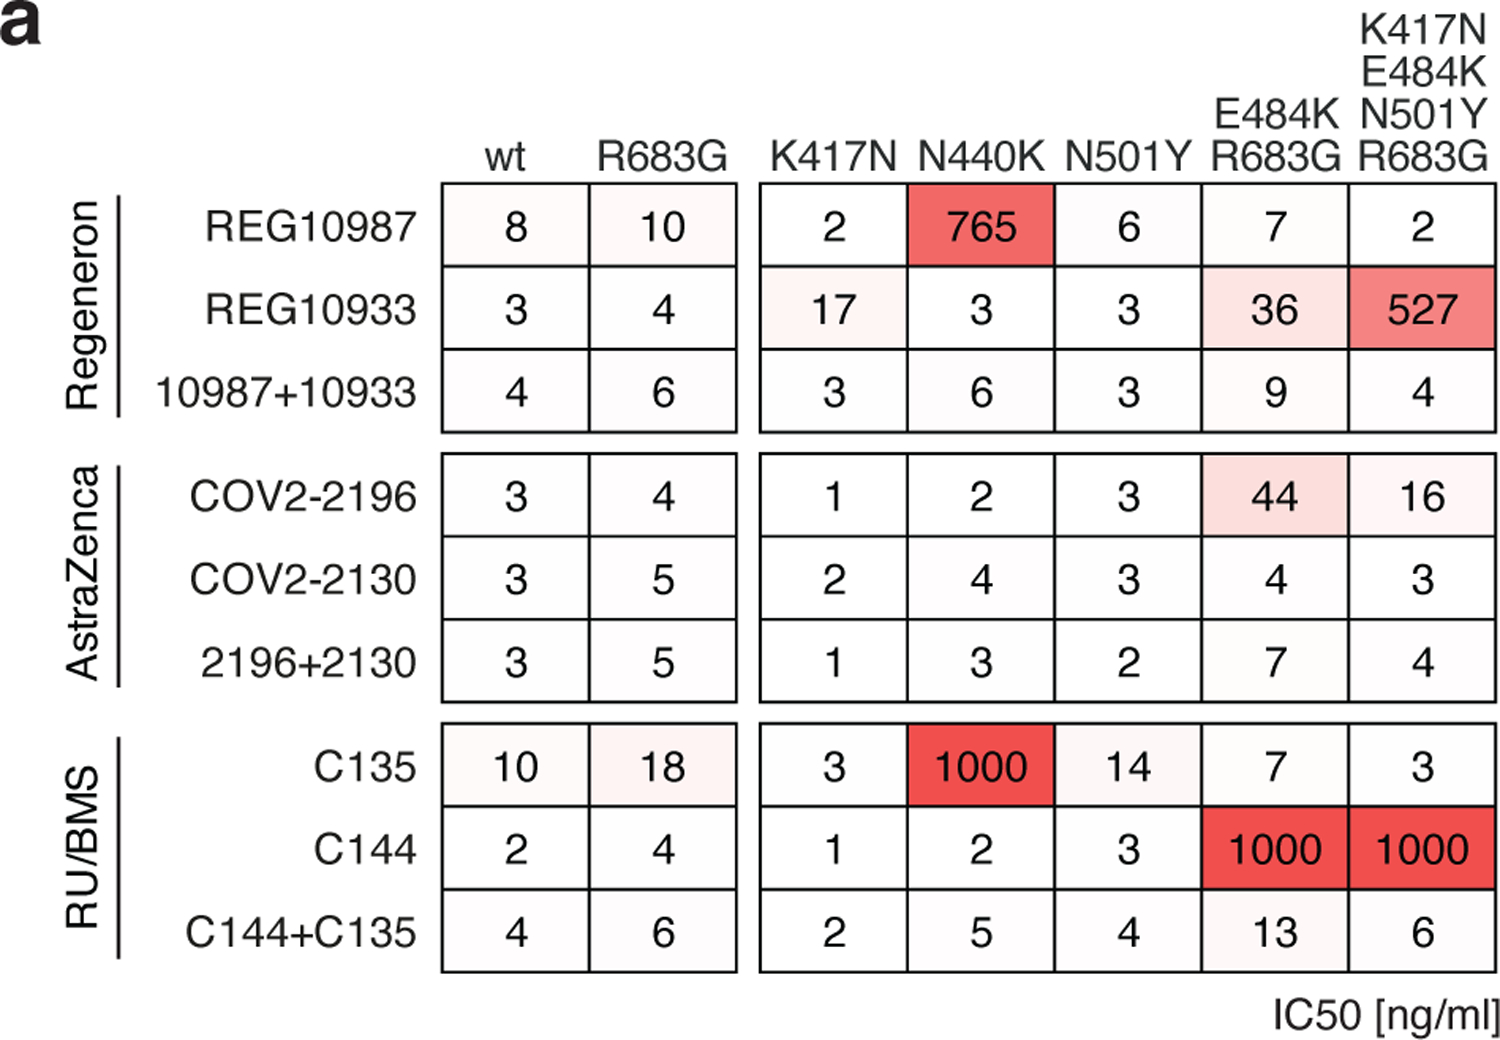
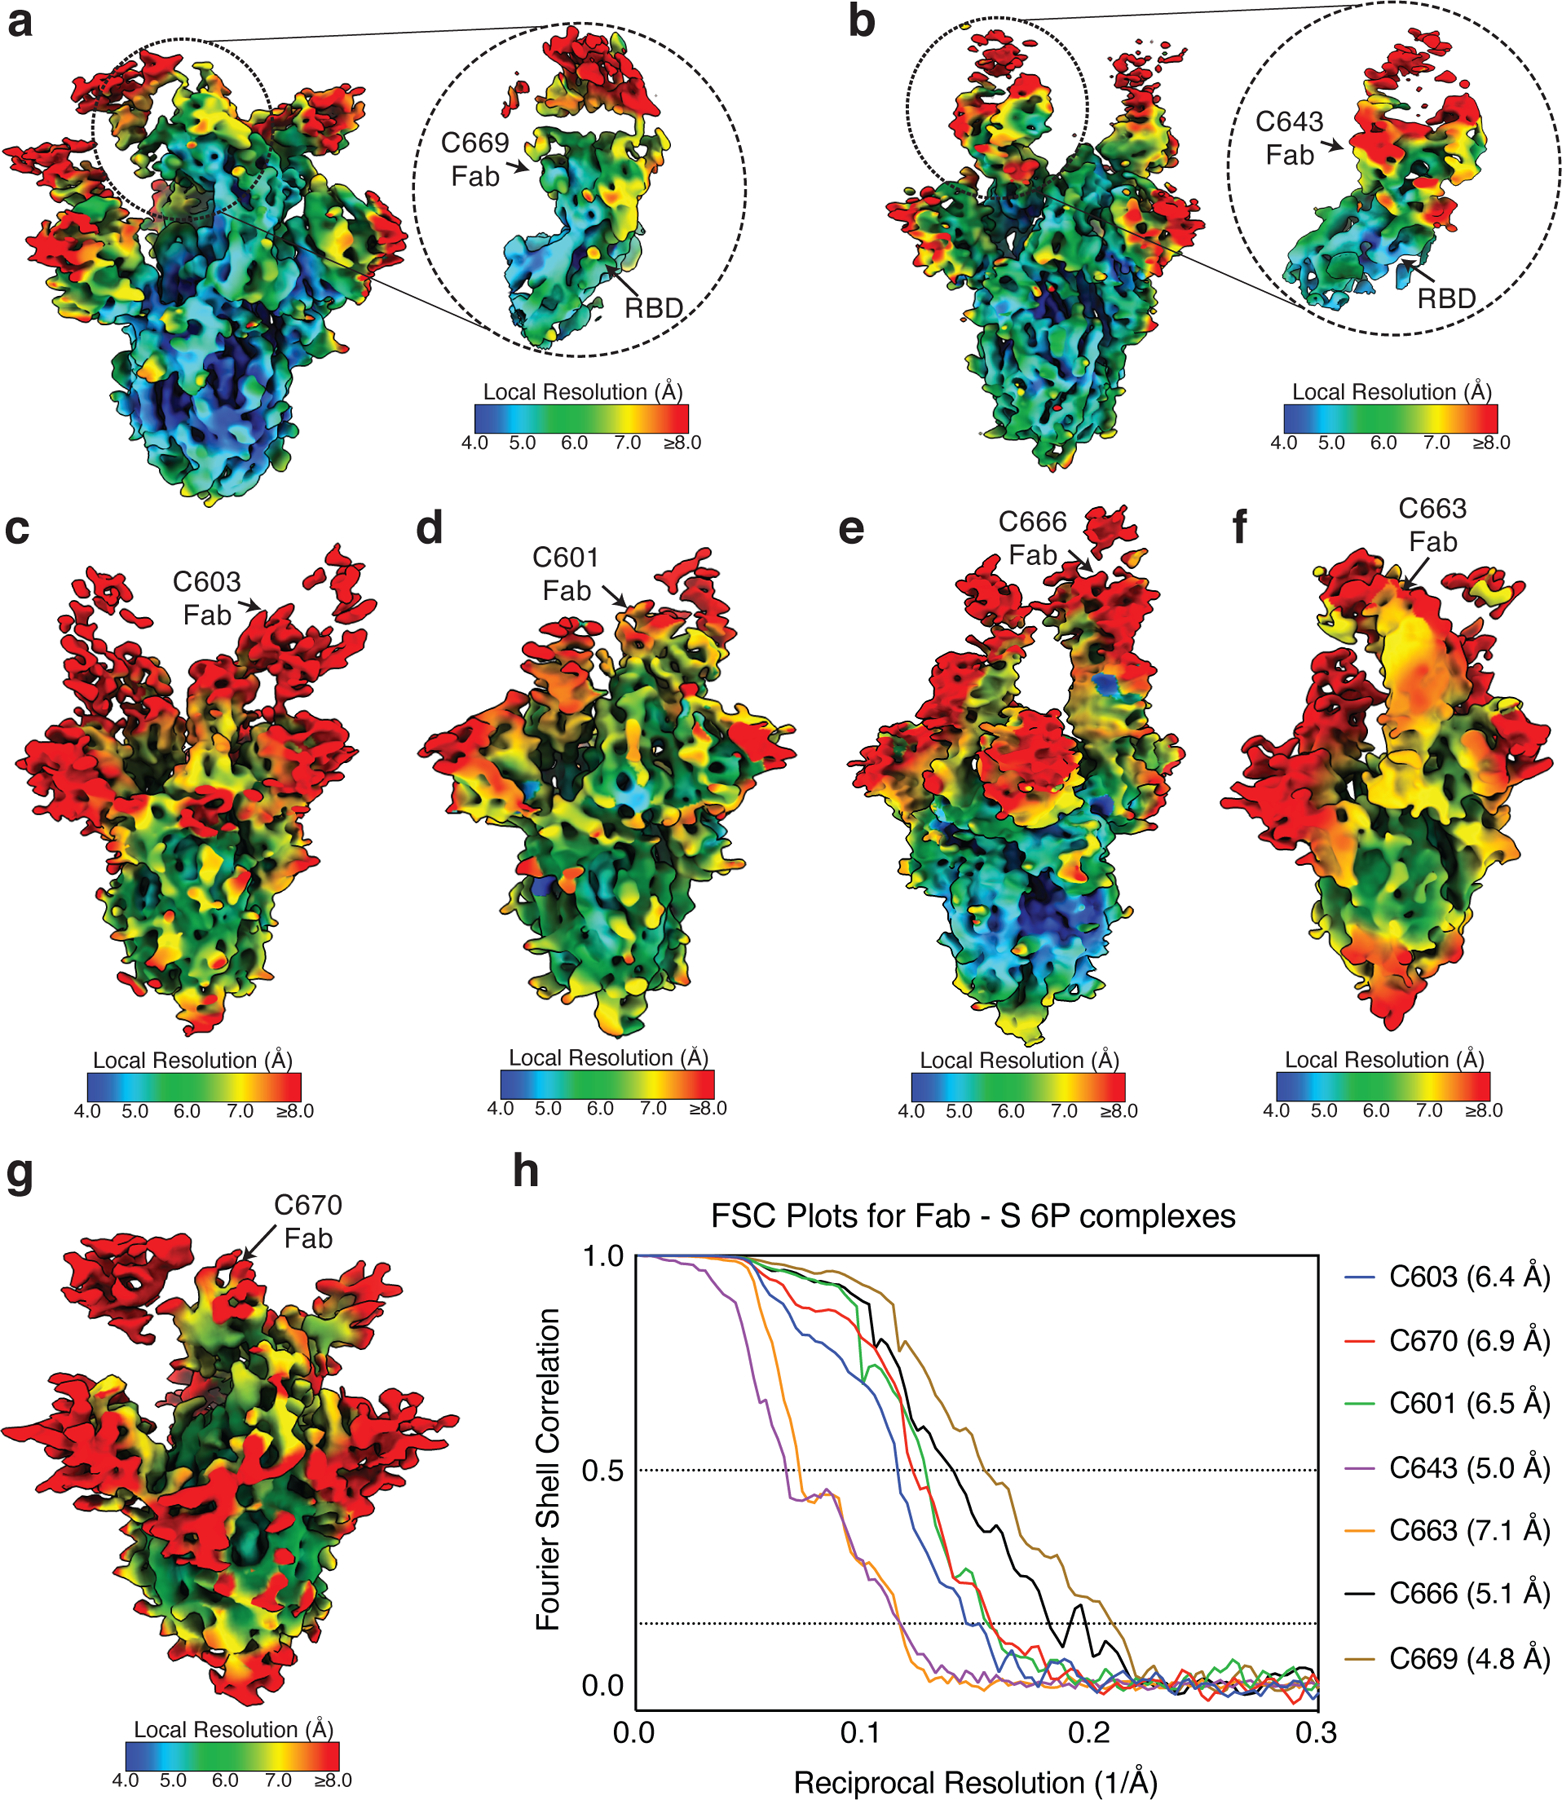
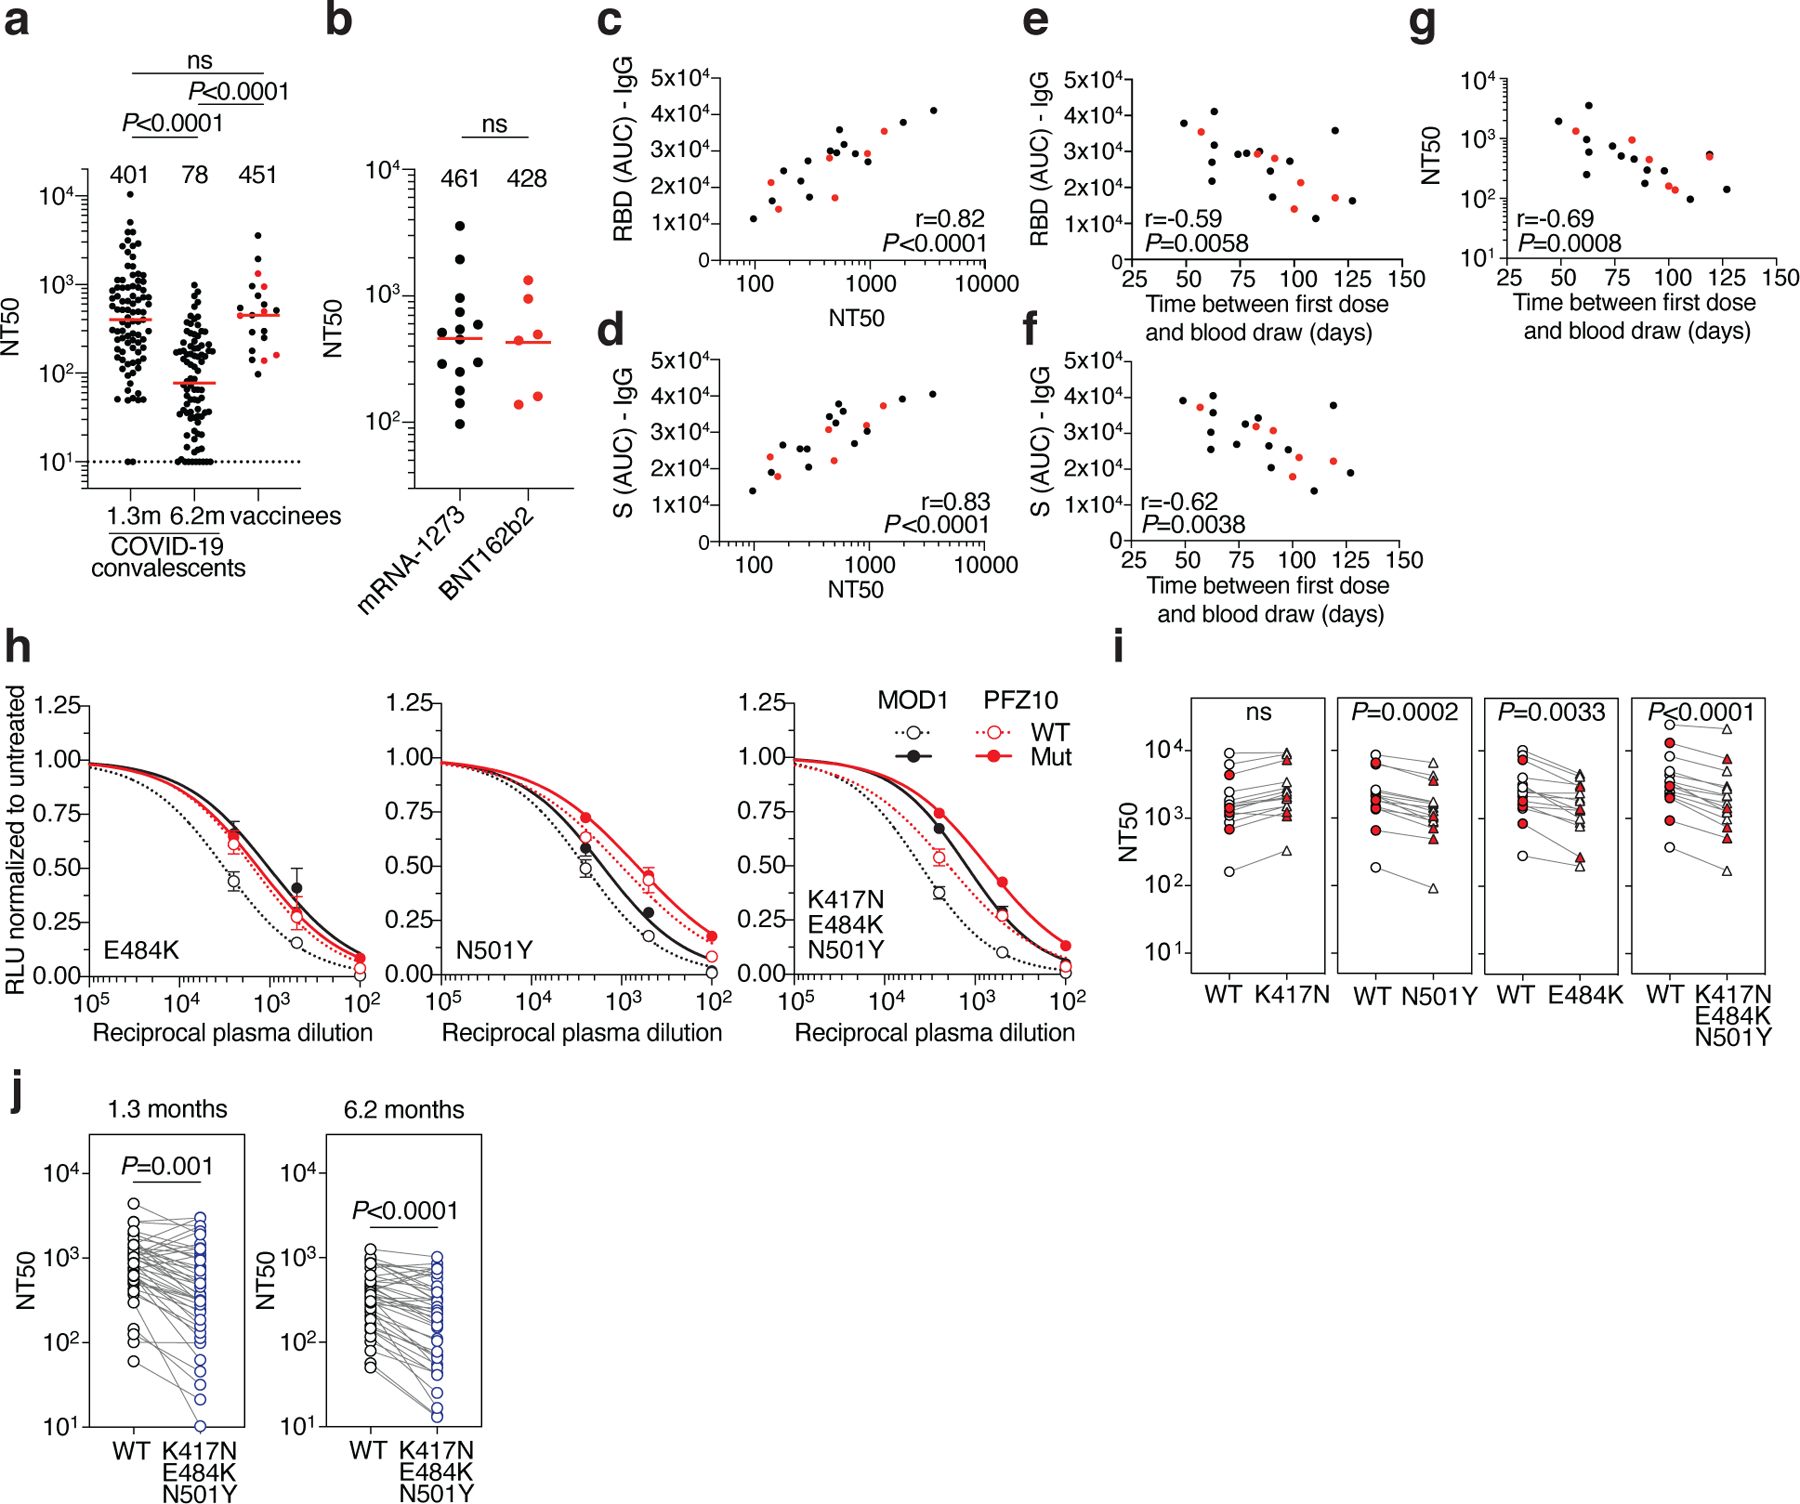
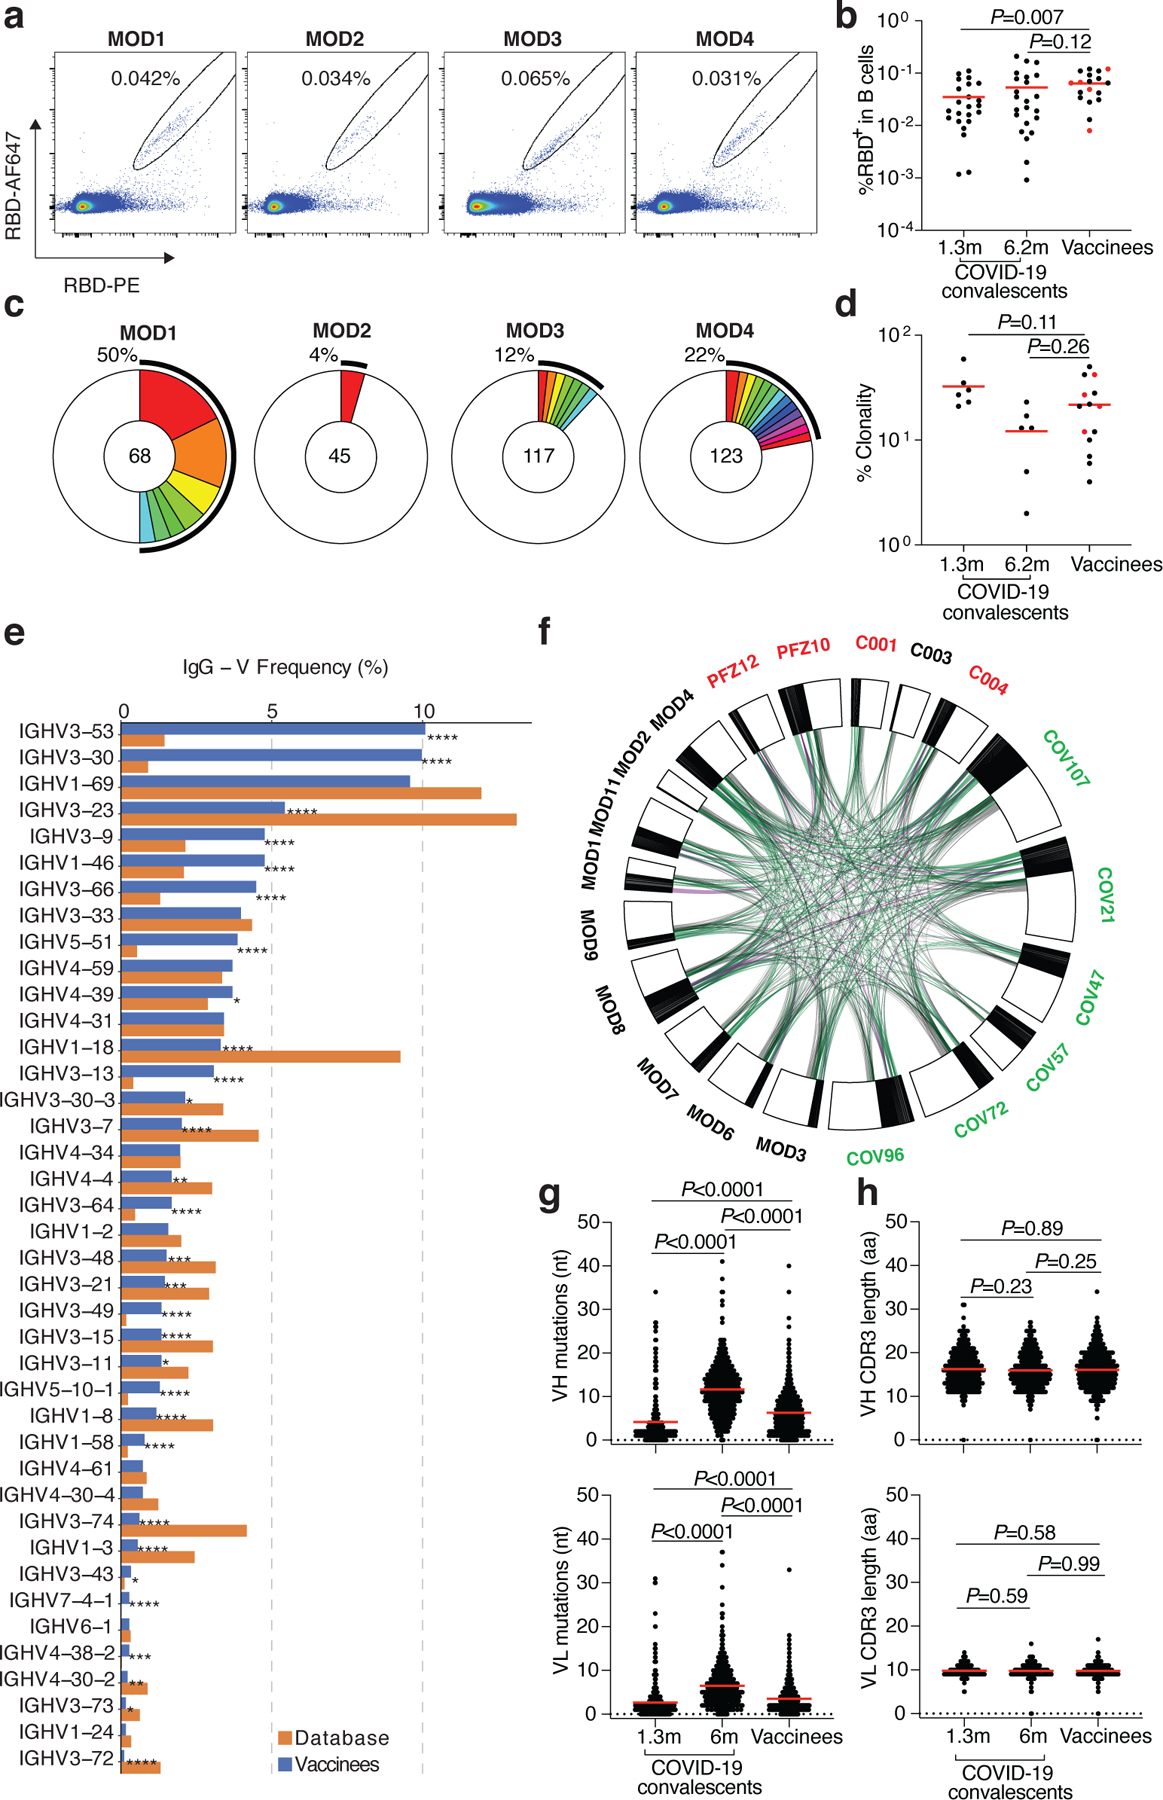
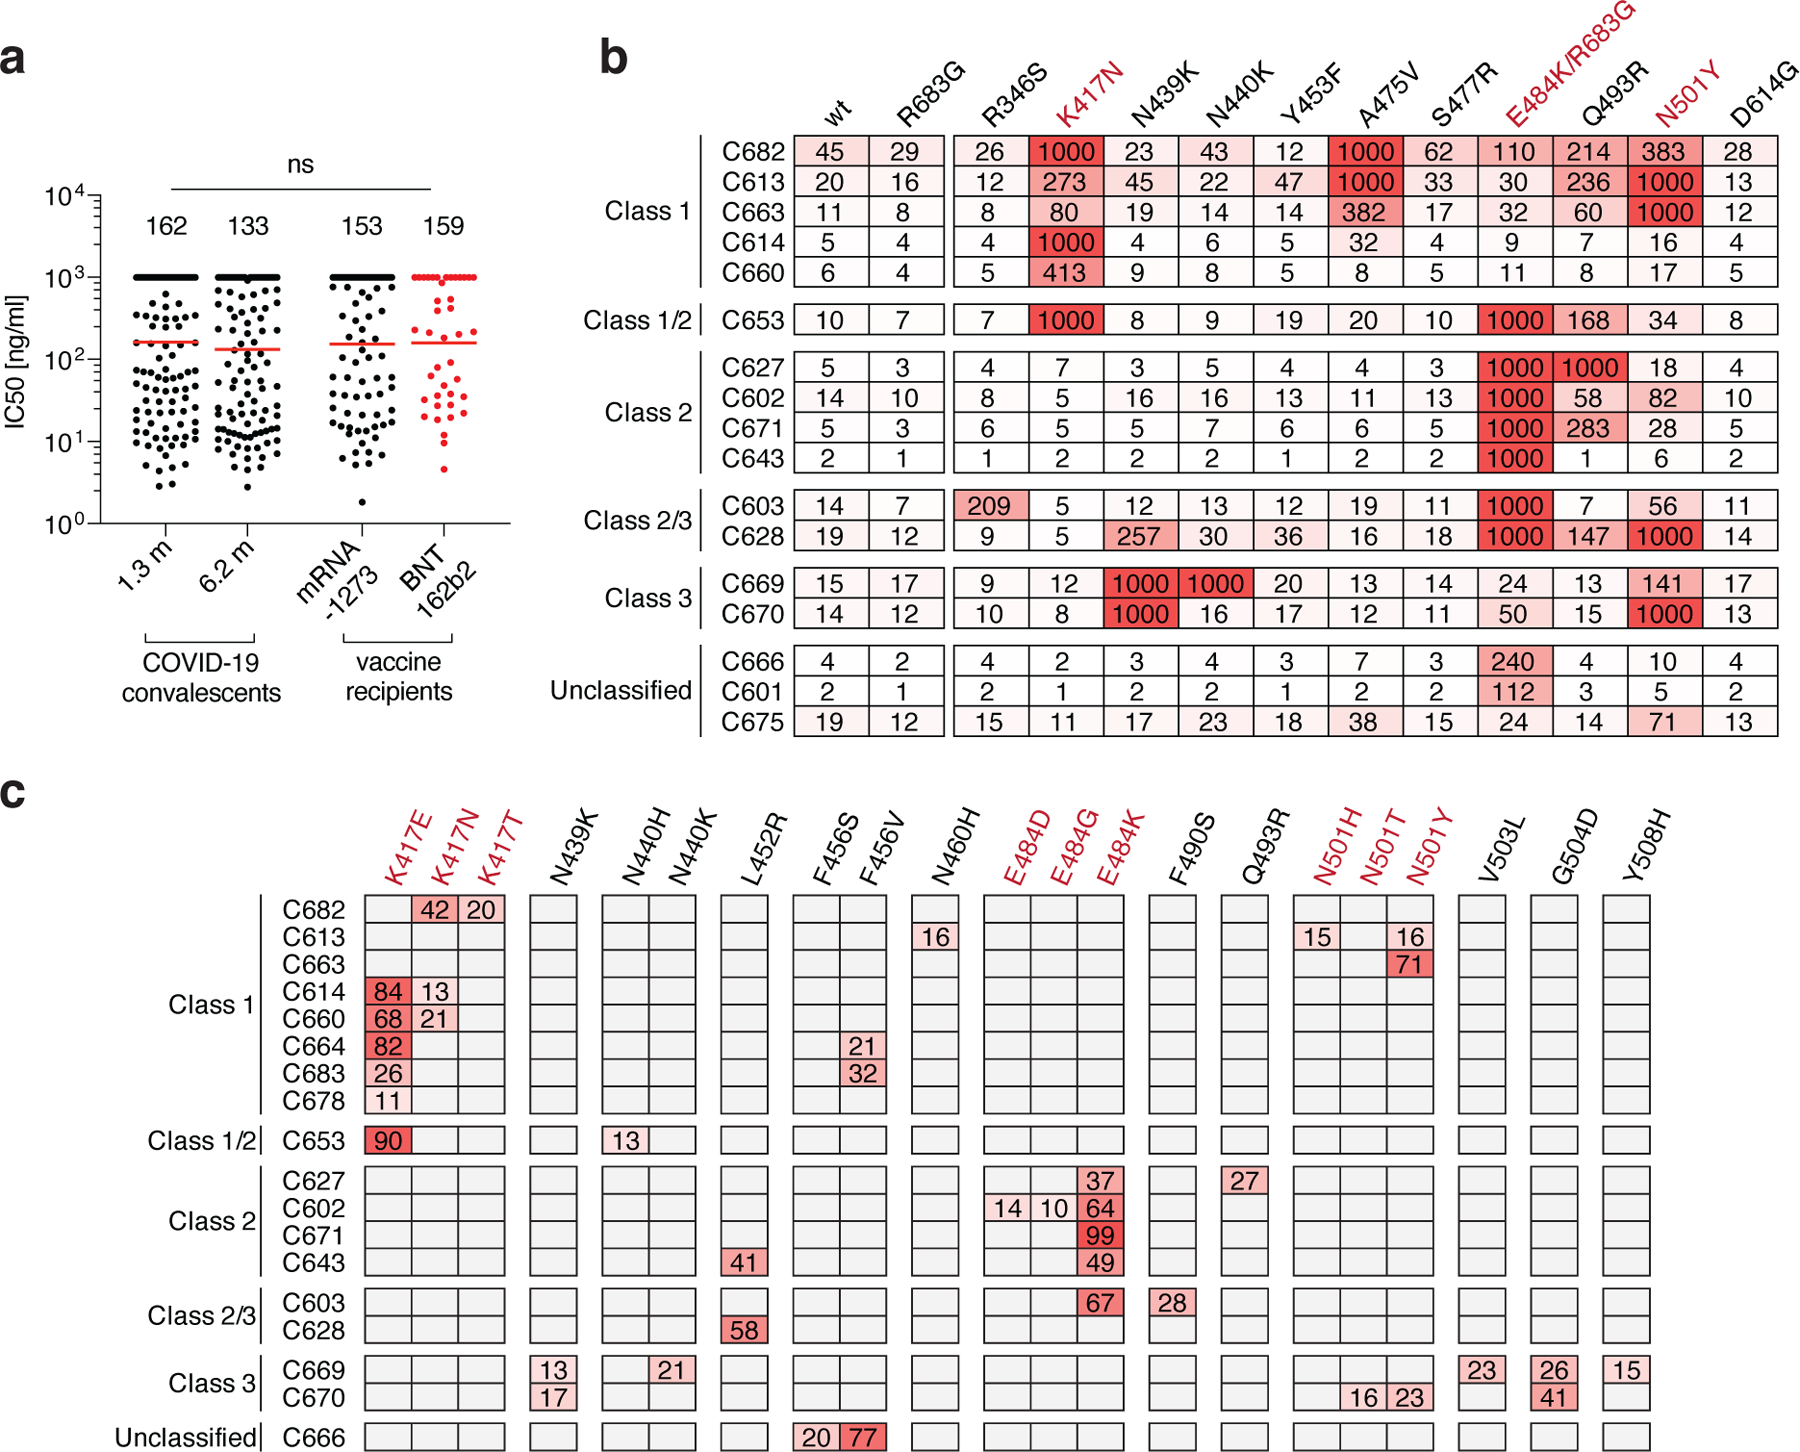
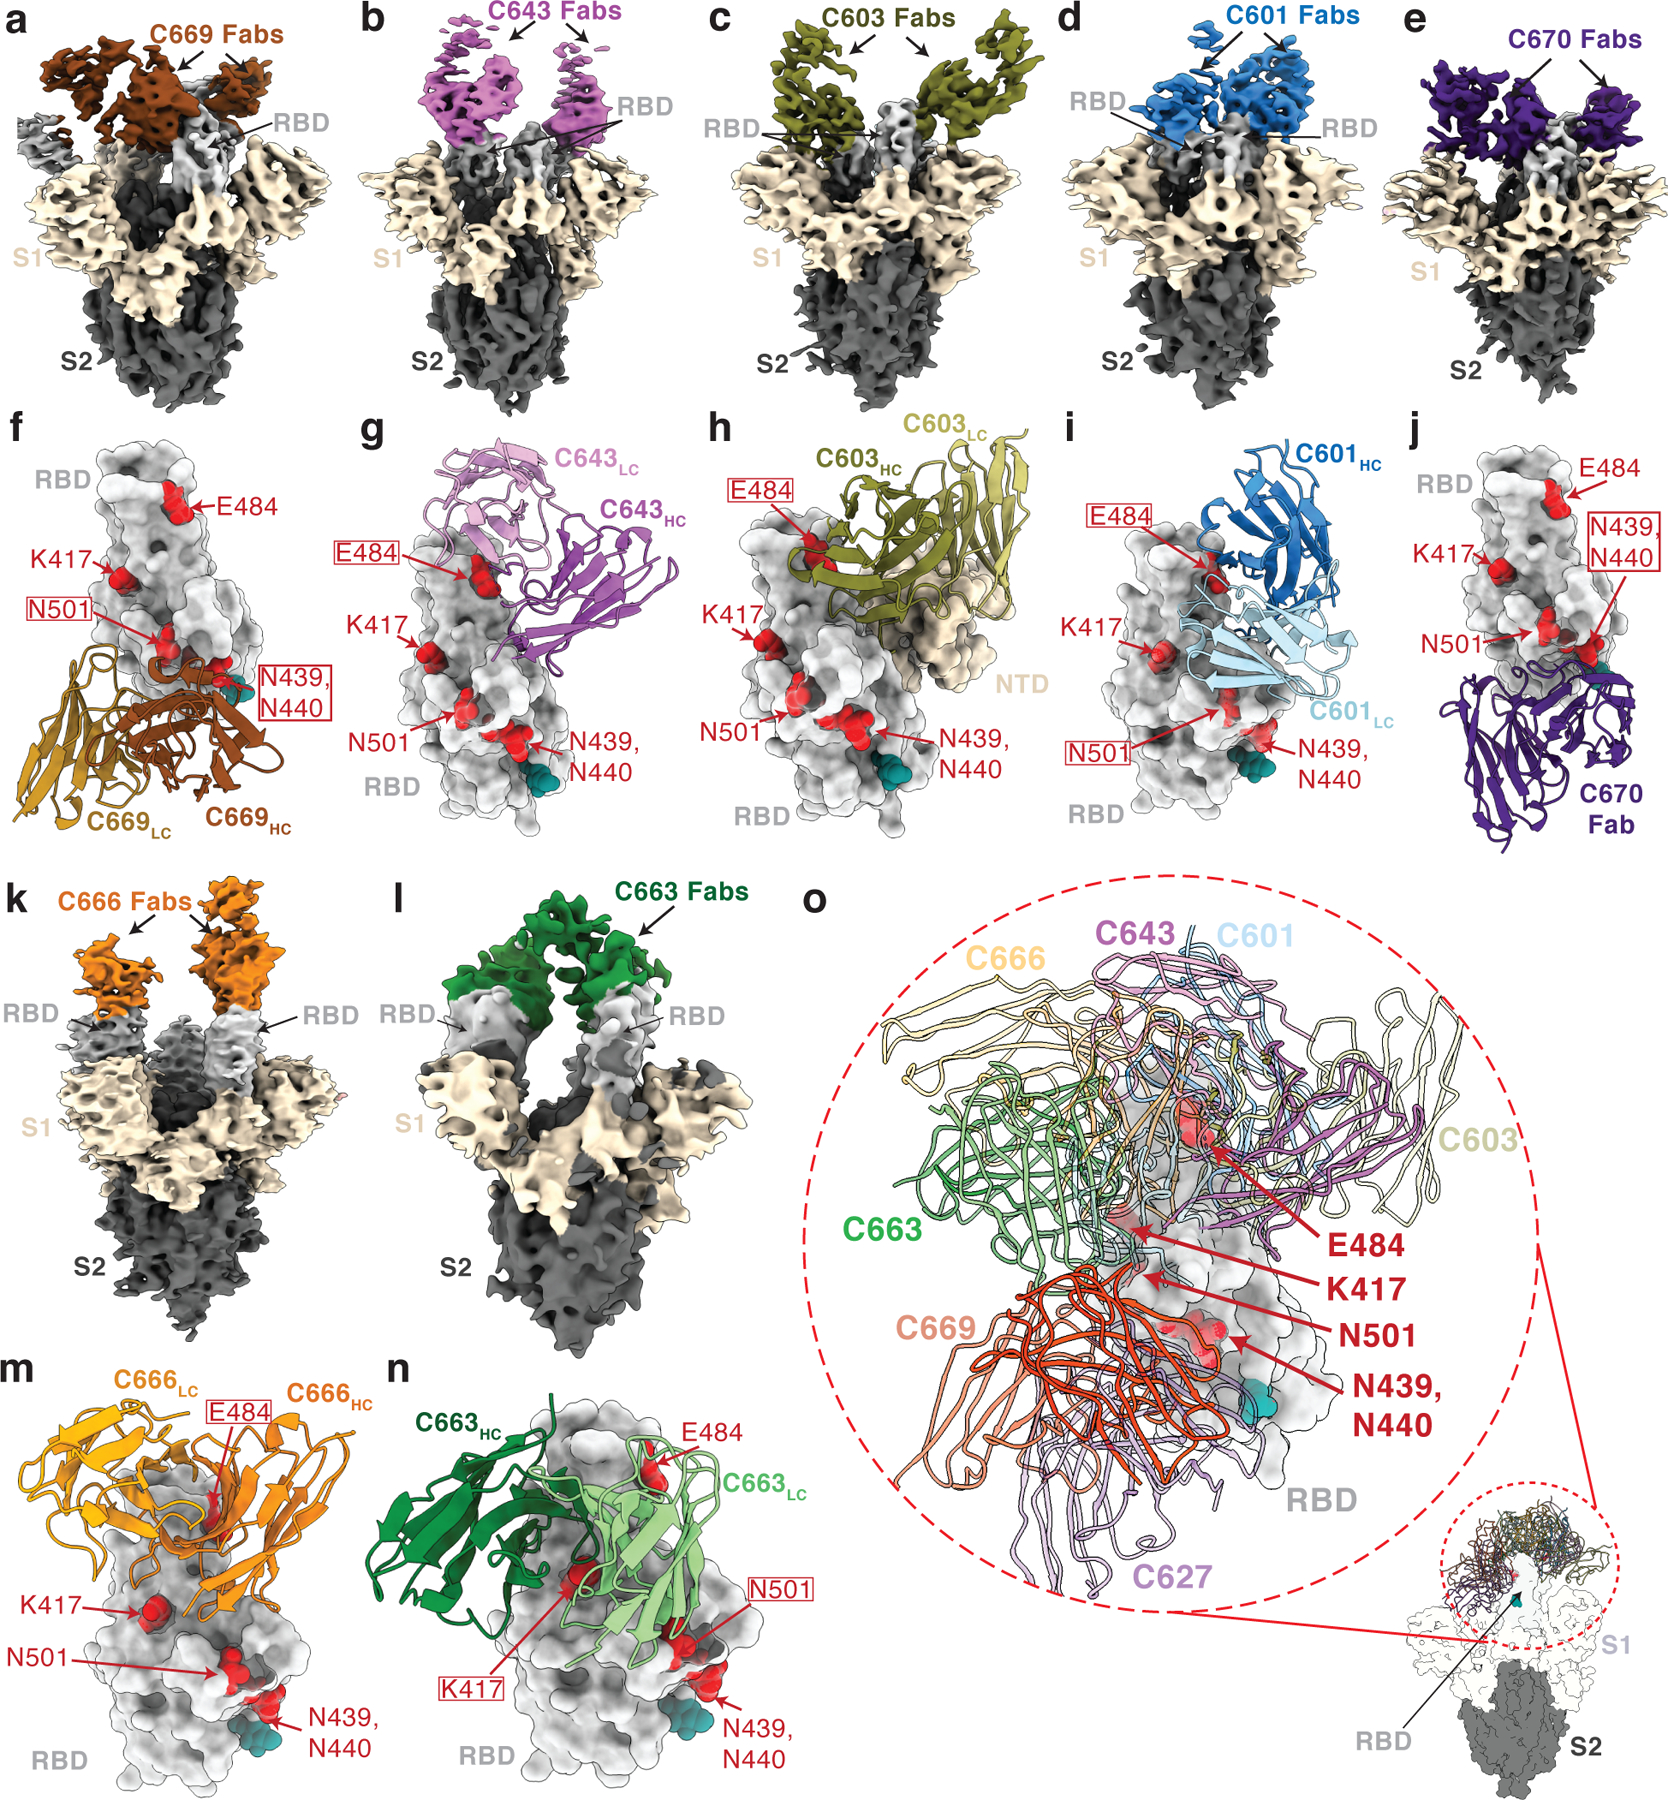
Here we report on the antibody and memory B cell responses of a cohort of 20 volunteers who received the Moderna (mRNA-1273) or Pfizer-BioNTech (BNT162b2) vaccine against SARS-CoV-21-4. Eight weeks after the second injection of vaccine, volunteers showed high levels of IgM and IgG anti-SARS-CoV-2 spike protein (S) and receptor-binding-domain (RBD) binding titre. Moreover, the plasma neutralizing activity and relative numbers of RBD-specific memory B cells of vaccinated volunteers were equivalent to those of individuals who had recovered from natural infection5,6. However, activity against SARS-CoV-2 variants that encode E484K-, N501Y- or K417N/E484K/N501-mutant S was reduced by a small-but significant-margin. The monoclonal antibodies elicited by the vaccines potently neutralize SARS-CoV-2, and target a number of different RBD epitopes in common with monoclonal antibodies isolated from infected donors5-8. However, neutralization by 14 of the 17 most-potent monoclonal antibodies that we tested was reduced or abolished by the K417N, E484K or N501Y mutation. Notably, these mutations were selected when we cultured recombinant vesicular stomatitis virus expressing SARS-CoV-2 S in the presence of the monoclonal antibodies elicited by the vaccines. Together, these results suggest that the monoclonal antibodies in clinical use should be tested against newly arising variants, and that mRNA vaccines may need to be updated periodically to avoid a potential loss of clinical efficacy.


Conflict of interest statement

Competing interests: The Rockefeller University has filed a provisional patent application in connection with this work on which Z.W. and M.C.N. are inventors (US patent 63/199, 676).

Figures

Extended Data Fig. 1.
Extended Data Fig. 1.. Plasma antibodies against SARS-CoV-2.
af, Results of ELISAs measuring plasma reactivity to S (a,c,e) and RBD protein (b,d,f) of 20 vaccinees (grey curves) and 8 controls (black curves). a, Anti-S IgG. b, Anti-RBD IgG. c, Anti-S IgM. d, Anti-RBD IgM. e, Anti-S IgA. f, Anti-RBD IgA. Left, optical density at 450 nm (OD 450 nm) for the indicated reciprocal plasma dilutions. Right, normalized area under the curve (AUC) values for the 8 controls and 20 vaccinees. Horizontal bars indicate geometric mean. Statistical significance was determined using the two-tailed Mann–Whitney U-test. Average of two or more experiments. g–i, Correlations of plasma antibodies measurements. g, Normalized AUC for IgG anti-S (X axis) plotted against normalized AUC for IgG anti-RBD (Y axis). h, Normalized AUC for IgM anti-S (X axis) plotted against normalized AUC for IgM anti-RBD (Y axis). i, Normalized AUC for IgA anti-S (X axis) plotted against normalized AUC for IgA anti-RBD (Y axis). The r and p values in g–i were determined with the two-tailed Spearman’s correlation test. Moderna vaccinees are in black and Pfizer-BioNTech in red. j-l, Results of ELISAs measuring plasma reactivity to RBD in convalescent volunteers 1.3 and 6.2 months after infection, and in 20 vaccinees, who received the Moderna vaccine (black dots) and Pfizer-BioNTech vaccine (red dots). j, Anti-RBD IgG. k, Anti-RBD IgM. l, Anti-RBD IgA. The normalized area under the curve (AUC) values are shown. Positive and negative controls were included for validation. Red horizontal bars and indicated values represent geometric mean. Statistical significance was determined using two-tailed Mann–Whitney U-test or Wilcoxon matched-pairs signed rank test.
Extended Data Fig. 2:
Extended Data Fig. 2:. Plasma neutralizing activity.
a, Anti-S IgM AUC (Y axis) plotted against NT50 (X axis) r=0.12, p<0.62. b, Anti-S IgA AUC (Y axis) plotted against NT50 (X axis) r=0.79, p<0.0001. c, Anti-RBD IgM AUC (Y axis) plotted against NT50 (X axis) r=−0.079 p=0.74. d, Anti-RBD IgA AUC (Y axis) plotted against NT50 (X axis) r=0.69 p=0.0008. e, NT50 (Y axis) plotted against time between last dose and blood draw (X axis) r=−0.63 p=0.0032. f, NT50 (Y axis) plotted against time between doses (X axis) r=0.03 p=0.89. g, Anti-RBD IgG AUC (Y axis) plotted against time between last dose and blood draw (X axis) r=−0.57 p=0.0084. h, Anti-S IgG AUC (Y axis) plotted against time between last dose and blood draw (X axis) r=−0.59 p=0.0064. i, Age (Y axis) plotted against NT50 (X axis) r=−0.06 p=0.82. The r and p values were determined by two-tailed Spearman’s. Moderna vaccinees in black and Pfizer-BioNTech in red. j, NT50 values for vaccinee plasma (n=15) neutralization of pseudotyped viruses with WT and the indicated RBD-mutant SARS-CoV-2 S proteins; p-values determined using one tailed t-test.
Extended Data Fig. 3:
Extended Data Fig. 3:. Flow cytometry.
a, Gating strategy used for cell sorting. Gating was on singlets that were CD20+ and CD3-CD8-CD14-CD16-OVA-. Sorted cells were RBD-PE+ and RBD-AF647+. b, Flow cytometry showing the percentage of RBD-double positive memory B cells from a pre-COVID-19 control (HD) and 15 vaccinees, who received the Moderna vaccine are shown in black and Pfizer-BioNTech vaccine recipients are in red. c, the percentage of RBD-binding memory B cells in vaccinees (Y axis) plotted against time between first dose and blood draw (X axis) r=0.40 p=0.087 (left panel), and between last dose and blood draw (X axis) r=0.33 p=0.17 (right panel). Moderna vaccinees in black and Pfizer-BioNTech in red. The r and p values for correlations were determined by two-tailed Spearman’s. d, Pie charts show the distribution of antibody sequences from 10 individuals in b. The number in the inner circle indicates the number of sequences analyzed. Pie slice size is proportional to the number of clonally related sequences. The black outline indicates the frequency of clonally expanded sequences. The r and p values for correlations in c were determined by the two-tailed Spearman correlation test.
Extended Data Fig. 4:
Extended Data Fig. 4:. Frequency distributions of human VL genes.
Graph shows relative abundance of human IGVK (left) and IgVL (right) genes of Sequence Read Archive accession SRP010970 (orange), and vaccinees (blue). Two-sided binomial tests with unequal variance were used to compare the frequency distributions., significant differences are denoted with stars (* p < 0.05, ** p < 0.01, *** p < 0.001, **** = p < 0.0001). b. Sequences from 14 individuals (Extended Data Table 3) with clonal relationships. Interconnecting lines indicate the relationship between antibodies that share V and J gene segment sequences at both IGH and IGL. Purple, green and grey lines connect related clones, clones and singles, and singles to each other, respectively.
Extended Data Fig. 5:
Extended Data Fig. 5:. Antibody somatic hypermutation, and CDR3 length.
a, Number of somatic nucleotide mutations in both the IGVH and IGVL in 14 participants (left). Individuals who received the Moderna vaccine are shown in black and Pfizer-BioNTech vaccine recipients in red. For each individual, the number of the amino acid length of the CDR3s at the IGVH and IGVL is shown (right). The horizontal bars indicate the mean. The number of antibody sequences (IGVH and IGVL) evaluated for each participant are n=68 (MOD1), n=45 (MOD2), n=117 (MOD3), n=123 (MOD4), n=110 (MOD6), n=109 (MOD7), n=144 (MOD8), n=102 (MOD9), n=132 (PFZ10), n=109 (MOD11), n=91 (PFZ12), n=78 (C001), n=66 (C003), and n=115 (C004). b, Distribution of the hydrophobicity GRAVY scores at the IGH CDR3 compared to a public database (see Methods for statistical analysis). The box limits are at the lower and upper quartiles, the center line indicates the median, the whiskers are 1.5× interquartile range and the dots represent outliers. Statistical significance was determined using two-tailed Wilcoxon matched-pairs signed rank test (**** = p < 0.0001).
Extended Data Fig. 6:
Extended Data Fig. 6:. Monoclonal antibody ELISAs.
a, Graphs show anti-SARS-CoV-2 RBD antibody reactivity. ELISA EC50 values for all antibodies isolated from COVID-19 convalescent individuals assayed at 1.3 and 6.2 months after infection, and 127 selected monoclonal antibodies isolated from 4 Moderna vaccinees (black dots) and 4 Pfizer-BioNTech vaccinees (red dots) measured at 8 weeks after the boost. Red horizontal bars and indicated values represent geometric mean. Statistical significance was determined using two-tailed Mann–Whitney U-test. b–c, Graphs show ELISA titration curves for 86 monoclonal antibodies isolated from Moderna vaccinees (b) and 41 monoclonal antibodies isolated from Pfizer-BioNTech vaccinees (c). d–l, Graphs show ELISA titrations for 84 antibodies isolated from Moderna vaccinees against the indicated RBD variants. Isotype control and low-binding antibodies are indicated in colors. C661 is a non-binding antibody. Data are representative of two independent experiments. m, Relative change in EC50 values for the indicated RBD variants over wt RBD of 84 antibodies isolated from Moderna vaccinees. Red horizontal bars represent geometric mean. n, a heat map summary of EC50 values for binding to wild type RBD and the indicated mutant RBDs for 17 top neutralizing antibodies.
Extended Data Fig. 7:
Extended Data Fig. 7:. Neutralizing activity of monoclonal antibodies in clinical development against SARS-CoV-2 variants.
a, Results of a SARS-CoV-2 pseudovirus neutralization assay. IC50 values for 6 different monoclonal antibodies, alone or in their clinically designated combinations, for neutralization of wild type and the indicated mutant SARS-CoV-2 pseudotyped viruses. Antibodies with IC50 values above 1000 ng/ml were plotted at 1000 ng/ml. Data are the mean of 2 independent experiments. Color gradient indicates IC50 values ranging from 0 (white) to 1000 ng/ml (red). The combination of REGN 10987 and 10933 (casirivimab and imdevimab, respectively),, has been granted emergency use authorization by the U.S. FDA, the combination of COV2–2196 and COV2–2130 (licensed to Astra Zeneca as AZD7442), and the combination of C135 and C144 (The Rockefeller University) are currently in clinical trials (NCT04507256 and NCT04700163, respectively).
Extended Data Fig. 8:
Extended Data Fig. 8:. Local resolution estimates of Fab-S cryo-EM reconstructions.
a–g, Local resolution maps calculated using cryoSPARC for (a) C669-S, (b) C643-S, (c) C603-S, (d) C601-S, (e) C666-S, (f) C663-S, and (g) C670-S complexes. Close-up views for Fab-RBD interfaces are highlighted for (a) C669 and (b) C643. h, Gold-standard Fourier shell correlation curves for Fab-S complexes. The 0.5 and 0.143 cutoffs are indicated by dashed lines.
Fig. 1.
Fig. 1.. Plasma neutralizing activity.
a, SARS-CoV-2 pseudovirus neutralization assay. NT50 values for COVID-19 convalescent plasma measured at 1.3 months and 6.2 months after infection as well as plasma from vaccinees. NT50 values lower than 10 were plotted at 10. Mean of 2 independent experiments. Red bars and indicated values represent geometric mean NT50 values. Statistical significance was determined using the two-tailed Mann-Whitney U-test. Pre-COVID-19 historical control plasma was analyzed as a negative control and showed no detectable neutralization (NT50<10). b, NT50 values for Moderna mRNA-1273 (black) and Pfizer-BioNTech BNT162b2 (red) vaccine recipients. Red bars and indicated values represent geometric mean NT50 values. Statistical significance was determined using the two-tailed Mann-Whitney U-test. c, Anti-RBD IgG AUC (Y axis) plotted against NT50 (X axis) r=0.82, p<0.0001. d, Anti-S IgG AUC (Y axis) plotted against NT50 (X axis) r=0.83, p<0.0001. e, Anti-RBD IgG AUC (Y axis) plotted against time between first dose and blood draw (X axis) r=−0.59 p=0.0058. f, Anti-S IgG AUC (Y axis) plotted against time between first dose and blood draw (X axis) r=−0.62 p=0.0038. g, NT50 (Y axis) plotted against time between first dose and blood draw (X axis) r=−0.69 p=0.0008. The r and p values for correlations in c-g were determined by two-tailed Spearman correlation. Moderna vaccinees are in black and Pfizer-BioNTech in red. h. Examples of neutralization assays, comparing the sensitivity of pseudotyped viruses with WT and RBD mutant SARS-CoV-2 S proteins to vaccinee plasma. MOD1 and PFZ10 indicate two representative individuals receiving the Moderna and Pfizer-BioNTech vaccine, respectively (for details see Ext. Data Table 1). i, NT50 values for vaccinee plasma (n=15) neutralization of pseudotyped viruses with WT and the indicated RBD-mutant SARS-CoV-2 S proteins. Pfizer-BioNTech vaccinees in red. j, NT50 values for convalescent plasma (n=45) neutralization of pseudotyped viruses with WT and KEN (K417N/E484K/N501Y) SARS-CoV-2 S proteins. Statistical significance in i and j was determined using one tailed t-test. All experiments were performed a minimum of 2 times. Pseutotyped viruses containing the E484K mutation and corresponding WT controls contain the R683G mutation (for details see methods).
Fig. 2.
Fig. 2.. Memory B cell antibodies.
a, Representative flow cytometry plots showing dual AlexaFluor-647-RBD and PE-RBD binding B cells for 4 vaccinees. b, as in a, dot plot summarizes the percentage of RBD binding B cells in 19 vaccinees, in comparison to a cohort of infected individuals assayed 1.3 and 6.2 months after infection,. Individuals who received the Moderna vaccine are shown in black and Pfizer-BioNTech vaccine recipients in red. Red horizontal bars indicate mean values. Statistical significance was determined using two-tailed Mann–Whitney U-tests. c, Pie charts show the distribution of antibody sequences from the 4 individuals in a. The number in the inner circle indicates the number of sequences analyzed. Pie slice size is proportional to the number of clonally related sequences. The black outline indicates the frequency of clonally expanded sequences. d, as in c, graph shows relative clonality among 14 vaccinees assayed, individuals who received the Moderna vaccine are shown in black and Pfizer-BioNTech vaccine recipients in red. Red horizontal bars indicate mean values. Statistical significance was determined using two-tailed Mann–Whitney U-tests. e, Graph shows relative abundance of human IGVH genes Sequence Read Archive accession SRP010970 (orange), and vaccinees (blue). A two-sided binomial test was used to compare the frequency distributions, significant differences are denoted with stars (* p < 0.05, ** p < 0.01, *** p < 0.001, **** = p < 0.0001). f, Clonal relationships between sequences from 14 vaccinated individuals (Moderna in black, Pfizer-BioNTech in red Extended Data Table 3) and naturally infected individuals (in green, from,). Interconnecting lines indicate the relationship between antibodies that share V and J gene segment sequences at both IGH and IGL. Purple, green and grey lines connect related clones, clones and singles, and singles to each other, respectively. g, Number of somatic nucleotide mutations in the IGVH (top) and IGVL (bottom) in vaccinee antibodies (Extended Data Table 3) compared to natural infection obtained 1.3 or 6.2 months after infection,. Statistical significance was determined using the two-tailed Mann–Whitney U-tests and red horizontal bars indicate mean values. h, as in g, but for CDR3 length.
Fig. 3:
Fig. 3:. Anti-SARS-CoV-2 RBD monoclonal antibody neutralizing activity.
a, SARS-CoV-2 pseudovirus neutralization assay. IC50 values for antibodies cloned from COVID-19 convalescent patients measured at 1.3 and 6.2 months, after infection as well as antibodies cloned from Moderna mRNA-1273 (black) and Pfizer-BioNTech BNT162b2 (red) mRNA- vaccine recipients. Antibodies with IC50 values above 1000 ng/ml were plotted at 1000 ng/ml. Mean of 2 independent experiments. Red bars and indicated values represent geometric mean IC50 values in ng/ml. Statistical significance was determined using the two-tailed MannWhitney U-test. Isotype control antibody was analyzed in parallel and showed no detectable neutralization. b, IC50 values for 17 selected mAbs for neutralization of wild type and the indicated mutant SARS-CoV-2 pseudoviruses. Color gradient indicates IC50 values ranging from 0 (white) to 1000 ng/ml (red). c, Antibody selection pressure can drive emergence of S variants in cell culture; the percentage of sequence reads encoding the indicated RBD mutations after a single passage of rVSV/SARS-CoV-2 in the presence of the indicated antibodies is tabulated. Color gradient indicates percentage of sequence reads bearing the indicated mutation ranging from 0 (white) to 100 (red). Positions for which no sequence read was detected are shown in grey. The percentages calculated for a given position are based on all the reads, and not just the reads that include that position. K417N, E484K/R683G and N501 are highlighted in b and c as they constitute important circulating variants.
Fig. 4.
Fig. 4.. Cryo-EM reconstructions of Fab-S complexes.
Cryo-EM densities for Fab-S complexes (a–e; k–l) and close-up views of antibody footprints on RBDs (f–j; m–n) are shown for neutralizing mAbs. As expected, due to Fab inter-domain flexibility, cryo-EM densities (a–e; k–l) were weak for the Fab CH-CL domains. Models of antibody footprints on RBDs (f–j; m–n) are presented as Fab VH–VL domains (cartoon) complexed with the RBD (surface). To generate models, coordinates of stabilized S trimer (PDB 6XKL) and representative Fab fragments (PDB 6XCA or 7K8P) with CDR3 loops removed were fit by rigid body docking into the cryo-EM density maps. a,f, C669; b,g, C643; c,h, C603; d,i, C601; e,j, C670; k,m, C666; and l,n, C663. RBD residues K417, N439, N440, E484, and N501 are highlighted as red surfaces. The N343 glycan is shown as a teal sphere. o, Composite model illustrating targeted epitopes of RBD-specific neutralizing mAbs (shown as VH-VL domains in colors from panels a-l) elicited from mRNA vaccines.

Update of

  • mRNA vaccine-elicited antibodies to SARS-CoV-2 and circulating variants.
    Wang Z, Schmidt F, Weisblum Y, Muecksch F, Barnes CO, Finkin S, Schaefer-Babajew D, Cipolla M, Gaebler C, Lieberman JA, Oliveira TY, Yang Z, Abernathy ME, Huey-Tubman KE, Hurley A, Turroja M, West KA, Gordon K, Millard KG, Ramos V, Da Silva J, Xu J, Colbert RA, Patel R, Dizon J, Unson-O'Brien C, Shimeliovich I, Gazumyan A, Caskey M, Bjorkman PJ, Casellas R, Hatziioannou T, Bieniasz PD, Nussenzweig MC. Wang Z, et al. bioRxiv [Preprint]. 2021 Jan 30:2021.01.15.426911. doi: 10.1101/2021.01.15.426911. bioRxiv. 2021. Update in: Nature. 2021 Apr;592(7855):616-622. doi: 10.1038/s41586-021-03324-6. PMID: 33501451 Free PMC article. Updated. Preprint.

Comment in

References

    1. Gaebler C & Nussenzweig MC All eyes on a hurdle race for a SARS-CoV-2 vaccine. Nature 586, 501–502, 10.1038/d41586-020-02926-w (2020). - DOI - PubMed
    1. Krammer F SARS-CoV-2 vaccines in development. Nature 586, 516–527, 10.1038/s41586-020-2798-3 (2020). - DOI - PubMed
    1. Jackson LA et al. An mRNA Vaccine against SARS-CoV-2 - Preliminary Report. N Engl J Med 383, 1920–1931, 10.1056/NEJMoa2022483 (2020). - DOI - PMC - PubMed
    1. Polack FP et al. Safety and Efficacy of the BNT162b2 mRNA Covid-19 Vaccine. N Engl J Med 383, 2603–2615, 10.1056/NEJMoa2034577 (2020). - DOI - PMC - PubMed
    1. Walsh EE et al. Safety and Immunogenicity of Two RNA-Based Covid-19 Vaccine Candidates. N Engl J Med 383, 2439–2450, 10.1056/NEJMoa2027906 (2020). - DOI - PMC - PubMed

Publication types

MeSH terms