. 2021 Feb 8;13(4):677.
doi: 10.3390/cancers13040677.

Quantification and Optimization of Standard-of-Care Therapy to Delay the Emergence of Resistant Bone Metastatic Prostate Cancer

Affiliations

Quantification and Optimization of Standard-of-Care Therapy to Delay the Emergence of Resistant Bone Metastatic Prostate Cancer

Arturo Araujo et al. Cancers (Basel). .

Abstract

Background: Bone metastatic prostate cancer (BMPCa), despite the initial responsiveness to androgen deprivation therapy (ADT), inevitably becomes resistant. Recent clinical trials with upfront treatment of ADT combined with chemotherapy or novel hormonal therapies (NHTs) have extended overall patient survival. These results indicate that there is significant potential for the optimization of standard-of-care therapies to delay the emergence of progressive metastatic disease.

Methods: Here, we used data extracted from human bone metastatic biopsies pre- and post-abiraterone acetate/prednisone to generate a mathematical model of bone metastatic prostate cancer that can unravel the treatment impact on disease progression. Intra-tumor heterogeneity in regard to ADT and chemotherapy resistance was derived from biopsy data at a cellular level, permitting the model to track the dynamics of resistant phenotypes in response to treatment from biological first-principles without relying on data fitting. These cellular data were mathematically correlated with a clinical proxy for tumor burden, utilizing prostate-specific antigen (PSA) production as an example.

Results: Using this correlation, our model recapitulated the individual patient response to applied treatments in a separate and independent cohort of patients (n = 24), and was able to estimate the initial resistance to the ADT of each patient. Combined with an intervention-decision algorithm informed by patient-specific prediction of initial resistance, we propose to optimize the sequence of treatments for each patient with the goal of delaying the evolution of resistant disease and limit cancer cell growth, offering evidence for an improvement against retrospective data.

Conclusions: Our results show how minimal but widely available patient information can be used to model and track the progression of BMPCa in real time, offering a clinically relevant insight into the patient-specific evolutionary dynamics of the disease and suggesting new therapeutic options for intervention.

Trial registration: NCT # 01953640.

Funding: Funded by an NCI U01 (NCI) U01CA202958-01 and a Moffitt Team Science Award. CCL and DB were partly funded by an NCI PSON U01 (U01CA244101). AA was partly funded by a Department of Defense Prostate Cancer Research Program (W81XWH-15-1-0184) fellowship. LC was partly funded by a postdoctoral fellowship (PF-13-175-01-CSM) from the American Cancer Society.

Keywords: androgen therapy resistance; bone metastatic prostate cancer; computational model; mathematical oncology; personalized treatment.


Conflict of interest statement

The authors declare no conflict of interest.

Figures
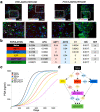
Figure 1
Figure 1
Parameterization of the mathematical model of recurrent prostate cancer. (a) Serial sections derived from bone metastatic prostate cancer patients (pre- and post-abiraterone) were stained for phospho-histone H3 (arrows, red) and cleaved caspase-3 (arrows, red) as readouts for proliferation and apoptosis, respectively, in pan-cytokeratin-positive (green) prostate cancer cells. Scale bars represent 100 μm. (b) Experimental and published parameters for prostate cancer growth rate per day pre- and post-treatment. Shown in the table are unitless rates of proliferation (PRO.), apoptosis (APO.), and the response (if any) to 1st-generation androgen deprivation therapy (ADT1) treatment (salmon), ADT2 treatment (light blue), chemotherapy (CT, light yellow), and palliative treatments (BISHP, light grey). Naïve population represents prostate cancer cells that are sensitive to all treatments, while subclonal populations have acquired resistance to one or more treatments. (c) These data were integrated into a mathematical model as daily logistic growth rates. Independent growth curves (i.e., each clone’s growth is individually simulated for comparison) are shown in ng/mL of prostate-specific antigen (PSA) (1 metastatic prostate cancer cell produces 9.8 × 10⁻⁹ ng/mL of PSA over a 24 h period). (d) Evolution of resistance (rectangles) to applied treatments (diamonds) show how the different clonal subpopulations emerge. We assume that bisphosphonates (BIS), radiotherapy (RT), and surgery (SURG) do not contribute to the development of resistance.
Figure 2
Figure 2
Mathematical model of growth kinetics for naïve prostate cancer clones and the effect of applied therapies on evolution. The simulations are initialized with an initial 10 PSA (1.08 × 10⁹ cells) made up entirely of naïve cells. (a) Cancer grows in the absence of treatment until reaching the maximum carrying capacity (1000 PSA ~ 1.08 × 10¹¹ cells). (be) The effects of individual treatments (a continuous application from day 500 for demonstration purposes) on the clonal composition of the tumor over time. Resistant clones evolve from the initial naïve population and now compete for space within the carrying capacity of the tumor. Shading represents treatment. (fi) The sequence of treatment application has profound effects on the evolution of the resistant subclones. Treatment is given in 1000 day intervals just for demonstration purposes.
Figure 3
Figure 3
Tracking individual patient response to treatment. (a,b) Patient 1’s treatment information consisting of the time intervals for the application of 1st-generation androgen deprivation therapy (ADT1), radiotherapy (RT), chemotherapy (CT), and surgery (SURG) was obtained (a) and applied to a simulation seeded with 100% naïve prostate cancer cells (b). Red dots indicate the patient’s PSA values over time. Dotted lines indicate the total tumor burden simulated by the mathematical model. (c) Analysis of cancer cell evolution in silico over time. (d,e) Altering the initial assumption of resistance naivety, a simulation that starts with 100% AR1-resistant cells fails to recapture the data (note the increase of an order of magnitude in the theoretical level of PSA, compared to data). This analysis suggests that the patient presented with an initial population of 100% naïve and 0% AR1 resistance. Resistance likely emerged after treatment was applied.
Figure 4
Figure 4
Assessing dominant cancer cell population at the time of presentation using the mathematical model. (a,b) Patient 2’s treatment information was obtained (a) and applied to a simulation seeded with 100% naïve prostate cancer cells (b). Red dots indicate the patient’s PSA values over time. Dotted line indicates the total tumor burden simulated by the mathematical model. (c) Analysis of cancer cell evolution over time in response to applied therapy. (d) Reinitialization of Patient 3’s simulation with 100% ADT1R. (e) Analysis of cancer cell evolution in silico over time subsequent to initialization with 100% ADT1R population. These data suggest that the patient presented with an initial population of 100% AR1 resistance.
Figure 5
Figure 5
Determining tumor heterogeneity at the time of presentation. (a) Patient 3’s treatment information was obtained (inset) and applied to the mathematical model seeded with varying ratios of naïve:ADT1R prostate cancer cells. Naïve: ADT1R (80:10, green) was identified as the most accurate representation. (b) The mathematical model was initialized with an 80:10 (Naïve: ADT1R) population and the tumor burden was compared to recorded PSA values over time (red dots). (c) Analysis of cancer cell evolution over time in response to applied therapy. (d,e) Personalized treatment regimen developed for Patient 3 (d) and the impact on cancer cell evolution over time. (e) Periods of treatment are represented by shaded bars.

References

    1. Azzouni F., Mohler J. Biology of castration-recurrent prostate cancer. Urol. Clin. N. Am. 2012;39:435–452. doi: 10.1016/j.ucl.2012.07.002. - DOI - PubMed
    1. Watson P.A., Arora V.K., Sawyers C.L. Emerging mechanisms of resistance to androgen receptor inhibitors in prostate cancer. Nat. Rev. Cancer. 2015;15:701–711. doi: 10.1038/nrc4016. - DOI - PMC - PubMed
    1. Frieling J.S., Basanta D., Lynch C.C. Current and emerging therapies for bone metastatic castration-resistant prostate cancer. Cancer Control. 2015;22:109–120. doi: 10.1177/107327481502200114. - DOI - PMC - PubMed
    1. Morrissey C., Roudier M.P., Dowell A., True L.D., Ketchanji M., Welty C., Corey E., Lange P.H., Higano C.S., Vessella R.L. Effects of androgen deprivation therapy and bisphosphonate treatment on bone in patients with metastatic castration-resistant prostate cancer: Results from the University of Washington Rapid Autopsy Series. J. Bone Miner. Res. 2013;28:333–340. doi: 10.1002/jbmr.1749. - DOI - PMC - PubMed
    1. Wallace T.J., Torre T., Grob M., Yu J., Avital I., Brücher B.L.D.M., Stojadinovic A., Man Y.G. Current approaches, challenges and future directions for monitoring treatment response in prostate cancer. J. Cancer. 2014;5:3–24. doi: 10.7150/jca.7709. - DOI - PMC - PubMed

LinkOut - more resources