. 2021 Feb 8;11(2):121.
doi: 10.3390/membranes11020121.

Hydrodynamic and Performance Evaluation of a Porous Ceramic Membrane Module Used on the Water-Oil Separation Process: An Investigation by CFD

Affiliations

Hydrodynamic and Performance Evaluation of a Porous Ceramic Membrane Module Used on the Water-Oil Separation Process: An Investigation by CFD

Guilherme L Oliveira Neto et al. Membranes (Basel). .

Abstract

Wastewater from the oil industry can be considered a dangerous contaminant for the environment and needs to be treated before disposal or re-use. Currently, membrane separation is one of the most used technologies for the treatment of produced water. Therefore, the present work aims to study the process of separating oily water in a module equipped with a ceramic membrane, based on the Eulerian-Eulerian approach and the Shear-Stress Transport (SST k-ω) turbulence model, using the Ansys Fluent® 15.0. The hydrodynamic behavior of the water/oil mixture in the filtration module was evaluated under different conditions of the mass flow rate of the fluid mixture and oil concentration at the entrance, the diameter of the oil particles, and membrane permeability and porosity. It was found that an increase in the feed mass flow rate from 0.5 to 1.5 kg/s significantly influenced transmembrane pressure, that varied from 33.00 to 221.32 kPa. Besides, it was observed that the particle diameter and porosity of the membranes did not influence the performance of the filtration module; it was also verified that increasing the permeability of the membranes, from 3 × 10-15 to 3 × 10-13 m2, caused transmembrane pressure reduction of 22.77%. The greater the average oil concentration at the permeate (from 0.021 to 0.037 kg/m3) and concentrate (from 1.00 to 1.154 kg/m3) outlets, the higher the average flow rate of oil at the permeate outlets. These results showed that the filter separator has good potential for water/oil separation.

Keywords: Ansys Fluent; CFD; membranes; produced water; separation.


Conflict of interest statement

The authors declare no conflict of interest.

Figures
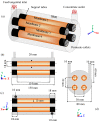
Figure 1
Figure 1
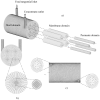
Scheme of the geometry of the separation module and its dimensions (a) Permeation module, (b,c) Longitudinal views of the permeation module, (d) Frontal view of the permeation module.
Figure 2
Figure 2
The numerical mesh of the module under study, (a) Detail of the membranes, (b) Details at the exit of the membrane, and (c) Details of the inlet and outlet of the permeation module.
Figure 3
Figure 3
Average oil concentration in the permeate outlets for the three meshes used in the research (Cases 1, 2, and 3).
Figure 4
Figure 4
Transverse planes, in the hull region, chosen for data analysis.
Figure 5
Figure 5
Relative oil volumetric fraction distribution at different plans along the hull of the filtration module during the water/oil separation process.
Figure 6
Figure 6
Relative oil volumetric fraction distribution at different regions of membrane 1 during the water/oil separation process.
Figure 7
Figure 7
Pressure distribution in the hull region.
Figure 8
Figure 8
Pressure on the membrane at different, horizontal and vertical positions, of the filtration module.
Figure 9
Figure 9
Velocity distribution of the fluid mixture inside the hull ot the filtration module during the water/oil separation process.
Figure 10
Figure 10
Process parameters in the filtration module as a function of the mass flow rate of fluid in the feed. (a) Transmembrane pressure, (b) average oil volumetric concentration at the permeate outlets, (c) average oil volumetric concentration at the concentrate outlet, (d) average oil flow rate at the permeate outlets, (e) average fluid velocity in the permeate outlets and (f) average volume of oil present in the hull, membranes and permeate (Cases 2, 4 and 5).
Figure 11
Figure 11
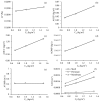
Process parameter in the filtration module as a function of the oil volumetric concentration in the feed. (a) Transmembrane pressure, (b) average oil volumetric concentration at the permeate outlets, (c) average oil volumetric concentration at the concentrate outlet, (d) average oil flow rate at the permeate outlets, (e) average fluid velocity in the permeate outlets and (f) average volume of oil present in the hull, membranes and permeate (Cases 5, 6 and 7).
Figure 12
Figure 12
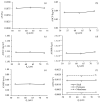
Process parameters in the filtration module as a function of the diameter of the oil drop. (a) Transmembrane pressure, (b) average oil volumetric concentration at the permeate outlets, (c) average oil volumetric concentration at the concentrate outlet, (d) average oil mass flow rate at the permeate outlets, (e) average fluid velocity in the permeate outlets and (f) average volume of oil present in the hull, membranes and permeate (Cases 5, 8 and 9).
Figure 13
Figure 13
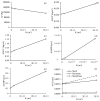
Process parameter in the filtration module as a function of membrane permeability. (a) Transmembrane pressure, (b) average oil volumetric concentration at the permeate outlets, (c) average oil volumetric concentration at the concentrate outlet, (d) average oil mass flow rate at the permeate outlets, (e) average velocity of the fluid mixture at the permeate outlets and (f) average volume of oil present in the hull, membranes and permeate (Cases 5, 10 and 11).
Figure 14
Figure 14
Process parameter in the filtration module as a function of the porosity of the membrane. (a) Transmembrane pressure, (b) average oil volumetric concentration at the permeate outlets, (c) average oil volumetric concentration at the concentrate outlet, (d) average oil mass flow rate at the permeate outlets, (e) average velocity of the fluid mixture at the permeate outlets and (f) average volume of oil present in the hull, membranes and permeate (Cases 5, 12 and 13).

References

    1. Fakhru’l-Razi A., Pendashteh A., Abdullah L.C., Biak D.R.A., Madaeni S.S., Abidin Z.Z. Review of technologies for oil and gas produced water treatment. J. Hazard. Mater. 2009;170:530–551. doi: 10.1016/j.jhazmat.2009.05.044. - DOI - PubMed
    1. Igunnu E.T., Chen G.Z. Produced water treatment technologies. Int. J. Low Carbon Technol. 2012;9:157–177. doi: 10.1093/ijlct/cts049. - DOI
    1. Huang K.Z., Xie Y.F., Tang H.L. Formation of disinfection by-products under influence of shale gas produced water. Sci. Total Environ. 2019;647:744–751. doi: 10.1016/j.scitotenv.2018.08.055. - DOI - PubMed
    1. Jiménez S., Micó M.M., Arnaldos M., Medina F., Contreras S. State of the art of produced water treatment. Chemosphere. 2018;192:186–208. doi: 10.1016/j.chemosphere.2017.10.139. - DOI - PubMed
    1. CONAMA N° 430/Art.4, RE. CONAMA Resolution No. 430 of May 13, 2011. Provides for the Conditions and Standards for the Discharge of Effluents, Complements and Amends Resolution No. 357, of March 17, 2005, of the National Council for the Environment-CONAMA. Ministry of the Environment; Brasilia, Brazil: 2011. (In Portuguese)

LinkOut - more resources