

Effects of COVID-19 on Urban Population Flow in China
- PMID: 33567714
- PMCID: PMC7915514
- DOI: 10.3390/ijerph18041617
Effects of COVID-19 on Urban Population Flow in China
Abstract
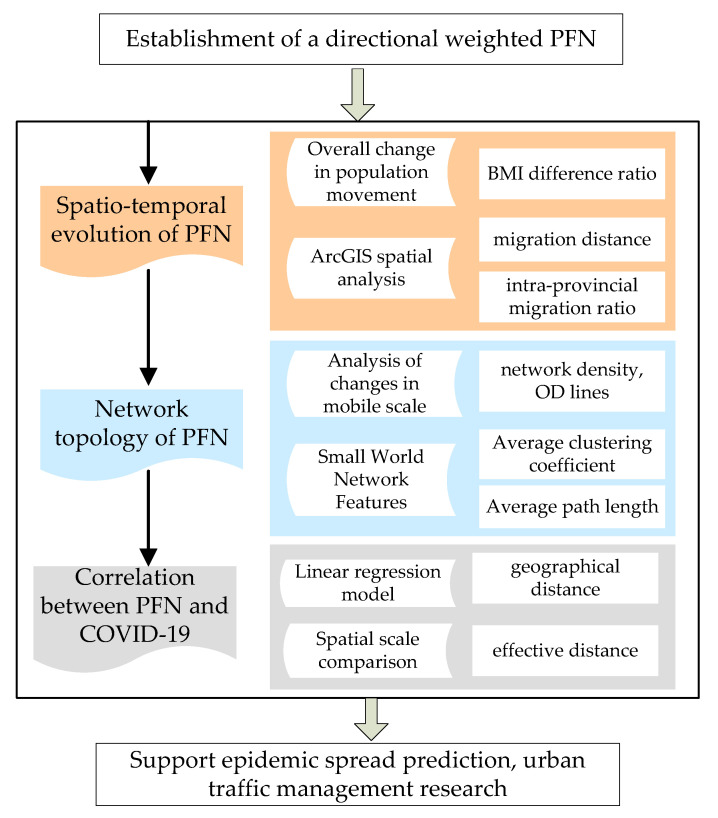
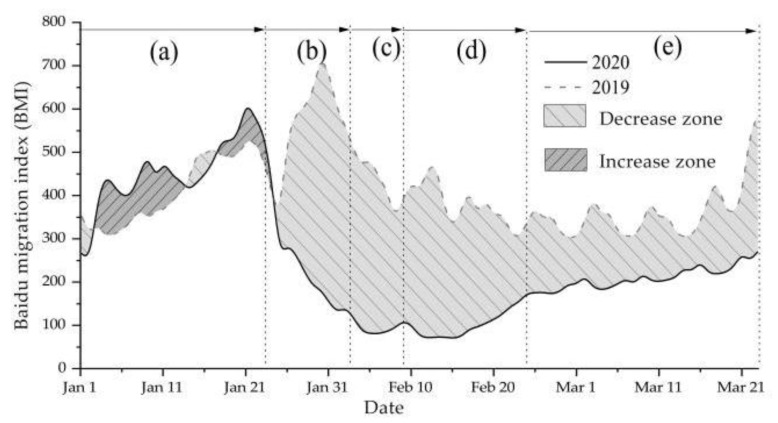
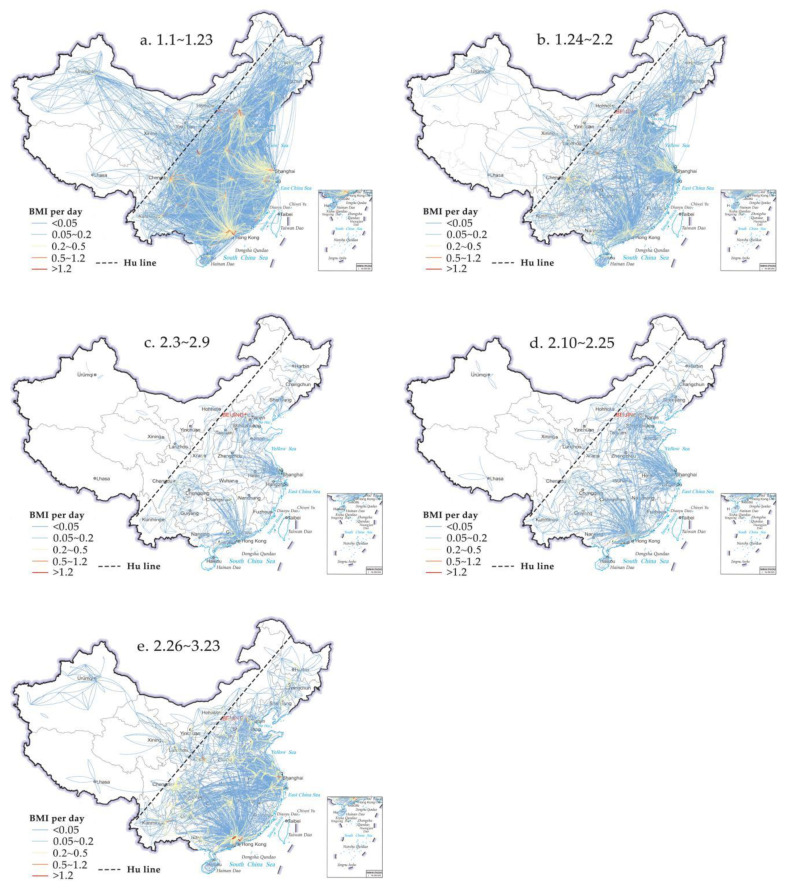
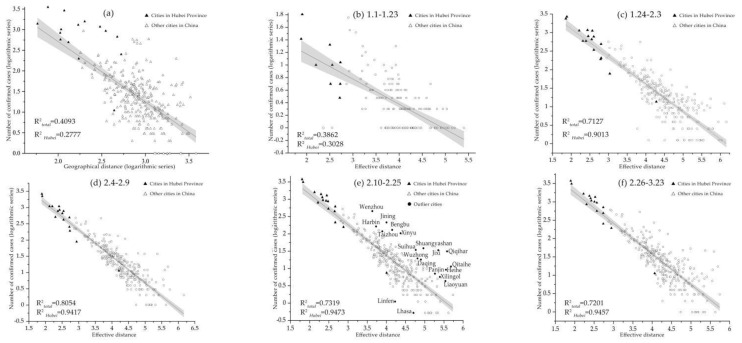
The COVID-19 epidemic has become a Public Health Emergency of International Concern. Thus, this sudden health incident has brought great risk and pressure to the city with dense population flow. A deep understanding of the migration characteristics and laws of the urban population in China will play a very positive role in the prevention and control of the epidemic situation. Based on Baidu location-based service (LBS) big data, using complex networks method and geographic visualization tools, this paper explores the spatial structure evolution of population flow network (PFN) in 368 cities of China under different traffic control situations. Effective distance models and linear regression models were established to analyze how the population flow across cities affects the spread of the epidemic. Our findings show that: (1) the scope of population flow is closely related to the administrative level of the city and the traffic control policies in various cities which adjust with the epidemic situation; The PFN mainly presents the hierarchical structure dominated by the urban hierarchy and the regional isolation structure adjacent to the geographical location.(2) through the analysis network topology structure of PFN, it is found that only the first stage has a large clustering coefficient and a relatively short average path length, which conforms to the characteristics of small world network. The epidemic situation has a great impact on the network topology in other stages, and the network structure tends to be centralized. (3) The overall migration scale of the whole country decreased by 36.85% compared with the same period of last year's lunar calendar, and a further reduction of 78.52% in the nationwide traffic control stage after the festival. (4) Finally, based on the comparison of the effective distance and the spatial distance from the Wuhan to other destination cities, it is demonstrated that there is a higher correlation between the effective distance and the epidemic spread both in Hubei province and the whole country.
Keywords: COVID-19; China; complex networks analysis; effective distance model; urban population flow.
Conflict of interest statement
The authors declare no conflict of interest.
Figures
Similar articles
-
An analysis of the domestic resumption of social production and life under the COVID-19 epidemic.PLoS One. 2020 Jul 22;15(7):e0236387. doi: 10.1371/journal.pone.0236387. eCollection 2020. PLoS One. 2020. PMID: 32697812 Free PMC article.
-
Associations between changes in population mobility in response to the COVID-19 pandemic and socioeconomic factors at the city level in China and country level worldwide: a retrospective, observational study.Lancet Digit Health. 2021 Jun;3(6):e349-e359. doi: 10.1016/S2589-7500(21)00059-5. Lancet Digit Health. 2021. PMID: 34045001 Free PMC article.
-
What Are the Reasons for the Different COVID-19 Situations in Different Cities of China? A Study from the Perspective of Population Migration.Int J Environ Res Public Health. 2021 Mar 21;18(6):3255. doi: 10.3390/ijerph18063255. Int J Environ Res Public Health. 2021. PMID: 33801124 Free PMC article.
-
Assessing the Impacts of COVID-19 on the Industrial Sectors and Economy of China.Risk Anal. 2022 Jan;42(1):21-39. doi: 10.1111/risa.13805. Epub 2021 Aug 26. Risk Anal. 2022. PMID: 34448216 Free PMC article. Review.
-
A Review of Influencing Factors on Spatial Spread of COVID-19 Based on Geographical Perspective.Int J Environ Res Public Health. 2021 Nov 20;18(22):12182. doi: 10.3390/ijerph182212182. Int J Environ Res Public Health. 2021. PMID: 34831938 Free PMC article.
Cited by
-
Effective analysis of job satisfaction among medical staff in Chinese public hospitals: a random forest model.Front Public Health. 2024 Apr 18;12:1357709. doi: 10.3389/fpubh.2024.1357709. eCollection 2024. Front Public Health. 2024. PMID: 38699429 Free PMC article.
-
Temporal-Spatial Evolution and Trend Prediction of the Supply Efficiency of Primary Medical Health Service-An Empirical Study Based on Central and Western Regions of China.Int J Environ Res Public Health. 2023 Jan 17;20(3):1664. doi: 10.3390/ijerph20031664. Int J Environ Res Public Health. 2023. PMID: 36767031 Free PMC article.
-
Long-Term Impact of COVID-19 on Hospital Visits of Rural Residents in Guangdong, China: A Controlled Interrupted Time Series Study.Int J Environ Res Public Health. 2022 Oct 14;19(20):13259. doi: 10.3390/ijerph192013259. Int J Environ Res Public Health. 2022. PMID: 36293836 Free PMC article.
-
Family Care, Economic Stress, and Depressive Symptoms Among Chinese Adults During the COVID-19 Outbreak: Difference by Urban and Rural Areas.Front Psychiatry. 2021 Jul 21;12:700493. doi: 10.3389/fpsyt.2021.700493. eCollection 2021. Front Psychiatry. 2021. PMID: 34366929 Free PMC article.
-
Economic Role of Population Density during Pandemics-A Comparative Analysis of Saudi Arabia and China.Int J Environ Res Public Health. 2021 Apr 19;18(8):4318. doi: 10.3390/ijerph18084318. Int J Environ Res Public Health. 2021. PMID: 33921729 Free PMC article.
References
-
- Manawadu L., Gunathilaka K.L., Wijeratne V.P. Urban Agglomeration and COVID-19 Clusters: Strategies for Pandemic Free City Management. Int. J. Ent. Res. Publ. 2020;10:769–775. doi: 10.29322/IJSRP.10.07.2020.p10385. - DOI
-
- Wei Y., Song W., Xiu C.L., Zhao Z.Y. The rich-club phenomenon of China’s population flow network during the country’s spring festival. Appl. Geogr. 2018;96:77–85. doi: 10.1016/j.apgeog.2018.05.009. - DOI
-
- Zhu Y., Lin L.Y. Continuity and change in the transition from the first to the second generation of migrants in China: Insights from a survey in Fujian. Habitat Int. 2014;42:147–154. doi: 10.1016/j.habitatint.2013.12.002. - DOI
Publication types
MeSH terms
Grants and funding
- 20YJCZH057/Humanities and Social Sciences Youth Foundation, Ministry of Education of the People's Republic of China
- 41701142/National Natural Science Foundation of China
- 42077143/National Natural Science Foundation of China
- 2020jbkyjc002/Fundamental Research Funds for the Central Universities
- T2020016/Foundation of Outstanding Young and Middle-aged Science and Technology Innovation Team Project of the Hubei Provincial Department of Education
LinkOut - more resources
Full Text Sources
Other Literature Sources
Medical
