

Ruminal resistome of dairy cattle is individualized and the resistotypes are associated with milking traits
- PMID: 33568223
- PMCID: PMC7877042
- DOI: 10.1186/s42523-021-00081-9
Ruminal resistome of dairy cattle is individualized and the resistotypes are associated with milking traits
Abstract
Background: Antimicrobial resistance is one of the most urgent threat to global public health, as it can lead to high morbidity, mortality, and medical costs for humans and livestock animals. In ruminants, the rumen microbiome carries a large number of antimicrobial resistance genes (ARGs), which could disseminate to the environment through saliva, or through the flow of rumen microbial biomass to the hindgut and released through feces. The occurrence and distribution of ARGs in rumen microbes has been reported, revealing the effects of external stimuli (e.g., antimicrobial administrations and diet ingredients) on the antimicrobial resistance in the rumen. However, the host effect on the ruminal resistome and their interactions remain largely unknown. Here, we investigated the ruminal resistome and its relationship with host feed intake and milk protein yield using metagenomic sequencing.
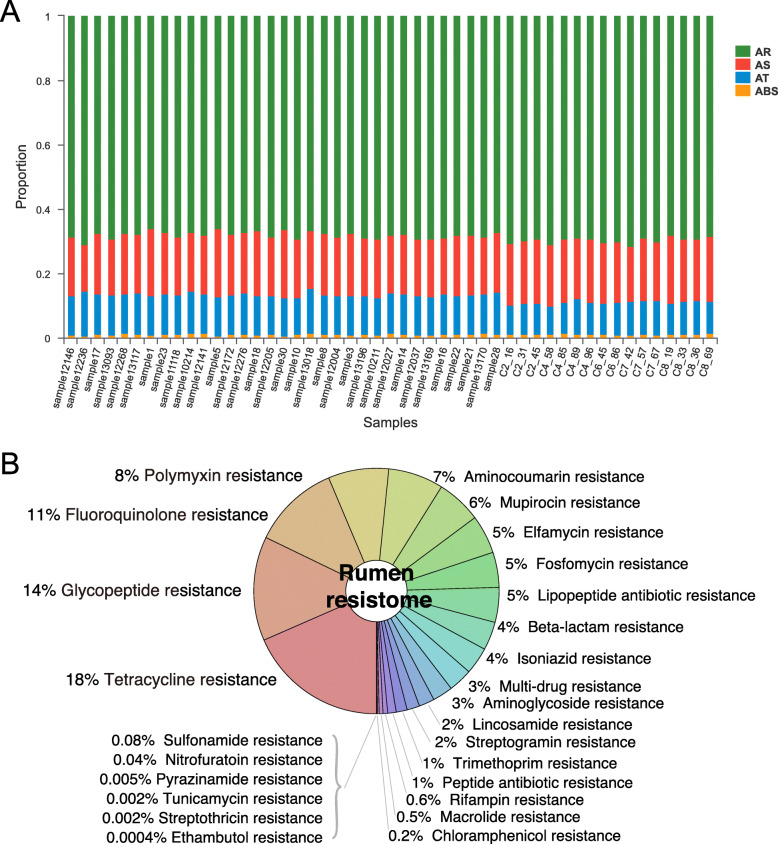
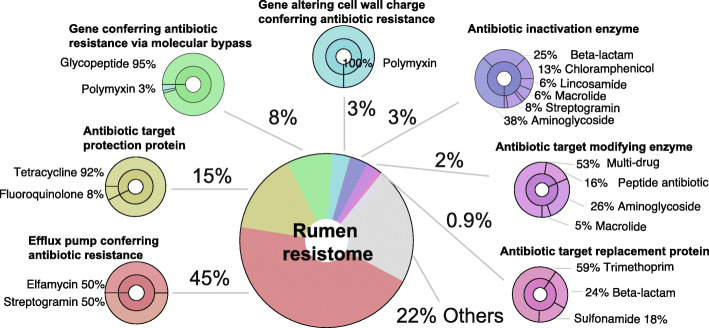
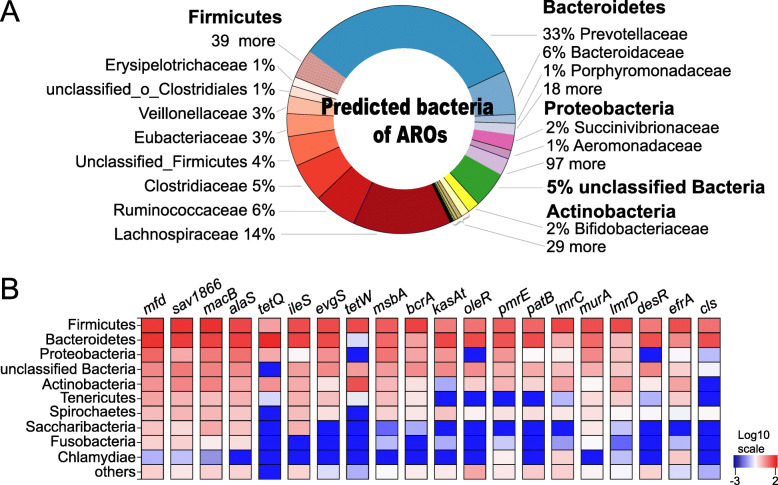
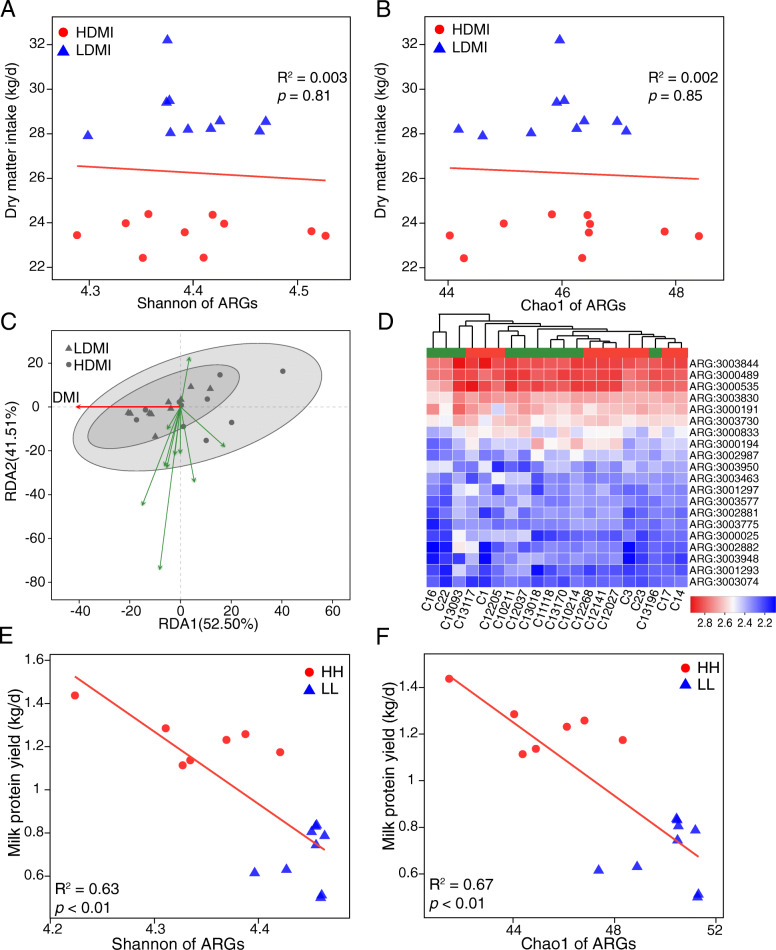
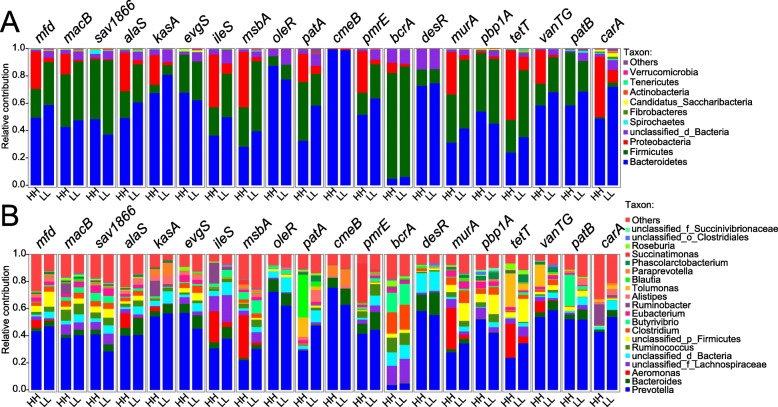
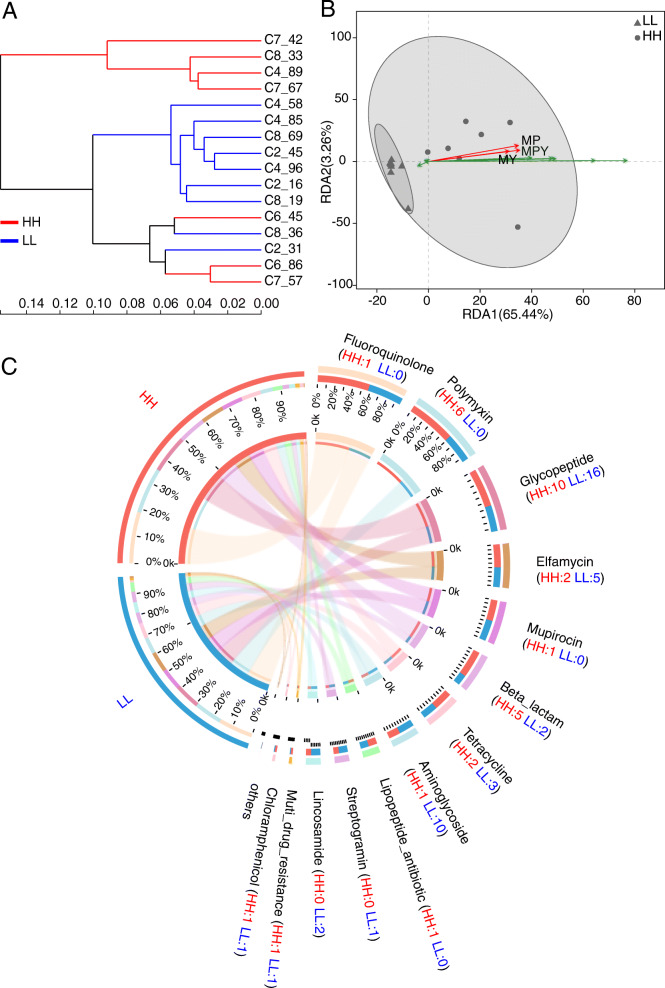
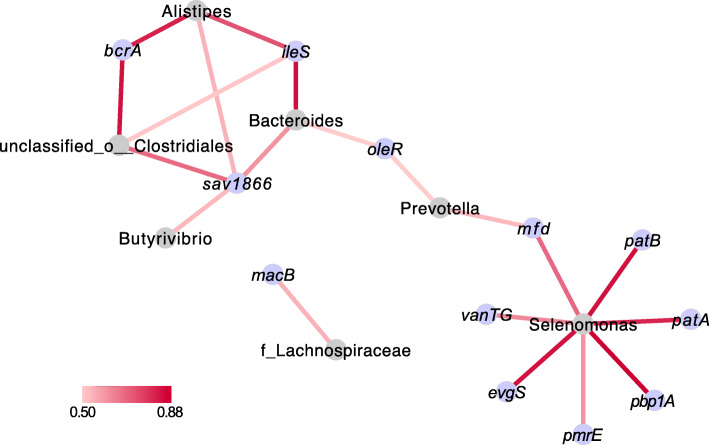
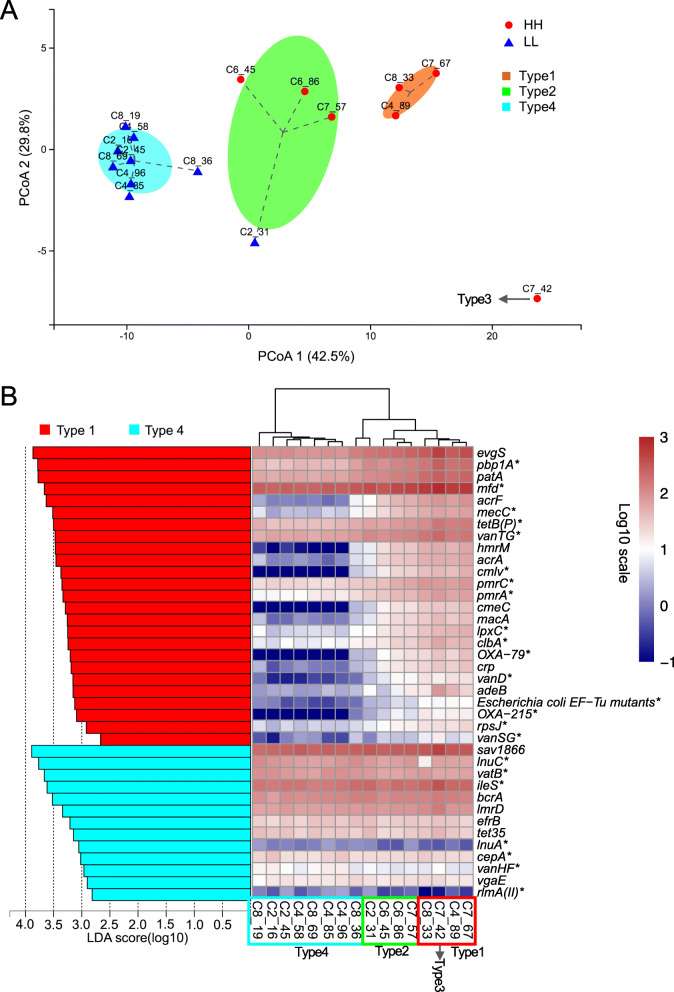
Results: The ruminal resistome conferred resistance to 26 classes of antimicrobials, with genes encoding resistance to tetracycline being the most predominant. The ARG-containing contigs were assigned to bacterial taxonomy, and the majority of highly abundant bacterial genera were resistant to at least one antimicrobial, while the abundances of ARG-containing bacterial genera showed distinct variations. Although the ruminal resistome is not co-varied with host feed intake, it could be potentially linked to milk protein yield in dairy cows. Results showed that host feed intake did not affect the alpha or beta diversity of the ruminal resistome or the abundances of ARGs, while the Shannon index (R2 = 0.63, P < 0.01) and richness (R2 = 0.67, P < 0.01) of the ruminal resistome were highly correlated with milk protein yield. A total of 128 significantly different ARGs (FDR < 0.05) were identified in the high- and low-milk protein yield dairy cows. We found four ruminal resistotypes that are driven by specific ARGs and associated with milk protein yield. Particularly, cows with low milk protein yield are classified into the same ruminal resistotype and featured by high-abundance ARGs, including mfd and sav1866.
Conclusions: The current study uncovered the prevalence of ARGs in the rumen of a cohort of lactating dairy cows. The ruminal resistome is not co-varied with host feed intake, while it could be potentially linked to milk protein yield in dairy cows. Our results provide fundamental knowledge on the prevalence, mechanisms and impact factors of antimicrobial resistance in dairy cattle and are important for both the dairy industry and other food animal antimicrobial resistance control strategies.
Keywords: Dairy cattle; Metagenomics; Microbiome; Resistome; Rumen.
Conflict of interest statement
The authors declare that they have no conflicts of interest.
Figures
Similar articles
-
Metagenomics analysis revealed the distinctive ruminal microbiome and resistive profiles in dairy buffaloes.Anim Microbiome. 2021 Jul 1;3(1):44. doi: 10.1186/s42523-021-00103-6. Anim Microbiome. 2021. PMID: 34210366 Free PMC article.
-
Characterisation of the rumen resistome in Spanish dairy cattle.Anim Microbiome. 2021 Sep 22;3(1):63. doi: 10.1186/s42523-021-00125-0. Anim Microbiome. 2021. PMID: 34551823 Free PMC article.
-
Nutrient digestibility, ruminal fermentation, and milk yield in dairy cows fed a blend of essential oils and amylase.J Dairy Sci. 2018 Nov;101(11):9815-9826. doi: 10.3168/jds.2018-14789. Epub 2018 Aug 23. J Dairy Sci. 2018. PMID: 30146293
-
Why are dairy cows not able to cope with the subacute ruminal acidosis?Pol J Vet Sci. 2013;16(4):813-21. doi: 10.2478/pjvs-2013-0116. Pol J Vet Sci. 2013. PMID: 24597322 Review.
-
Heat Stress: Effects on Rumen Microbes and Host Physiology, and Strategies to Alleviate the Negative Impacts on Lactating Dairy Cows.Front Microbiol. 2022 Feb 28;13:804562. doi: 10.3389/fmicb.2022.804562. eCollection 2022. Front Microbiol. 2022. PMID: 35295316 Free PMC article. Review.
Cited by
-
Altered microbiota, antimicrobial resistance genes, and functional enzyme profiles in the rumen of yak calves fed with milk replacer.Microbiol Spectr. 2024 Jan 11;12(1):e0131423. doi: 10.1128/spectrum.01314-23. Epub 2023 Nov 28. Microbiol Spectr. 2024. PMID: 38014976 Free PMC article.
-
Effect of castration timing and weaning strategy on the taxonomic and functional profile of ruminal bacteria and archaea of beef calves.Anim Microbiome. 2023 Dec 1;5(1):61. doi: 10.1186/s42523-023-00284-2. Anim Microbiome. 2023. PMID: 38041127 Free PMC article.
-
Novel methods of microbiome analysis in the food industry.Int Microbiol. 2021 Nov;24(4):593-605. doi: 10.1007/s10123-021-00215-8. Epub 2021 Oct 23. Int Microbiol. 2021. PMID: 34686940 Review.
-
Citrus flavonoid extracts alter the profiling of rumen antibiotic resistance genes and virulence factors of dairy cows.Front Microbiol. 2023 Jun 9;14:1201262. doi: 10.3389/fmicb.2023.1201262. eCollection 2023. Front Microbiol. 2023. PMID: 37362928 Free PMC article.
-
Metagenomics reveals the temporal dynamics of the rumen resistome and microbiome in goat kids.Microbiome. 2024 Jan 22;12(1):14. doi: 10.1186/s40168-023-01733-5. Microbiome. 2024. PMID: 38254181 Free PMC article.
References
Grants and funding
LinkOut - more resources
Full Text Sources
Other Literature Sources