

Seasonal shift in epidemics of respiratory syncytial virus infection in Japan
- PMID: 33568242
- PMCID: PMC8060823
- DOI: 10.1017/S0950268821000340
Seasonal shift in epidemics of respiratory syncytial virus infection in Japan
Abstract
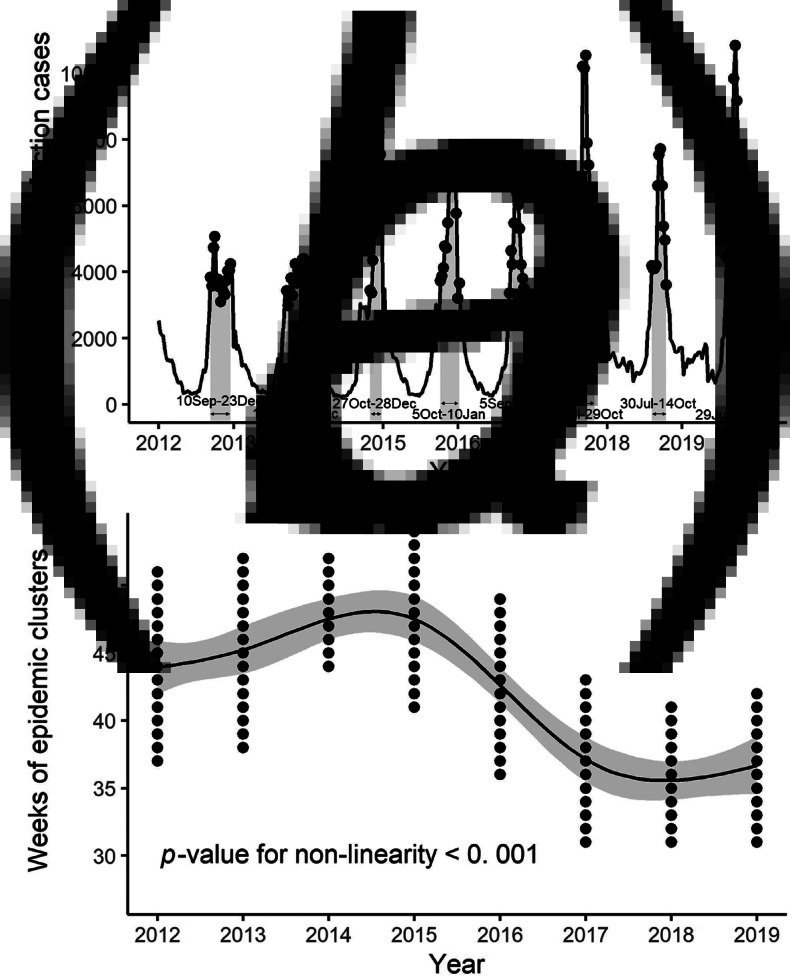
In Japan, respiratory syncytial virus (RSV) infection generally has occurred during autumn and winter. However, a possible change in the seasonal trend of RSV infection has been observed recently. The current study was conducted to determine whether the epidemic season of RSV infection in Japan has indeed changed significantly. We used expectation-based Poisson scan statistics to detect periods with high weekly reported RSV cases (epidemic cluster), and the epidemic clusters were detected between September and December in the 2012-2016 seasons while those were detected between July and October in the 2017-2019 seasons. Non-linear and linear ordinary least squares regression models were built to evaluate whether there is a difference in year trend in the epidemic seasonality, and the epidemic season was shifted to earlier in the year in 2017-2019 compared to that in 2012-2016. Although the reason for the shift is unclear, this information may help in clinical practice and public health.
Keywords: Epidemics; respiratory syncytial virus infections; seasonal shift.
Conflict of interest statement
None.
Figures
Similar articles
-
Change Over Time in Seasonality and Severity of Children Hospitalized With Respiratory Syncytial Virus Infection in Japan.Pediatr Infect Dis J. 2022 Aug 1;41(8):614-619. doi: 10.1097/INF.0000000000003568. Epub 2022 Jul 13. Pediatr Infect Dis J. 2022. PMID: 35544732
-
Exploring the threshold for the start of respiratory syncytial virus infection epidemic season using sentinel surveillance data in Japan.Front Public Health. 2023 Feb 3;11:1062726. doi: 10.3389/fpubh.2023.1062726. eCollection 2023. Front Public Health. 2023. PMID: 36817928 Free PMC article.
-
Modeling the variations in pediatric respiratory syncytial virus seasonal epidemics.BMC Infect Dis. 2011 Apr 21;11:105. doi: 10.1186/1471-2334-11-105. BMC Infect Dis. 2011. PMID: 21510889 Free PMC article.
-
Respiratory syncytial virus seasonality, transmission zones, and implications for seasonal prevention strategy in China: a systematic analysis.Lancet Glob Health. 2024 Jun;12(6):e1005-e1016. doi: 10.1016/S2214-109X(24)00090-1. Epub 2024 Apr 23. Lancet Glob Health. 2024. PMID: 38670132
-
Respiratory syncytial virus epidemics: the ups and downs of a seasonal virus.Pediatr Infect Dis J. 2003 Feb;22(2 Suppl):S21-32. doi: 10.1097/01.inf.0000053882.70365.c9. Pediatr Infect Dis J. 2003. PMID: 12671449 Review.
Cited by
-
Detailed analysis of low temperature inactivation of respiratory syncytial virus.Sci Rep. 2024 May 23;14(1):11823. doi: 10.1038/s41598-024-62658-z. Sci Rep. 2024. PMID: 38783052 Free PMC article.
-
Impact of the Coronavirus Disease 2019 Pandemic on the Clinical Features of Pediatric Respiratory Syncytial Virus Infection in Japan.Open Forum Infect Dis. 2022 Oct 22;9(11):ofac562. doi: 10.1093/ofid/ofac562. eCollection 2022 Nov. Open Forum Infect Dis. 2022. PMID: 36381619 Free PMC article.
-
A phase I study to evaluate safety, pharmacokinetics, and pharmacodynamics of respiratory syncytial virus neutralizing monoclonal antibody MK-1654 in healthy Japanese adults.Clin Transl Sci. 2022 Jul;15(7):1753-1763. doi: 10.1111/cts.13290. Epub 2022 May 17. Clin Transl Sci. 2022. PMID: 35506164 Free PMC article. Clinical Trial.
-
Impact of COVID-19 on Respiratory Virus Infections in Children, Japan, 2018-2023.Immun Inflamm Dis. 2025 Mar;13(3):e70176. doi: 10.1002/iid3.70176. Immun Inflamm Dis. 2025. PMID: 40071746 Free PMC article.
-
An overview on viral interference during SARS-CoV-2 pandemic.Front Pediatr. 2023 Dec 21;11:1308105. doi: 10.3389/fped.2023.1308105. eCollection 2023. Front Pediatr. 2023. PMID: 38178911 Free PMC article. Review.
References
-
- National Institute of Infectious Diseases and Tuberculosis and Infectious Diseases Control Division Ministry of Health Labour and Welfare (2018) Respiratory syncytial virus infection, January 2014–September 2018. Infectious Agents Surveillance Report 39, 207–209.
-
- National Institute of Infectious Diseases. Infectious Diseases Weekly Report (IDWR). Available at https://www.niid.go.jp/niid/en/idwr-e.html (Accessed 6 January 2020).
-
- Neill DB et al. (2005) Detection of emerging space-time clusters. Proceedings of the ACM SIGKDD International Conference on Knowledge Discovery and Data Mining KDD05, 218–227.
-
- R Core Team (2019) R: A Language and Environment for Statistical Computing. Vienna: R Foundation for Statistical Computing.
-
- Centers for Disease Control and Prevention. Respiratory Syncytial Virus Infection (RSV). Available at https://www.cdc.gov/rsv/research/us-surveillance.html (Accessed 13 March 2020).
Publication types
MeSH terms
LinkOut - more resources
Full Text Sources
Other Literature Sources
Medical
