. 2021 May 1;27(9):2470-2480.
doi: 10.1158/1078-0432.CCR-20-4632. Epub 2021 Feb 10.

A Randomized Trial of Combined PD-L1 and CTLA-4 Inhibition with Targeted Low-Dose or Hypofractionated Radiation for Patients with Metastatic Colorectal Cancer

Affiliations

A Randomized Trial of Combined PD-L1 and CTLA-4 Inhibition with Targeted Low-Dose or Hypofractionated Radiation for Patients with Metastatic Colorectal Cancer

Arta M Monjazeb et al. Clin Cancer Res. .

Erratum in

Abstract

Purpose: Prospective human data are lacking regarding safety, efficacy, and immunologic impacts of different radiation doses administered with combined PD-L1/CTLA-4 blockade.

Patients and methods: We performed a multicenter phase II study randomly assigning patients with metastatic microsatellite stable colorectal cancer to repeated low-dose fractionated radiation (LDFRT) or hypofractionated radiation (HFRT) with PD-L1/CTLA-4 inhibition. The primary endpoint was response outside the radiation field. Correlative samples were analyzed using multiplex immunofluorescence (IF), IHC, RNA/T-cell receptor (TCR) sequencing, cytometry by time-of-flight (CyTOF), and Olink.

Results: Eighteen patients were evaluable for response. Median lines of prior therapy were four (range, 1-7). Sixteen patients demonstrated toxicity potentially related to treatment (84%), and 8 patients had grade 3-4 toxicity (42%). Best response was stable disease in 1 patient with out-of-field tumor shrinkage. Median overall survival was 3.8 months (90% confidence interval, 2.3-5.7 months). Correlative IF and RNA sequencing (RNA-seq) revealed increased infiltration of CD8+ and CD8+/PD-1+/Ki-67+ T cells in the radiation field after HFRT. LDFRT increased foci of micronuclei/primary nuclear rupture in two subjects. CyTOF and RNA-seq demonstrated significant declines in multiple circulating immune populations, particularly in patients receiving HFRT. TCR sequencing revealed treatment-associated changes in T-cell repertoire in the tumor and peripheral blood.

Conclusions: We demonstrate the feasibility and safety of adding LDFRT and HFRT to PD-L1/CTLA-4 blockade. Although the best response of stable disease does not support the use of concurrent PD-L1/CTLA-4 inhibition with HFRT or LDFRT in this population, biomarkers provide support that both LDFRT and HFRT impact the local immune microenvironment and systemic immunogenicity that can help guide future studies.


Figures

Figure 1.
Figure 1.
T-cell populations in the tumor microenvironment. Multiplex immunofluorescence evaluating expression of cyokeratin (purple), CD8 (white), PD-1 (green) and Ki67 (red) as shown on the right. Baseline variability in CD8+ and PD-1+ cell populations (A), with highest levels of both populations observed in the irradiated liver lesion from the subject who reported an out-of-field response. Changes in cell populations (B) over the course of treatment in the hypofractionated radiation (HFRT) and low dose fractionated radiation therapy (LDFRT) arms (on-treatment samples obtained week 7–8). In 1B, for each patient, the variance at a time point was estimated by [number of frames * SEM2] and the variance of the difference (post-pre) was estimated by the sum of the time point variances. The standard deviation of the difference was the square root of the variance. Baseline (top) and on treatment (bottom) specimen from a patient treated with HFRT (C) demonstrates increases in CD8+/PD1+/Ki67+ cells (yellow arrows).
Figure 2.
Figure 2.
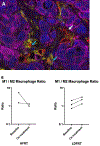
Macrophage populations within the tumor microenvironment. Multiplex immunofluorescence evaluating expression of cyokeratin (purple), DAPI (blue), CD68 (red) and CD163 (yellow) as shown (A). M1 macrophages demonstrate CD68 staining (white arrow) while M2 demonstrate CD68 and CD163 co staining (blue arrows). Changes in the ratio of M1 to M2 cell populations over the course of treatment (on-treatment samples obtained week 7–8) in the hypofractionated radiation (HFRT) and low dose fractionated radiation therapy (LDFRT) arms (B).
Figure 3.
Figure 3.
Multiplex immunofluorescence evaluating formation of micronuclei and primary nuclear ruptures. Samples were stained for cytokeratin (purple), DAPI (blue), cGAS (green) and Lamin B receptor (white) as shown (low power, A). Micronuclei and primary nuclear rupture(s) were scored by identifying co-localization of cGAS and DAPI outside of the nucleus for micronuclei and cGAS with a DAPI defect in the nuclear rim of primary nuclei for primary nuclear ruptures (red arrow, B). Pre-treatment (B) and post-treatment (D) specimens (on-treatment samples obtained week 7–8) demonstrate pronounced increase in micronuclei and foci of primary nuclear ruptures (red arrows) in 2 subjects.
Figure 4.
Figure 4.
Changes in circulating biomarkers between pre-treatment and week 5 of treatment-weeks. Absolute lymphocyte count (ALC, cells/mL) (A). Median, inter-quartile range and maximum changes are plotted for both treatment arms. Fold-change in cell populations over the course of treatment (B,C). Heat map shows log2 fold changes for each patient. Significant changes (p<0.05) denoted with *.
Figure 5.
Figure 5.
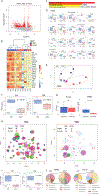
Immunotherapy-induced alterations of the T cell repertoire. RNA-Seq was performed on PBMCs before and after initiation of immunotherapy. Volcano plot of resulting gene expression data reveals numerous differentially expressed genes (outlined in red) post therapy (A). Calculated Euclidean distances between T cell activaton genes (GO Biological Processes) were used to perform complete linkage clustering centered on log2-transformed data. The resulting gene expression heat map highlights gene expression differences in T cell activation genes (B). KEGG pathway analysis reveals significant alterations in immune pathways following initiation of therapy, including the T cell receptor signaling pathway (C). Expression of T cell activation genes (Go Biological Processes) are presented as box-and-whisker plots where the upper and lower bars connected to each box indicate the boundaries of the normal distribution and the box edges mark the first and third quartile boundaries within each distribution (D). The dark horizontal line represents the median. Paired analysis p values were calculated using DESeq2. Principal component analysis of antigen receptor-mediated signaling gene expression data completely separates pre and post tratment samples (E). TCR reads per million (log10) reveals a decline in T cells after treatment (F). TCRminer was used to extract TCR reads from RNA-Seq data and p values were calculated using paired Student’s t-test. MiXCR was used to identify unique complementarity-determining region 3 (CDR3) sequences from RNA-Seq data and the number of expanded and contracted clones per sample were graphed for pre and post treatment samples (G). To visualize how similar T cell clones were to one another with respect to their CDR3 sequences, the number of individual clones present in a particular sample, the copy number of each clone, the expansion and contractions following therapy, and the overlap between the T cell repertoire of the peripheral blood and the tumor-infiltrating cells, T cell repertoire galaxy plots were constructed using a modifed dimensionality reduction strategy (t-SNE) (H). Separate plots were constructed for T cell receptor alpha and and T cell receptor beta (TRB) chains. In these plots the size of the circle represents the CDR3 copy number. The location of the circle represents the CDR3 sequence. Specifically, circles that are located far from one another have dissimilar CDR3 sequences whereas circles that are located close to one another have similar CDR3 sequences. Circles that share a center point have identical CDR3 sequences. Finally, the color of the circle or datapoint represents the sample (blue- PBMC pre-treatment; green- PBMC post-treatment; red- tumor pre-treatment; purple- tumor post-treatment). The Shannon diversity index was calculated for the peripheral blood T cell repertoire pre and post-treatment (I). As another way to visualize the alterations in the T cell repertoire before and after treatment, pie charts were constructed (J). Different colors represent unique CDR3 beta sequences. The size of each colored wedge represents the copy number for that particular CDR3 sequence.

References

    1. Le DT, Uram JN, Wang H, Bartlett BR, Kemberling H, Eyring AD, et al. PD-1 Blockade in Tumors with Mismatch-Repair Deficiency. The New England journal of medicine 2015;372(26):2509–20 doi 10.1056/NEJMoa1500596. - DOI - PMC - PubMed
    1. Overman MJ, McDermott R, Leach JL, Lonardi S, Lenz HJ, Morse MA, et al. Nivolumab in patients with metastatic DNA mismatch repair-deficient or microsatellite instability-high colorectal cancer (CheckMate 142): an open-label, multicentre, phase 2 study. The Lancet Oncology 2017;18(9):1182–91 doi 10.1016/S1470-2045(17)30422-9. - DOI - PMC - PubMed
    1. Ngwa W, Irabor OC, Schoenfeld JD, Hesser J, Demaria S, Formenti SC. Using immunotherapy to boost the abscopal effect. Nat Rev Cancer 2018. doi 10.1038/nrc.2018.6. - DOI - PMC - PubMed
    1. Twyman-Saint Victor C, Rech AJ, Maity A, Rengan R, Pauken KE, Stelekati E, et al. Radiation and dual checkpoint blockade activate non-redundant immune mechanisms in cancer. Nature 2015;520(7547):373–7 doi 10.1038/nature14292. - DOI - PMC - PubMed
    1. Dewan MZ, Galloway AE, Kawashima N, Dewyngaert JK, Babb JS, Formenti SC, et al. Fractionated but not single-dose radiotherapy induces an immune-mediated abscopal effect when combined with anti-CTLA-4 antibody. Clinical cancer research : an official journal of the American Association for Cancer Research 2009;15(17):5379–88 doi 10.1158/1078-0432.CCR-09-0265. - DOI - PMC - PubMed

Publication types

MeSH terms