. 2021 Jun 1;27(11):3190-3200.
doi: 10.1158/1078-0432.CCR-20-3363. Epub 2021 Feb 10.

Synthetic Lethal Screens Reveal Cotargeting FAK and MEK as a Multimodal Precision Therapy for GNAQ-Driven Uveal Melanoma

Affiliations

Synthetic Lethal Screens Reveal Cotargeting FAK and MEK as a Multimodal Precision Therapy for GNAQ-Driven Uveal Melanoma

Justine S Paradis et al. Clin Cancer Res. .

Erratum in

Abstract

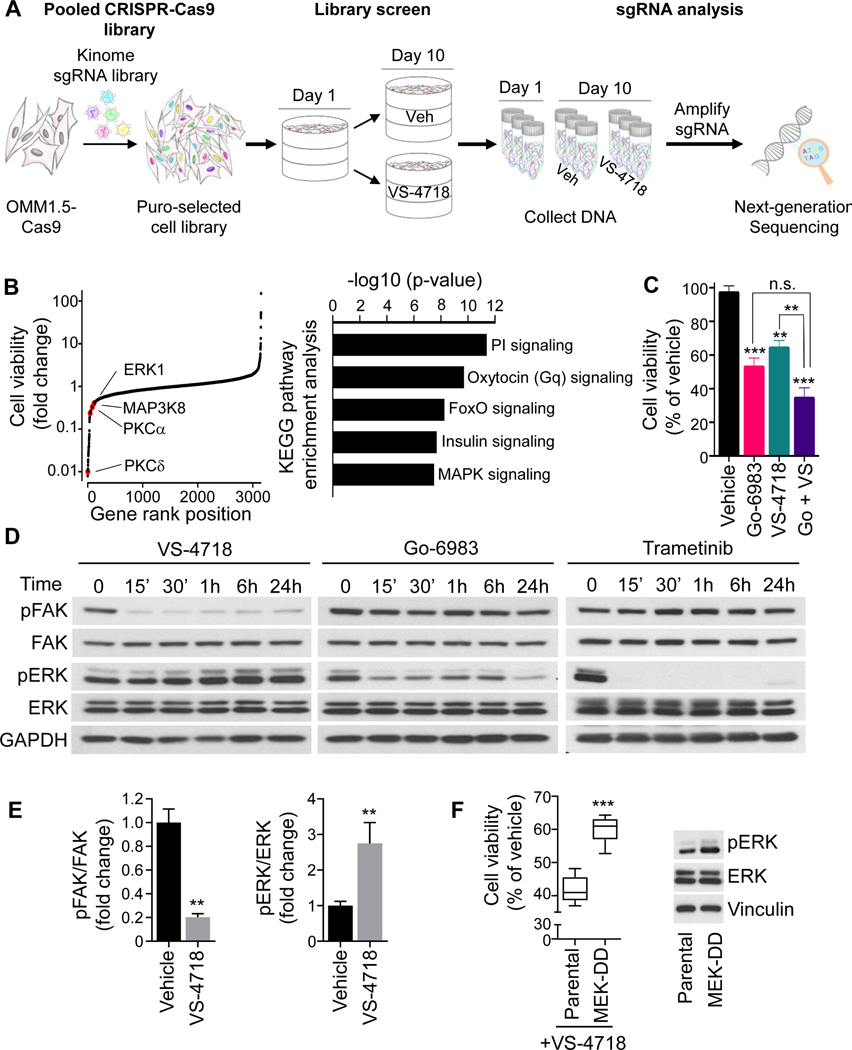
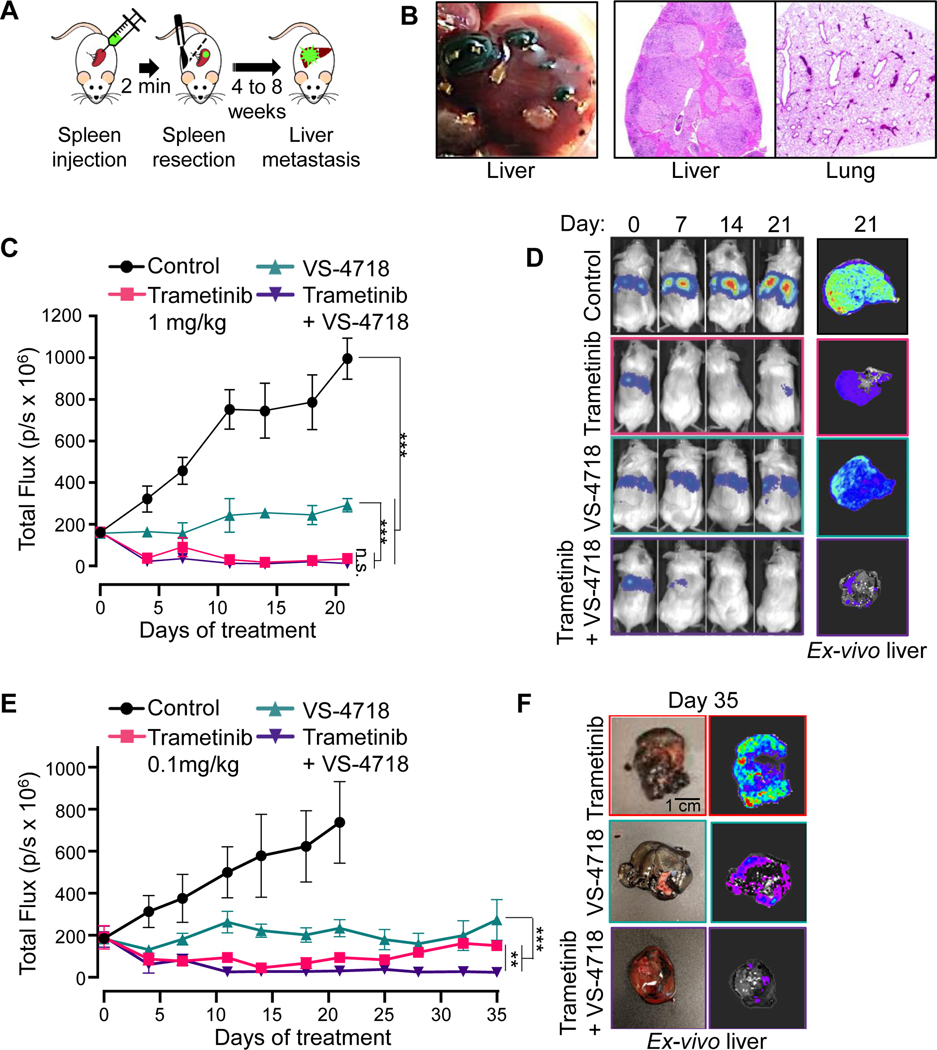
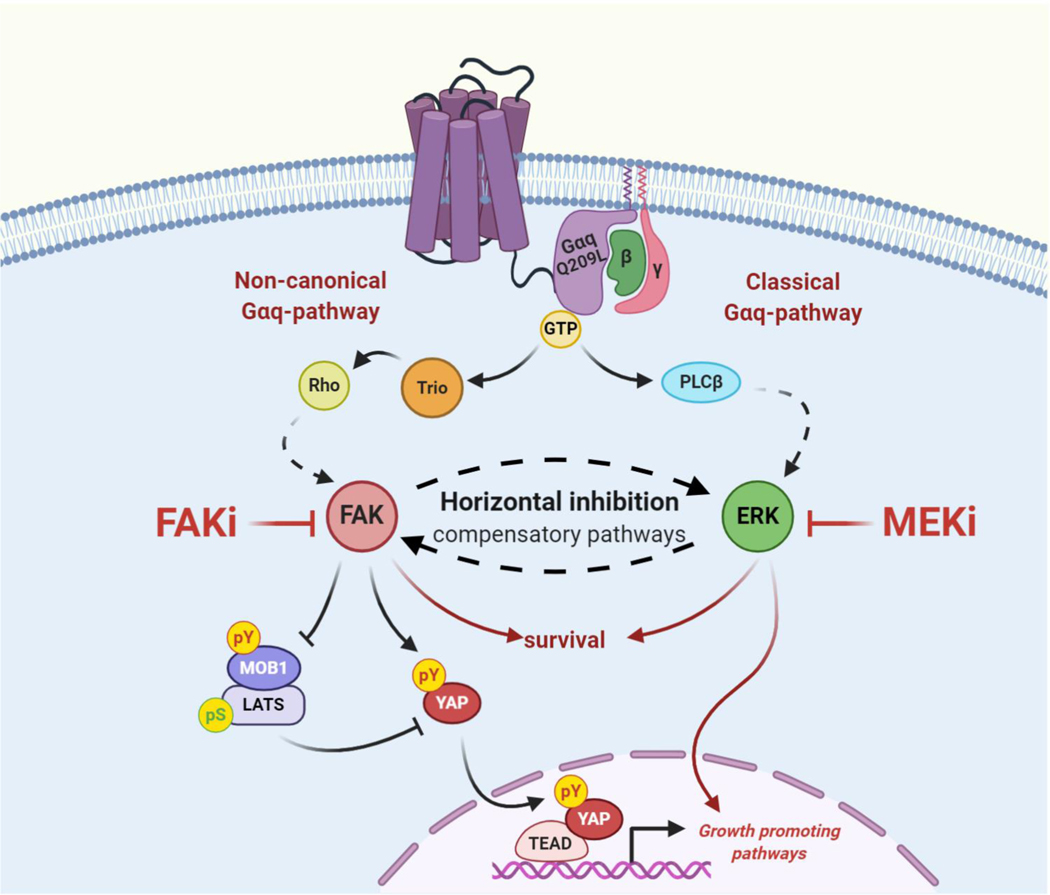
Purpose: Uveal melanoma is the most common eye cancer in adults. Approximately 50% of patients with uveal melanoma develop metastatic uveal melanoma (mUM) in the liver, even after successful treatment of the primary lesions. mUM is refractory to current chemo- and immune-therapies, and most mUM patients die within a year. Uveal melanoma is characterized by gain-of-function mutations in GNAQ/GNA11, encoding Gαq proteins. We have recently shown that the Gαq-oncogenic signaling circuitry involves a noncanonical pathway distinct from the classical activation of PLCβ and MEK-ERK. GNAQ promotes the activation of YAP1, a key oncogenic driver, through focal adhesion kinase (FAK), thereby identifying FAK as a druggable signaling hub downstream from GNAQ. However, targeted therapies often activate compensatory resistance mechanisms leading to cancer relapse and treatment failure.

Experimental design: We performed a kinome-wide CRISPR-Cas9 sgRNA screen to identify synthetic lethal gene interactions that can be exploited therapeutically. Candidate adaptive resistance mechanisms were investigated by cotargeting strategies in uveal melanoma and mUM in vitro and in vivo experimental systems.

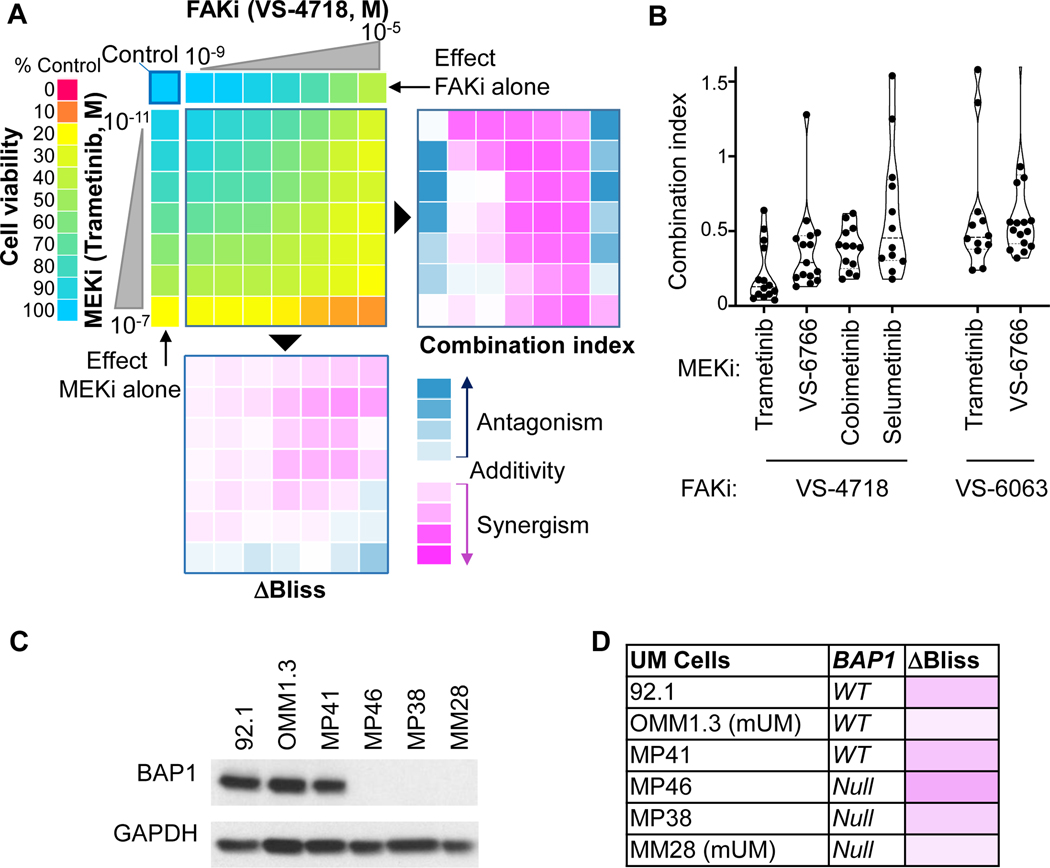
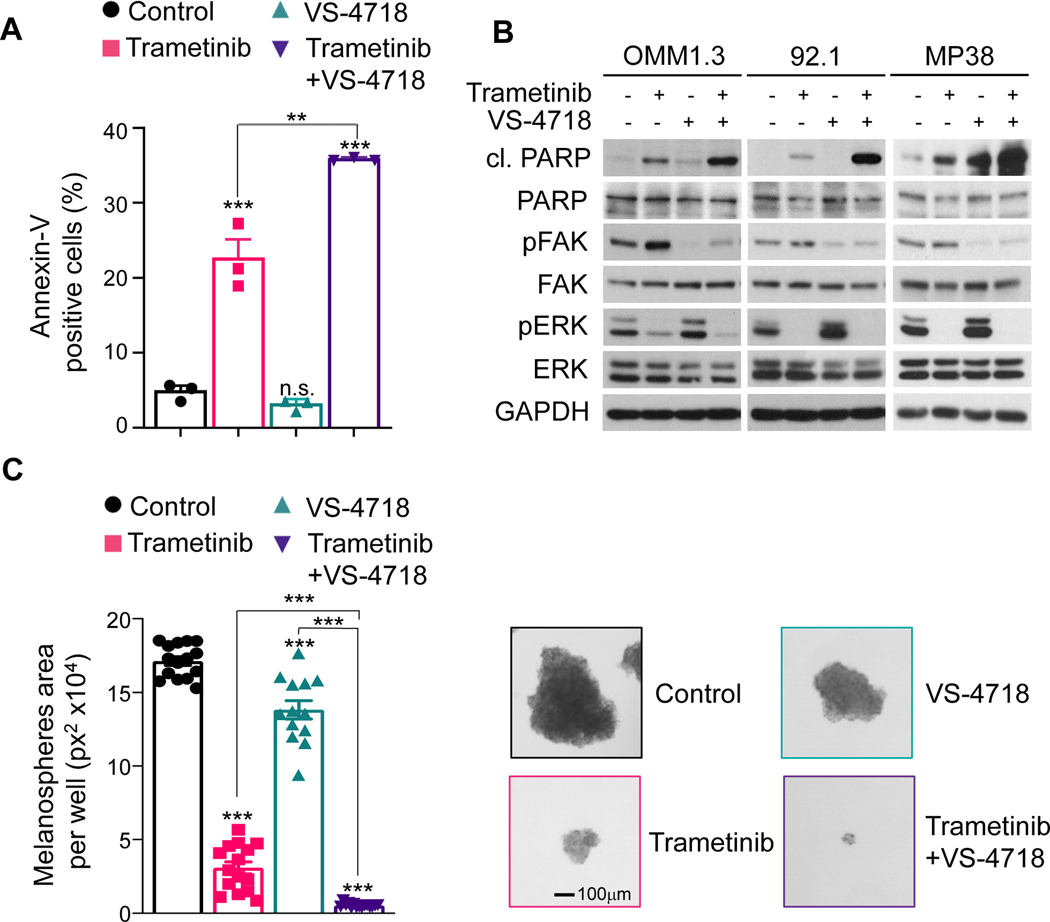
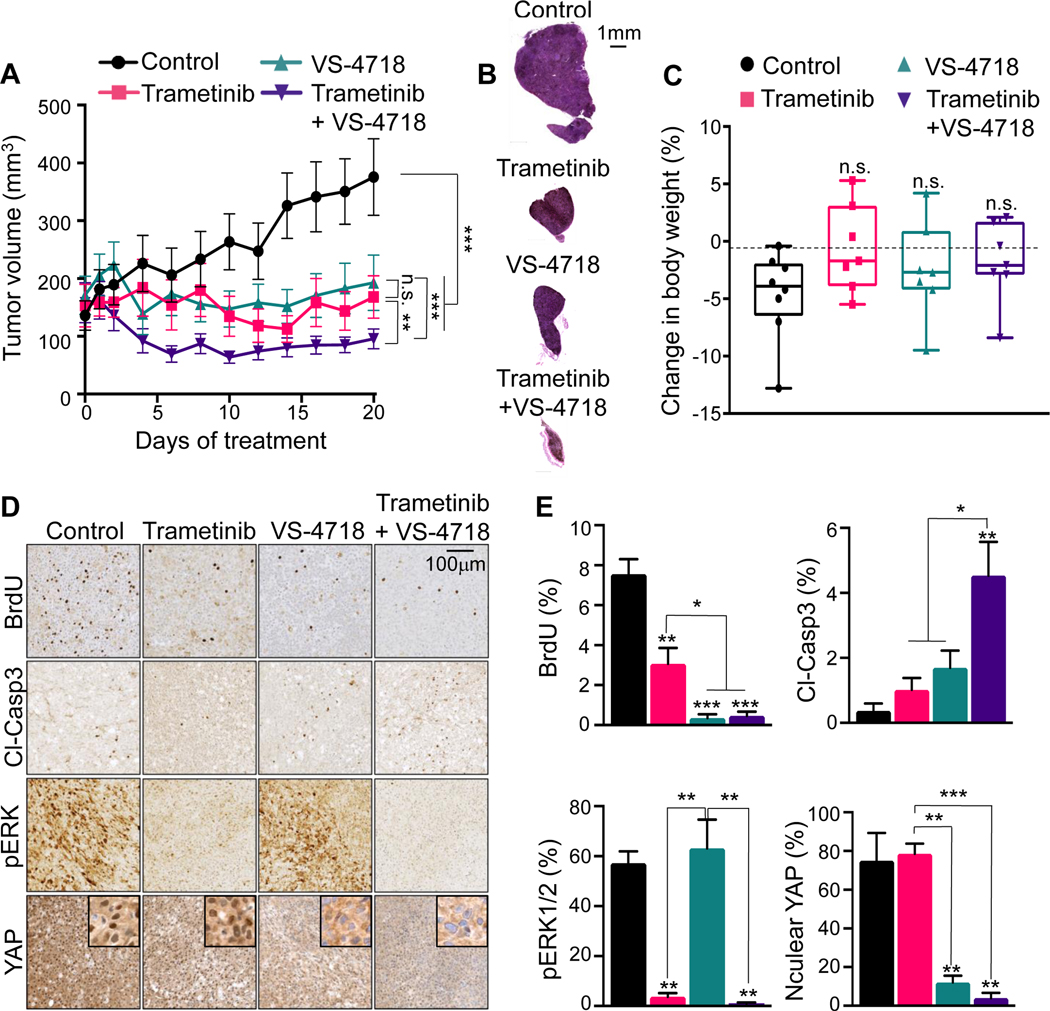
Results: sgRNAs targeting the PKC and MEK-ERK signaling pathways were significantly depleted after FAK inhibition, with ERK activation representing a predominant resistance mechanism. Pharmacologic inhibition of MEK and FAK showed remarkable synergistic growth-inhibitory effects in uveal melanoma cells and exerted cytotoxic effects, leading to tumor collapse in uveal melanoma xenograft and liver mUM models in vivo.

Conclusions: Coupling the unique genetic landscape of uveal melanoma with the power of unbiased genetic screens, our studies reveal that FAK and MEK-ERK cotargeting may provide a new network-based precision therapeutic strategy for mUM treatment.See related commentary by Harbour, p. 2967.


Conflict of interest statement

Conflict of interest disclosure statement: Silvia Coma and Jonathan A. Pachter are employees and stockholders of Verastem Oncology (Needham, MA). Andrew E. Aplin has ownership interest in patent number 9880150. J. Silvio Gutkind is a member of the scientific advisory board of Oncoceutics, Vividion Therapeutics, and Domain Therapeutics, and interested part of a patent filed by UCSD, number 16/824639.

Figures

Figure 1.
Figure 1.. Kinome-wide CRISPR screen for synthetic lethal interactors of FAKi.
(A) OMM 1.5 cells expressing Cas9 were infected with the Brunello Human Kinome CRISPR sgRNA KO library at a MOI of 0.3. After selection, cells were treated with vehicle or 0.5μM VS-4718 (FAKi) for 10 days. (B) Left, Cell viability represented as fold change in FAKi-treated cells compared to control. Highlighted significant hits represent synthetic lethal genes with FAKi treatment. Right, KEGG pathways analysis for the top depleted sgRNAs (n=200). (C) 92.1 cell viability after 72h treatment with vehicle, 1μM Go-6983 (PKCi), 1μM VS-4718 or combination of both. (D) Time-course analysis of FAK and ERK phosphorylation in 92.1 cells treated with VS-4718 (1μM), Go-6983 (1μM) or trametinib (MEKi, 10nM). (E) Quantification of pFAK/FAK and pERK/ERK ratios in 92.1 cells treated with 1μM VS-4718 or vehicle for 1h. (F) Left, Cell viability after 72h treatment with VS-4718 (1μM) in 92.1 cells expressing or not MEK-DD (S218/222D). Right, Immunoblot showing pERK levels in 92.1 cells expressing or not MEK-DD (S218/222D). (C, E and F) Data shown represent the mean ± SEM of three independent experiments. ***p<0.001; **p< 0.01; n.s. not significant.
Figure 2.
Figure 2.. Synergy between FAKi and MEKi in UM and mUM cells.
(A) Left, 92.1 cell viability 72h after treatment. Right, Combination Index values (CI) determined using the Chou-Talalay method (CI<1 synergism, CI=1 additivity, CI>1 antagonism, scale from −2 to +2). Bottom, ΔBliss scores (score<0 synergism, score=0 additivity, score>0 antagonism, scale from −1 to +1). (B) CI at relevant doses (viability=50±5%) using various combinations of FAKi/MEKi. (C) Immunoblot depicting BAP1 levels in UM and mUM patient-derived cells. (D) Delta score (ΔBliss), assessing synergism between MEKi (trametinib, 10nM) and FAKi (VS-4718, 1μM) in a panel of UM and mUM cells with distinct BAP1 status.
Figure 3.
Figure 3.. MEKi/FAKi combination induces apoptosis and reduces UM melanosphere formation.
(A) FACS analysis of cells positive for Annexin V was used to assess the apoptotic response to trametinib (10 nM), VS-4718 (1 μM), and their combination after 24 h of treatment. (B) Immunoblot showing cleaved-PARP, pFAK (pY-397) and pERK levels upon treatment with vehicle, trametinib (10 nM), VS-4718 (1 μM) or trametinib+VS-4718 for 48 hours in UM cells. (C) Left, OMM1.3 melanospheres formation after treatment with vehicle (control), trametinib (10 nM), VS-4718 (1 μM) or trametinib+VS-4718 for 3 weeks. Right, Representative spheres (A and C) Data shown represent the mean ± SEM of three independent experiments. ***p<0.001; **p< 0.01; n.s. not significant.
Figure 4.
Figure 4.. MEKi/FAKi combination UM growth in in vivo xenograft mouse models.
(A) Changes in 92.1 xenograft tumor volume in mice treated with vehicle (Control), trametinib 1 mg/kg, VS-4718 50 mg/kg or trametinib+VS-4718. (B) H&E staining of representative xenograft tumor sections after 20 days of treatment. (C) Difference in mice body weight between day 0 and day 20 of the indicated treatment in 92.1 xenografts mice. Box and whiskers plot with minimum and maximum whiskers (7 mice/group). (D) 92.1 tumor bearing mice were treated with vehicle (Control), trametinib 1 mg/kg, VS-4718 50 mg/kg or trametinib+VS-4718 for 20 days. Representative IHC staining tumor sections for BrdU, cleaved-Caspase3 (cl-Casp3), pERK and YAP. Scale bar is 100 μm and insets are 50 μm wide. (E) Quantification of the IHC stained tumor sections. (A and E) Data are mean±SEM (7 mice/group). *p<0.05; **p<0.01; ***p<0.001; n.s. not significant.
Figure 5.
Figure 5.. MEKi/FAKi combination reduces UM cells growth in an in vivo liver metastasis model.
(A) Schematic of the hematogenous dissemination model for UM liver metastasis using 92.1 GFP-Luc cells. (B) Left, Macroscopic view of liver metastasis 8 weeks post-splenic injection. Right, H&E staining of liver and lung. (C) Hepatic tumor burden tracked by IVIS imaging after injection of 92.1 UM cells in SCID/NOD mice treated with vehicle (Control), trametinib 1 mg/kg, VS-4718 50 mg/kg or both. Data are mean±SEM (6 mice/group). ***p<0.001; n.s. not significant. (D) Representative mice treated with vehicle (Control), trametinib 1 mg/kg, VS-4718 50 mg/kg or both, at the indicated days of treatment, and representative ex-vivo imaging of the liver obtained at day 21. (E) Hepatic tumor burden tracked by IVIS imaging after injection of 92.1 UM cells in SCID/NOD mice treated with vehicle (Control), trametinib 0.1 mg/kg, VS-4718 50 mg/kg or both. Data are mean±SEM (5 mice/group). ***p<0.001; **p<0.01. (F) Representative ex-vivo imaging of the liver from mice treated for 35 days with trametinib 0.1 mg/kg, VS-4718 50 mg/kg or both.
Figure 6.
Figure 6.. Horizontal inhibition of compensatory pathways in UM using MEKi/FAKi combination.
The cartoon depicts the proposed pathways by which active GNAQ mutant controls cell proliferation in UM cells. Horizontal inhibition of FAK and MEK likely acts by disabling growth promoting pathways regulated by YAP while concomitantly targeting parallel converging core survival mechanisms, thereby resulting in mUM regression.

Comment in

References

    1. Fredriksson R, Lagerström MC, Lundin LG, Schiöth HB. The G-protein-coupled receptors in the human genome form five main families. Phylogenetic analysis, paralogon groups, and fingerprints. Mol Pharmacol 2003;63(6):1256–72 doi 10.1124/mol.63.6.1256. - DOI - PubMed
    1. Schöneberg T, Schulz A, Biebermann H, Hermsdorf T, Römpler H, Sangkuhl K. Mutant G-protein-coupled receptors as a cause of human diseases. Pharmacology & therapeutics 2004;104(3):173–206 doi 10.1016/j.pharmthera.2004.08.008. - DOI - PubMed
    1. Rosenbaum DM, Rasmussen SG, Kobilka BK. The structure and function of G-protein-coupled receptors. Nature 2009;459(7245):356–63 doi 10.1038/nature08144. - DOI - PMC - PubMed
    1. Simon MI, Strathmann MP, Gautam N. Diversity of G proteins in signal transduction. Science 1991;252(5007):802–8 doi 10.1126/science.1902986. - DOI - PubMed
    1. Wu V, Yeerna H, Nohata N, Chiou J, Harismendy O, Raimondi F, et al. Illuminating the Onco-GPCRome: Novel G protein-coupled receptor-driven oncocrine networks and targets for cancer immunotherapy. J Biol Chem 2019;294(29):11062–86 doi 10.1074/jbc.REV119.005601. - DOI - PMC - PubMed

Publication types

MeSH terms

Substances