. 2021 Jul;11(7):1716-1735.
doi: 10.1158/2159-8290.CD-20-1351. Epub 2021 Feb 10.

Exploiting Allosteric Properties of RAF and MEK Inhibitors to Target Therapy-Resistant Tumors Driven by Oncogenic BRAF Signaling

Affiliations

Exploiting Allosteric Properties of RAF and MEK Inhibitors to Target Therapy-Resistant Tumors Driven by Oncogenic BRAF Signaling

Christos Adamopoulos et al. Cancer Discov. 2021 Jul.

Abstract

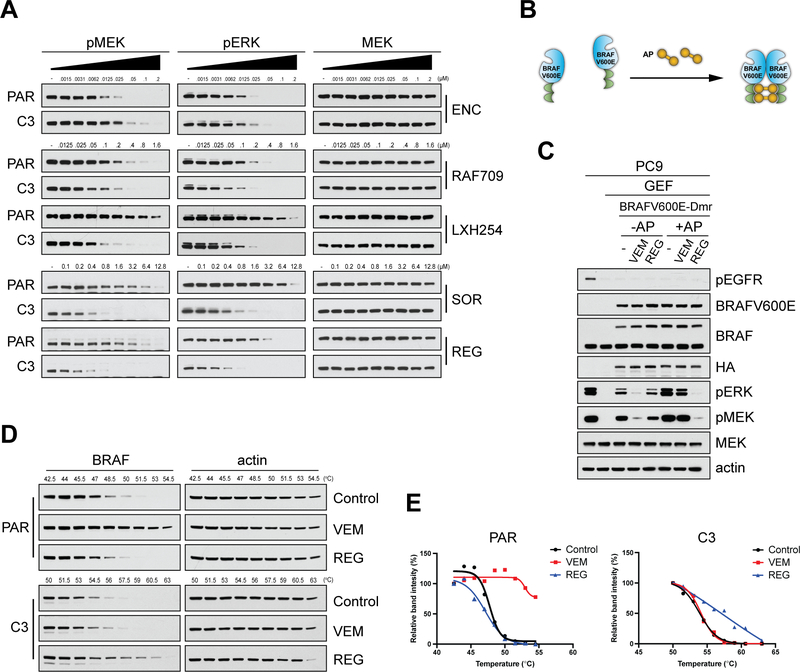
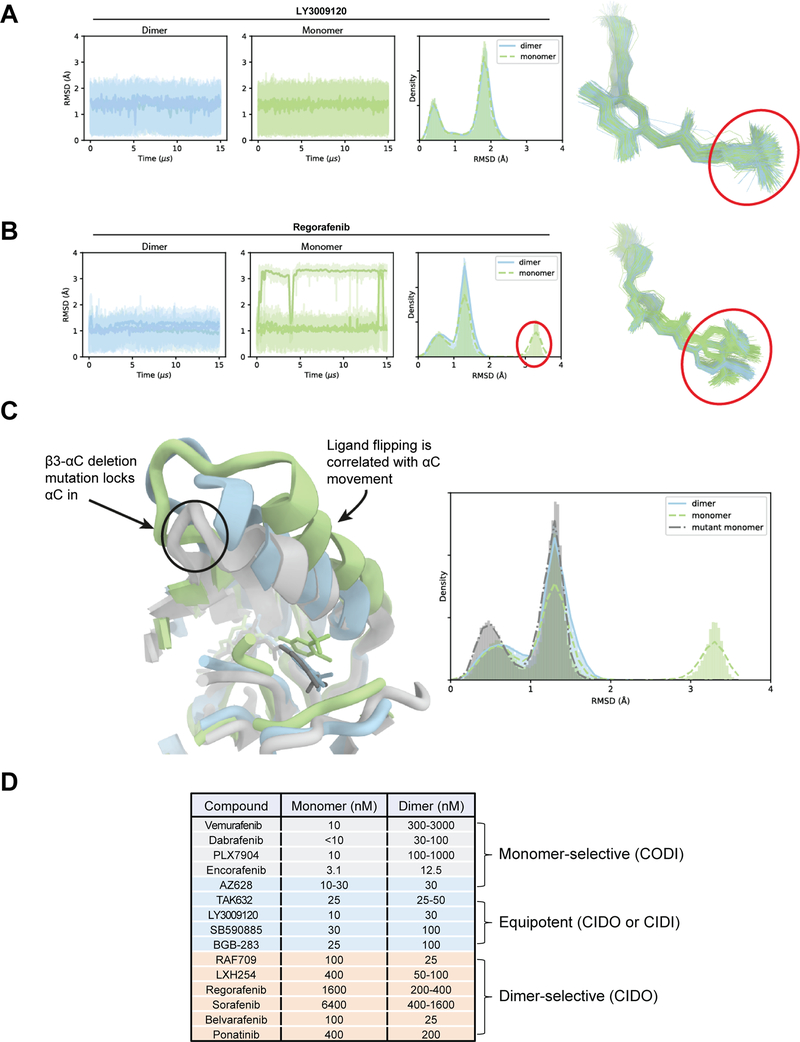
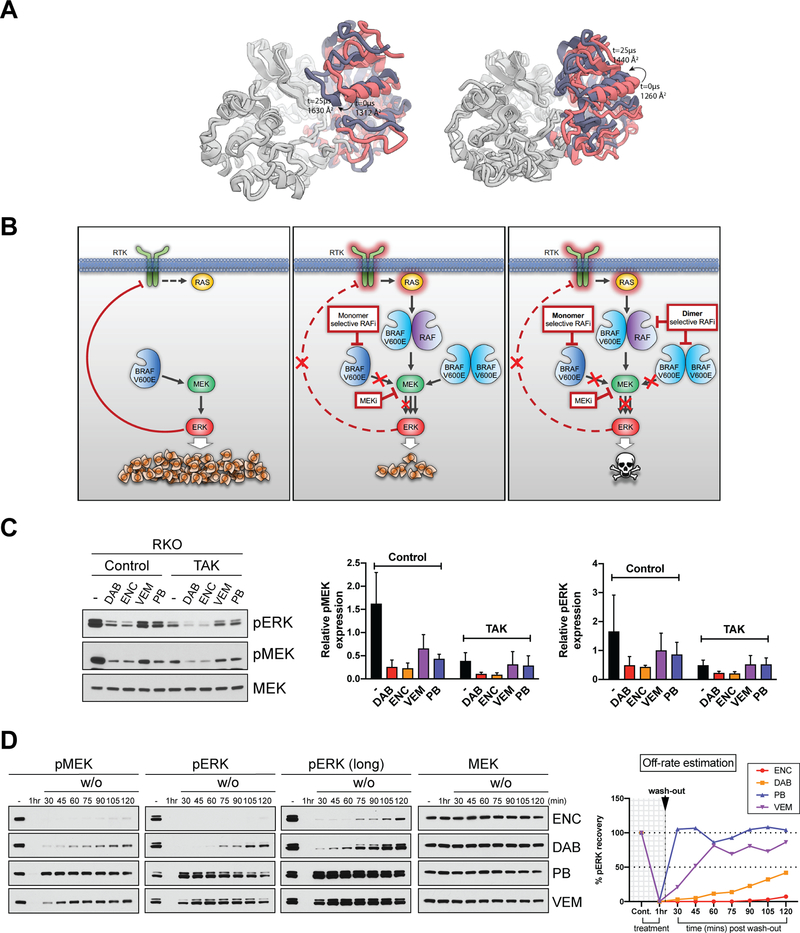
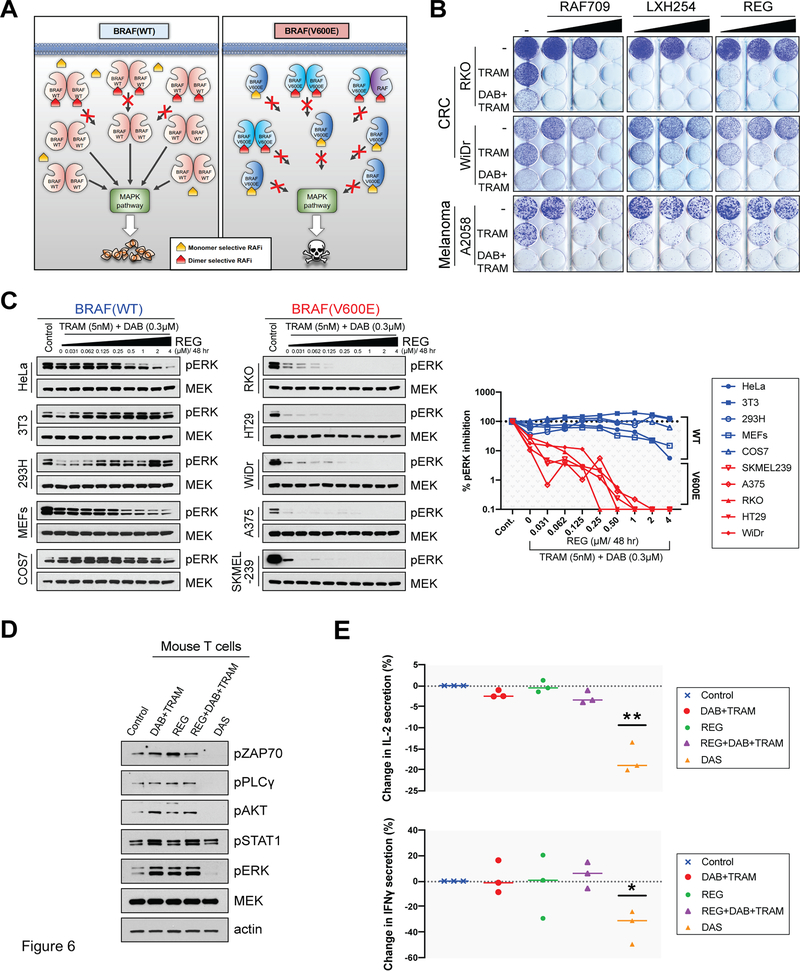
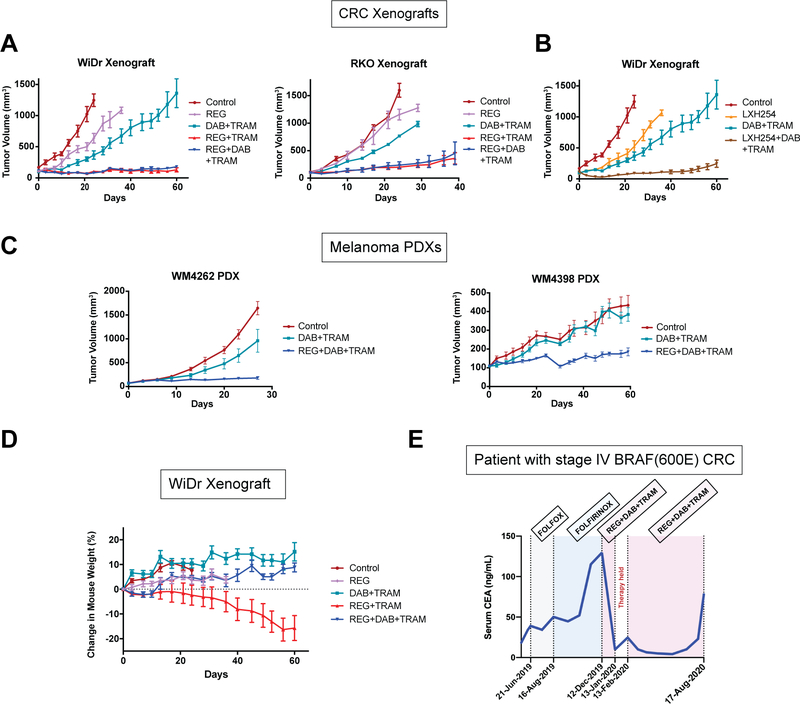
Current clinical RAF inhibitors (RAFi) inhibit monomeric BRAF (mBRAF) but are less potent against dimeric BRAF (dBRAF). RAFi equipotent for mBRAF and dBRAF have been developed but are predicted to have lower therapeutic index. Here we identify a third class of RAFi that selectively inhibits dBRAF over mBRAF. Molecular dynamic simulations reveal restriction of the movement of the BRAF αC-helix as the basis of inhibitor selectivity. Combination of inhibitors based on their conformation selectivity (mBRAF- plus dBRAF-selective plus the most potent BRAF-MEK disruptor MEK inhibitor) promoted suppression of tumor growth in BRAFV600E therapy-resistant models. Strikingly, the triple combination showed no toxicities, whereas dBRAF-selective plus MEK inhibitor treatment caused weight loss in mice. Finally, the triple combination achieved durable response and improved clinical well-being in a patient with stage IV colorectal cancer. Thus, exploiting allosteric properties of RAF and MEK inhibitors enables the design of effective and well-tolerated therapies for BRAFV600E tumors. SIGNIFICANCE: This work identifies a new class of RAFi that are selective for dBRAF over mBRAF and determines the basis of their selectivity. A rationally designed combination of RAF and MEK inhibitors based on their conformation selectivity achieved increased efficacy and a high therapeutic index when used to target BRAFV600E tumors.See related commentary by Zhang and Bollag, p. 1620.This article is highlighted in the In This Issue feature, p. 1601.


Conflict of interest statement

No competing financial interests.

Figures

Figure 1.
Figure 1.. Identification of RAF dimer-selective inhibitors.
(A) SKMEL239 Parental (PAR) cells and the resistant clone C3 were treated for 1 hr with increasing concentrations of the indicated RAF inhibitors, and cell lysates were immunoblotted for pMEK and pERK. (B) Schematic showing the Chemically Induced Dimerization (CID) system using a chemical ligand (AP). Ectopic expression of BRAFV600E engineered to dimerize (BRAFV600E-Dmr) enables AP ligand induced formation of BRAFV600E homodimers. (C) PC9 cells ectopically expressing BRAFV600E-Dmr were pre-treated for 1 hr with Gefitinib (GEF, 100 nM), followed by treatment with the AP ligand (100 nM/1 hr), then treated with Vemurafenib (VEM, 2 μΜ/1 hr) or Regorafenib (REG, 2 μΜ/1 hr). Cell lysates were immunoblotted with the indicated antibodies. (D) PAR or C3 cells were treated with VEM (4 μΜ and 2 μΜ, respectively), REG (4 μΜ or 2 μΜ, respectively) or DMSO (Control) for 2 hr followed by cellular thermal shift assay (CETSA) at the indicated increasing temperature points and the cell lysates were immunoblotted for BRAF and actin. (E) Graphs based on relative binding intensity (%) derived from Fig. 1D using ImageJ analysis. The graphs were plotted in GraphPad Prism using the Boltzmann sigmoid equation.
Figure 2.
Figure 2.. Restriction of the movement of the αC-helix of BRAF by inhibitor is the basis of the difference in selectivity between equipotent and dimer-selective RAF inhibitors.
(A) Simulation trajectories of LY3009120, an equipotent binder, bound to dimeric (blue) and monomeric (green) BRAF. Root-mean-square deviation (RMSD) of the heavy atoms of the circled portion of the ligand are plotted. The RMSD histograms represent aggregate values across all three replicates. (B) Simulation trajectories of Regorafenib, a dimer-preferring compound, bound to dimeric (blue) and monomeric (green) BRAF. In the monomeric case, the portion of the ligand that interacts with the specificity pocket is able to flip, producing the high RMSD conformation circled in red. (C) Overlay of simulated structure snapshots of Regorafenib bound to dimeric WT (blue), monomeric WT (green), and the monomeric β3-αC deletion mutant of BRAF (gray). The mutation restricts the motion of the αC helix, and thus Regorafenib. (D) Three different groups of RAF inhibitors based on their differential selectivity for monomeric or dimeric BRAF(V600E).
Figure 3.
Figure 3.. Transition of either BRAF(WT) or BRAF(V600E) to the dimeric state increases its interaction with MEK.
(A-B) HeLa cells were treated with epidermal growth factor (EGF, 10 ng/mL) for the indicated time points. Cell lysates were subjected to immunoprecipitation with a MEK antibody followed by immunoblotting for BRAF, CRAF and ERK (A) or immunoblotted with the indicated antibodies (B). (C) Schematic showing the transition from an “inactive” signaling complex with weak interaction between BRAF and MEK to an “active” signaling complex with strong BRAF/MEK interaction upon treatment with EGF. (D) RKO cells were treated for 2 hr with the SHP2 inhibitor RMC-4550 (2 μΜ) to suppress endogenous RAS activity. Cell lysates were then either subjected to immunoprecipitation with a MEK antibody followed by immunoblotting for BRAF, or immunoblotted with the indicated antibodies. (E) PC9 cells were treated for 2 hr with Gefitinib (GEF, 0.5 μM) to suppress endogenous RAS activity. Cell lysates were then either subjected to immunoprecipitation with a MEK antibody followed by immunoblotting for BRAF, or immunoblotted with the indicated antibodies. (F) 293H cells ectopically expressing HA-tagged BRAFV600E-Dmr were treated with the AP ligand (100 nM/ 1 hr) and cell lysates were either subjected to immunoprecipitation with a MEK antibody followed by immunoblotting for HA or BRAFV600E, or immunoblotted with the indicated antibodies. (G) Schematic showing the Chemically Induced Dimerization (CID) system using a chemical ligand (AP). Ectopic expression of both BRAF and CRAF engineered to dimerize (BRAF-Dmr and CRAF-Dmr) enables AP ligand induced formation of both BRAF/CRAF homo- and heterodimers. (H) 293H cells ectopically co-expressing HA-tagged BRAF-Dmr and CRAF-Dmr were treated with the AP ligand (100 nM/ 1 hr). Cell lysates were either subjected to immunoprecipitation with a MEK antibody followed by immunoblotting for HA, or immunoblotted with the indicated antibodies. (I) Cells expressing full-length or splice variants of BRAF(V600E) (SKMEL239 Parental (PAR) and C3, M397-PAR and M397-R), or expressing full-length BRAF(V600E) or BRAF(V600E/DK), i.e. with a duplicate kinase domain ((SK28-PAR) and SK28-R, respectively) were either subjected to immunoprecipitation with a MEK antibody followed by immunoblotting for BRAFV600E, or immunoblotted with the indicated antibodies. (J) Schematic depicting different conformations adopted by monomeric and dimeric BRAF in different mutational contexts: BRAF(WT) transitions from monomeric and the catalytically inactive (1) to activated dimer bound to RAS in the membrane (2). BRAF(V600E) is a catalytically active monomer in the cytosol (3), whereas the splice variant of BRAF(V600E) is a cytosolic dimer (4). (1) and (3) are monomers and interact weakly with MEK, (2) and (4) are dimers and interact strongly with MEK.
Figure 4.
Figure 4.. Selection of RAF inhibitors for use in combinatorial regimens based on their biochemical properties.
(A) Final structures from two 25-μs simulations of BRAF-MEK complexes, starting from active αC-IN (left) and αC-OUT (right) conformations. MEK is shown in gray, the starting BRAF structure is shown in pink, and the final frame of simulation is shown in purple. αC-IN BRAF, closely resembling the WT dimeric state, forms a larger interface with MEK, with key interactions between the αC helix of BRAF and the N-lobe of MEK. (B) Schematic model showing the proposed combinatorial targeting strategy for BRAF(V600E) tumors. At steady state, full-length monomeric BRAF(V600E) activates the MAPK pathway leading to cell proliferation and tumor growth, while activated ERK feedback-suppresses the upstream activation of receptor tyrosine kinases (RTK) (left). Addition of monomer-selective RAF inhibitors results in relief of negative feedback, RAS activation and induction of dimeric BRAF(V600E) (middle). Combining RAF dimer-selective with RAF monomer-selective inhibitors could overcome adaptive resistance in BRAF(V600E) tumors (right). (C) RKO cells treated for 48 hr with 0.8 μΜ of the indicated RAF inhibitors (Dabrafenib (DAB), Encorafenib (ENC), Vemurafenib (VEM), and PLX7904 (PB)) alone or with 0.6 μΜ of the same RAF inhibitors combined with 0.2 μΜ of TAK632 (TAK). Cell lysates were immunoblotted with the indicated antibodies and representative results of three repeats are shown (left). Quantitation of ERK (right) and MEK (middle) phosphorylation using ImageJ analysis. pERK and pMEK expression levels were normalized to MEK. (D) RKO cells were either treated for 1 hr with indicated RAF inhibitors, or treated for 1 hr, washed three times with PBS, supplemented with fresh inhibitor-free medium and collected at the indicated time points. The concentrations used were previously normalized to equipotently inhibit pERK in 1 hr: 100 nM ENC, 100 nM DAB, 200 nM PB and 600 nM VEM. Left: Cell lysates were immunoblotted with indicated antibodies. Right: Summary graph showing the percentage (%) of pMEK recovery over time (min) after the washout of the indicated RAF inhibitors, as an estimate of their off-rate. Graph was plotted based on relative expression levels of pMEK normalized to MEK after ImageJ analysis (Supplementary Fig. S4).
Figure 5.
Figure 5.. Selection of MEK inhibitors for use in combinatorial regimens based on their biochemical properties.
(A) Cell lysates from RAS-MUT (HCT116 KRAS(G13D)) or BRAF-MUT (A375 BRAF(V600E)) cells treated with the indicated concentrations of MEK inhibitors for 30 min or 24 hr were immunoblotted with the indicated antibodies and representative results of three repeats are shown (left). Graphs showing the percentage (%) of pERK inhibition in RAS MUT and BRAF MUT cells upon treatment with the indicated MEK inhibitors (right). Graphs were plotted based on pMEK and pERK relative expression levels normalized to MEK after ImageJ analysis (B) Top: Schematic showing the strategy followed to determine the direct allosteric effect of MEK inhibitors (BRAF/MEK complex formation or disruption). Middle: RAS mutant (RAS MUT, HCT116 KRAS(G13D)) cells or BRAF mutant (BRAF MUT, A375 BRAF(V600E)), cells were pre-treated with 2 μΜ of ERK inhibitor (ERKi) SCH772984 for 2 hr followed by treatment with the indicated concentrations of MEK inhibitors for 1 hr. Cell lysates were either subjected to immunoprecipitation with a MEK antibody followed by immunoblotting for BRAF and CRAF or immunoblotted with the indicated antibodies. Bottom: Graphs showing the percentage (%) of BRAF/MEK complex formation or disruption in RAS MUT and BRAF MUT cells upon subsequent treatment with ERKi and the indicated MEK inhibitors. Graphs were plotted based on pMEK and pERK relative expression levels normalized to MEK after ImageJ analysis. (C) Binding affinity of the indicated MEK inhibitors to purified MEK1. Kd values were determined using the KinomeScan binding assay. (D) RAS MUT (HCT116 KRAS(G13D)) cells pre-treated with 2 μΜ of ERKi for 2 hr followed by treatment with the indicated normalized concentrations of MEK inhibitors for 1 hr. Cell lysates were subjected to immunoprecipitation with a MEK antibody followed by immunoblotting for BRAF or immunoblotted with the indicated antibodies. (E) Overlay of docking binding pose for Trametinib (TRAM, navy-blue) and crystallographic binding poses for Selumetinib/Binimetinib (SEL/BIN, yellow), Cobimetinib (COB, dark purple), PD0325901 (PD901, grey), TAK-733 (cyan) and CH5126766 (CH766, salmon) with MEK1. SEL/BIN: LIG ID:3EW, PDB-ID:4U7Z; COB: LIG ID:EUI, PDB-ID:4AN2; PD901: LIG ID:4BM, PDB-ID:3EQG; TAK-733: LIG ID:IZG, PDB-ID:3PPL; CH766: LIG ID:CHU, PDB-ID:3WIG; and TRAM docked to 3WIG structure. (F) Table summarizing the relative biochemical properties of MEK inhibitors used in this study.
Figure 6.
Figure 6.. The combination of a RAF monomer-selective with a RAF dimer-selective and a potent MEK-RAF “disruptor” MEK inhibitor potently and selectively suppresses MAPK signaling in BRAF(V600E) cells.
(A) Schematic model showing the differential effect of combining RAF monomer-selective and RAF dimer-selective inhibitors in normal versus tumor cells. In normal, BRAF(WT), cells the drug combination maintains MAPK signaling close to basal levels (left). In tumor, BRAF(V600E), cells the same amount of RAF monomer-selective and RAF dimer selective inhibitors synergize suppressing the MAPK pathway (right). (B) Crystal violet cell growth assays assessing the effect of increasing concentrations of Regorafenib (REG) (200, 500, and 1000 nM), LXH254 (100, 200, and 500 nM), and RAF709 (100, 200, and 500 nM), the double combination with Trametinib (TRAM) and the triple combination with TRAM and Dabrafenib (DAB) in the indicated colorectal cancer (CRC) or melanoma cell lines. The used concentrations were 200, 500, 1000 nM REG and LXH254, RAF709 100, 200, and 500 nM, TRAM 2 nM for RKO, 0.3 nM for WiDr, and 1 nM for A2058, and for DAB 300 nM for RKO, 50 nM for WiDr, and 150 nM for A2058. (C) The indicated BRAF(WT) and BRAF(V600E) cell lines were treated with increasing concentrations of REG for 48 hr in combination with TRAM and DAB and pERK inhibition was determined by immunoblotting (left). Summary graph showing the percentage (%) of pERK inhibition in the indicated BRAF(WT) and BRAF(V600E) cell lines (right). Graph was plotted based on relative expression levels of pERK normalized to MEK after ImageJ analysis (Supplementary Fig. S6A). (D-E) Activated mouse T cells treated with DAB (0.3μΜ) and TRAM (5nM), REG (1μM), the triple combination of DAB (0.3μΜ), TRAM (5nM) and REG (1μM) or with Dasatinib (DAS, 2 μΜ). (D) Cell lysates from activated mouse T cells treated for 48 hr with the indicated inhibitors were immunoblotted with the indicated antibodies. (E) The concentrations of IL-2 and IFN-γ were determined by ELISA in supernatants of activated mouse T cells treated with the indicated inhibitors for 24 hr (IL-2) or 48 hr (IFN-γ). Graphs showing the change (%) in IL-2 (top) or IFN-γ (bottom) concentrations. Data are represented as mean ± SEM (*, P < 0.05; **, P < 0.01; ***, P <0.001).
Figure 7.
Figure 7.. The combination of a RAF monomer-selective with a RAF dimer-selective and a potent MEK-RAF “disruptor” MEK inhibitor is effective and well tolerated in vivo
. (A-B) WiDr or RKO cells were injected subcutaneously into the flanks of nude mice (10 million cells per injection). When tumors reached 100–150 mm3 in size, mice were randomized and treated with vehicle (Control), Regorafenib (REG, 30 mg/kg), Dabrafenib (DAB, 30 mg/kg)+Trametinib (TRAM, 0.25 mg/kg), REG (30 mg/kg)+TRAM (0.25 mg/kg) or REG (30 mg/kg)+DAB (30 mg/kg)+TRAM (0.25 mg/kg) and LXH254 (30 mg/kg) or LXH254 (30 mg/kg)+DAB (30 mg/kg)+TRAM (0.25 mg/kg) once daily for 40 (RKO xenograft) or 60 (WiDr xenograft) days. Graphs show mean tumor volumes (± SEM) vs time. (C) NSG mice were injected with the indicated PDX melanoma cells (WM4262 and WM4398). When the tumors were palpable, mice were randomized into either vehicle control, DAB (30 mg/kg)+TRAM (0.3 mg/kg) or REG (30 mg/kg)+DAB (30 mg/kg)+TRAM (0.3 mg/kg). Mice were fed chow containing the DAB+TRAM daily or treated with REG+DAB+TRAM 5 days on, 2 days off for 28 (WM4262 PDX) or 60 (WM4398 PDX) days. Graphs show mean tumor volumes (± SEM) vs time. (D) Body weight of mice bearing the WiDr xenograft and treated with the indicated inhibitors was measured every three days for 60 days. Graph shows the change in mouse weight (%). Data are represented as mean ± SEM. (E) Concentration of carcinoembryonic antigen (CEA) in the serum of a colorectal BRAF(V600E) patient treated with different regimens.

Comment in

References

    1. Davies H, Bignell GR, Cox C, Stephens P, Edkins S, Clegg S, et al. Mutations of the BRAF gene in human cancer. Nature 2002;417(6892):949–54 doi 10.1038/nature00766. - DOI - PubMed
    1. Hodis E, Watson IR, Kryukov GV, Arold ST, Imielinski M, Theurillat JP, et al. A landscape of driver mutations in melanoma. Cell 2012;150(2):251–63 doi 10.1016/j.cell.2012.06.024. - DOI - PMC - PubMed
    1. Subbiah V, Baik C, Kirkwood JM. Clinical Development of BRAF plus MEK Inhibitor Combinations. Trends Cancer 2020;6(9):797–810 doi 10.1016/j.trecan.2020.05.009. - DOI - PubMed
    1. Poulikakos PI, Zhang C, Bollag G, Shokat KM, Rosen N. RAF inhibitors transactivate RAF dimers and ERK signalling in cells with wild-type BRAF. Nature 2010;464(7287):427–30 doi 10.1038/nature08902. - DOI - PMC - PubMed
    1. Poulikakos PI, Persaud Y, Janakiraman M, Kong X, Ng C, Moriceau G, et al. RAF inhibitor resistance is mediated by dimerization of aberrantly spliced BRAF(V600E). Nature 2011;480(7377):387–90 doi 10.1038/nature10662. - DOI - PMC - PubMed

Publication types

MeSH terms

Substances