. 2021 Feb 10;6(1):e01090-20.
doi: 10.1128/mSphere.01090-20.

APEX2 Proximity Proteomics Resolves Flagellum Subdomains and Identifies Flagellum Tip-Specific Proteins in Trypanosoma brucei

Affiliations

APEX2 Proximity Proteomics Resolves Flagellum Subdomains and Identifies Flagellum Tip-Specific Proteins in Trypanosoma brucei

Daniel E Vélez-Ramírez et al. mSphere. .

Abstract

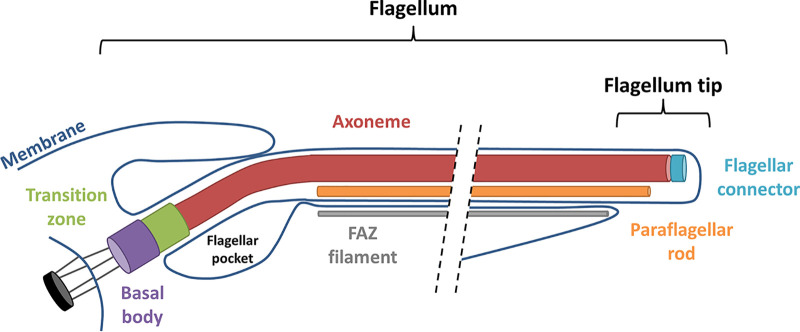
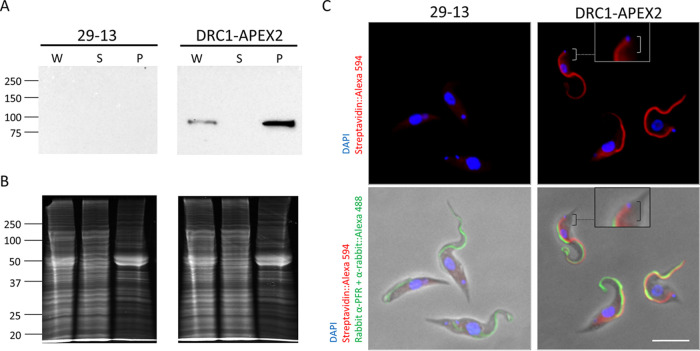
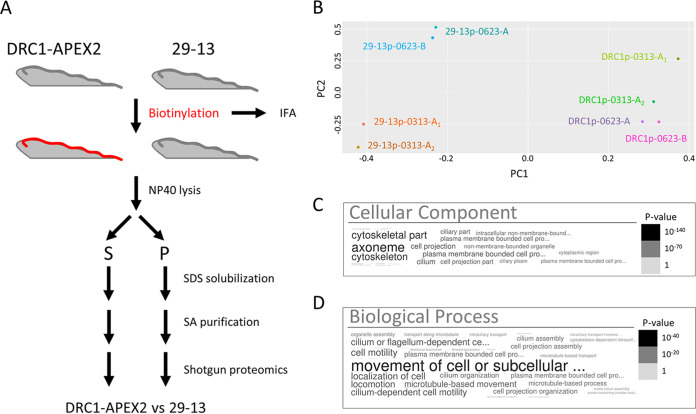
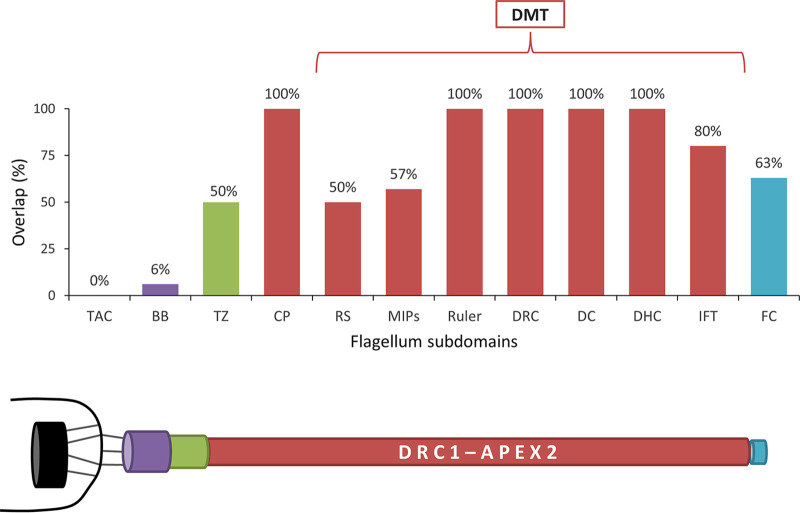
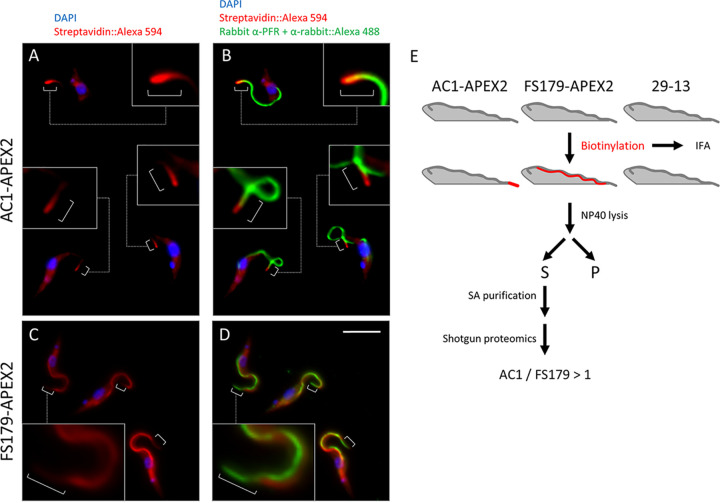
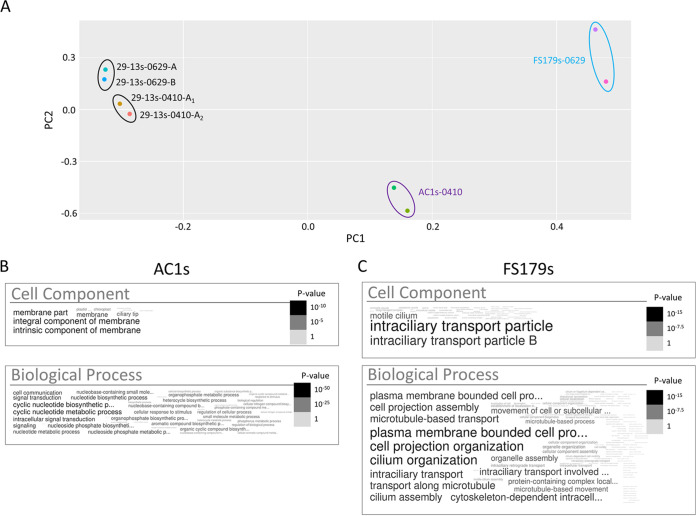
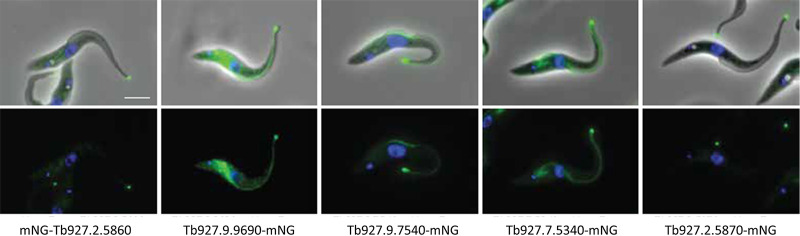
Trypanosoma brucei is the protozoan parasite responsible for sleeping sickness, a lethal vector-borne disease. T. brucei has a single flagellum (cilium) that plays critical roles in transmission and pathogenesis. An emerging concept is that the flagellum is organized into subdomains, each having specialized composition and function. The overall flagellum proteome has been well studied, but a critical knowledge gap is the protein composition of individual subdomains. We have tested whether APEX-based proximity proteomics could be used to examine the protein composition of T. brucei flagellum subdomains. As APEX-based labeling has not previously been described in T. brucei, we first fused APEX2 to the DRC1 subunit of the nexin-dynein regulatory complex, a well-characterized axonemal complex. We found that DRC1-APEX2 directs flagellum-specific biotinylation, and purification of biotinylated proteins yields a DRC1 "proximity proteome" having good overlap with published proteomes obtained from purified axonemes. Having validated the use of APEX2 in T. brucei, we next attempted to distinguish flagellar subdomains by fusing APEX2 to a flagellar membrane protein that is restricted to the flagellum tip, AC1, and another one that is excluded from the tip, FS179. Fluorescence microscopy demonstrated subdomain-specific biotinylation, and principal-component analysis showed distinct profiles between AC1-APEX2 and FS179-APEX2. Comparing these two profiles allowed us to identify an AC1 proximity proteome that is enriched for tip proteins, including proteins involved in signaling. Our results demonstrate that APEX2-based proximity proteomics is effective in T. brucei and can be used to resolve the proteome composition of flagellum subdomains that cannot themselves be readily purified.IMPORTANCE Sleeping sickness is a neglected tropical disease caused by the protozoan parasite Trypanosoma brucei The disease disrupts the sleep-wake cycle, leading to coma and death if left untreated. T. brucei motility, transmission, and virulence depend on its flagellum (cilium), which consists of several different specialized subdomains. Given the essential and multifunctional role of the T. brucei flagellum, there is need for approaches that enable proteomic analysis of individual subdomains. Our work establishes that APEX2 proximity labeling can, indeed, be implemented in the biochemical environment of T. brucei and has allowed identification of proximity proteomes for different flagellar subdomains that cannot be purified. This capacity opens the possibility to study the composition and function of other compartments. We expect this approach may be extended to other eukaryotic pathogens and will enhance the utility of T. brucei as a model organism to study ciliopathies, heritable human diseases in which cilium function is impaired.

Keywords: Trypanosoma; cell signaling; flagella.


Figures

FIG 1
FIG 1
Schematic diagram of major flagellum substructures in T. brucei. Schematic depicts emergence of the flagellum from the basal body near the cell’s posterior end (left), extending to the cell’s anterior end (right). Major substructures are labeled.
FIG 2
FIG 2
APEX2 directs organelle-specific biotinylation in T. brucei. (A) Western blot of whole-cell lysate (W), NP-40-extracted supernatant (S), and pellet (P) samples from 29-13 and DRC1-APEX2-expressing cells. Samples were probed with anti-HA antibody. (B) Samples in panel A were stained with SYPRO Ruby to assess loading. (C) 29-23 and DRC1-APEX2 cells were examined by immunofluorescence with anti-PFR antibody (Alexa 488, green), streptavidin (Alexa 594, red) and DAPI (blue). Boxes show zoomed-in versions of the cells. Brackets point out that streptavidin (Alexa 594, red) extends up to the kinetoplast. Scale bar, 5 μm.
FIG 3
FIG 3
DRC1-APEX2 proximity proteome is enriched for flagellar proteins. (A) Scheme used to identify biotinylated proteins from 29-13 and DRC1-APEX2-expressing T. brucei cells. (B) Principal-component analysis of proteins identified in pellet fractions from 29-13 (29-13p) and DRC1-APEX2 cells (DRC1p). The experiment was performed using three independent biological replicates (0313, 0623-A, and 0623-B), and the 0313 protein sample was split into two aliquots and shotgun proteomics was performed on each in parallel (0313-A1 and 0313-A2). (C and D) Word clouds showing GO analysis of the DRC1p proximity proteome. Size and shading of text reflects the P value according to the scale shown.
FIG 4
FIG 4
Spatial distribution of known flagellar proteins identified in the DRC1p proximity proteome. Bars in the histogram indicate the percentage of known flagellar proteins from each of the indicated complexes that were identified in the DRC1p proximity proteome. DMT, doublet microtubule; TAC, tripartite attachment complex; BB, basal body; TZ, transition zone; CP, central pair; RS, radial spokes; MIPs, microtubule inner proteins; DRC, dynein regulatory complex; DC, docking complex; DHC, dynein heavy chain; IFT, intraflagellar transport; FC, flagella connector. Schematic below the histogram illustrates the relative position of the complexes indicated in the histogram, with the mitochondrion and kinetoplast indicated in black on the left.
FIG 5
FIG 5
APEX2 labeling resolves flagellum subdomains. (A and B) AC1-APEX2 cells were fixed and examined by fluorescence microscopy after staining with anti-PFR antibody (Alexa 488, green), streptavidin (Alexa 594, red), and DAPI (blue). Boxes show zoomed in version of the cells. Brackets point out streptavidin (Alexa 594, red) at the flagellum tip. (C and D) FS179-APEX2 cells were examined by immunofluorescence with anti-PFR antibody (Alexa 488, green), streptavidin (Alexa 594, red) and DAPI (blue). White brackets indicate the distal region of the flagellum that is not labeled by streptavidin. Boxes show zoomed in versions of the cells. Brackets indicate that streptavidin (Alexa 594, red) is excluded from the flagellum tip. Scale bar, 5 μm. (E) Scheme used to identify biotinylated proteins from the indicated cell lines (29-13, AC1-APEX2, and FS179-APEX2).
FIG 6
FIG 6
APEX2 proximity proteomics differentiates protein compositions of flagellum subdomains. (A) Principal-component analysis of proteins identified in supernatant fractions from 29-13 (29-13s), AC1-APEX2 (AC1s), and FS179-APEX2 (FS179s) cells. For parental cell line controls (29-13), three independent experiments are shown (0410, 0629-A, and 0629-B), and for one experiment, the sample was split into two aliquots (0410-A1 and 0410-A2) that were subjected to shotgun proteomics in parallel. For FS179s, two independent experiments are shown (0629-A and 0629-B). For AC1s, one sample was split into two aliquots that were subjected to shotgun proteomics in parallel (0410-A1 and 0410-A2). (B) Word cloud representing GO analysis for cellular components and biological processes of the proteins identified in the AC1s proximity proteome. (C) Word cloud representing GO analysis for cellular components and biological processes of the proteins identified in the FS179s proximity proteome.
FIG 7
FIG 7
AC1s proximity proteome identifies tip proteins. Fluorescence microscopy of trypanosomes expressing the indicated protein tagged with mNeonGreen (green). Samples are stained with Hoechst 33342 (blue). Top panel shows fluorescence plus phase contrast merged images. Bottom panel shows fluorescence image. Scale bar, 5 μm.

References

    1. Stuart K, Brun R, Croft S, Fairlamb A, Gurtler RE, McKerrow J, Reed S, Tarleton R. 2008. Kinetoplastids: related protozoan pathogens, different diseases. J Clin Invest 118:1301–1310. doi:10.1172/JCI33945. - DOI - PMC - PubMed
    1. FAO. 2019. Controling tsetse and trypanosomosis to protect African livestock keepers, public health and farmers' livelihoods. FAO, Rome, Italy.
    1. Langousis G, Hill KL. 2014. Motility and more: the flagellum of Trypanosoma brucei. Nat Rev Microbiol 12:505–518. doi:10.1038/nrmicro3274. - DOI - PMC - PubMed
    1. Shimogawa MM, Ray SS, Kisalu N, Zhang Y, Geng Q, Ozcan A, Hill KL. 2018. Parasite motility is critical for virulence of African trypanosomes. Sci Rep 8:9122. doi:10.1038/s41598-018-27228-0. - DOI - PMC - PubMed
    1. Rotureau B, Ooi CP, Huet D, Perrot S, Bastin P. 2014. Forward motility is essential for trypanosome infection in the tsetse fly. Cell Microbiol 16:425–433. doi:10.1111/cmi.12230. - DOI - PubMed

Publication types

MeSH terms