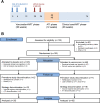
A Randomized Placebo-Controlled Efficacy Study of a Prime Boost Therapeutic Vaccination Strategy in HIV-1-Infected Individuals: VRI02 ANRS 149 LIGHT Phase II Trial
- PMID: 33568510
- PMCID: PMC8104102
- DOI: 10.1128/JVI.02165-20
A Randomized Placebo-Controlled Efficacy Study of a Prime Boost Therapeutic Vaccination Strategy in HIV-1-Infected Individuals: VRI02 ANRS 149 LIGHT Phase II Trial
Abstract
In this placebo-controlled phase II randomized clinical trial, 103 human immunodeficiency virus type 1 (HIV-1)-infected patients under cART (combined antiretroviral treatment) were randomized 2:1 to receive either 3 doses of DNA GTU-MultiHIV B (coding for Rev, Nef, Tat, Gag, and gp160) at week 0 (W0), W4, and W12, followed by 2 doses of LIPO-5 vaccine containing long peptides from Gag, Pol, and Nef at W20 and W24, or placebo. Analytical treatment interruption (ATI) was performed between W36 to W48. At W28, vaccinees experienced an increase in functional CD4+ T-cell responses (P < 0.001 for each cytokine compared to W0) measured, predominantly against Gag and Pol/Env, and an increase in HIV-specific CD8+ T cells producing interleukin 2 (IL-2) and tumor necrosis factor alpha (TNF-α) (P = 0.001 and 0.013, respectively), predominantly against Pol/Env and Nef. However, analysis of T-cell subsets by mass cytometry in a subpopulation showed an increase in the W28/W0 ratio for memory CD8+ T cells coexpressing exhaustion and senescence markers such as PD-1/TIGIT (P = 0.004) and CD27/CD57 (P = 0.044) in vaccinees compared to the placebo group. During ATI, all patients experienced viral rebound, with the maximum observed HIV RNA level at W42 (median, 4.63 log10 copies [cp]/ml; interquartile range [IQR], 4.00 to 5.09), without any difference between arms. No patient resumed cART for CD4 cell count drop. Globally, the vaccine strategy was safe. However, a secondary HIV transmission during ATI was observed. These data show that the prime-boost combination of DNA and LIPO-5 vaccines elicited broad and polyfunctional T cells. The contrast between the quality of immune responses and the lack of potent viral control underscores the need for combined immunomodulatory strategies. (This study has been registered at ClinicalTrials.gov under registration no. NCT01492985.)IMPORTANCE In this placebo-controlled phase II randomized clinical trial, we evaluated the safety and immunogenicity of a therapeutic prime-boost vaccine strategy using a recombinant DNA vaccine (GTU-MultiHIV B clade) followed by a boost vaccination with a lipopeptide vaccine (HIV-LIPO-5) in HIV-infected patients on combined antiretroviral therapy. We show here that this prime-boost strategy is well tolerated, consistently with previous studies in HIV-1-infected individuals and healthy volunteers who received each vaccine component individually. Compared to the placebo group, vaccinees elicited strong and polyfunctional HIV-specific CD4+ and CD8+ T-cell responses. However, these immune responses presented some qualitative defects and were not able to control viremia following antiretroviral treatment interruption, as no difference in HIV viral rebound was observed in the vaccine and placebo groups. Several lessons were learned from these results, pointing out the urgent need to combine vaccine strategies with other immune-based interventions.
Keywords: HIV; antiretroviral therapy interruption; clinical trials; human immunodeficiency virus; therapeutic vaccine.
Copyright © 2021 Lévy et al.
Figures


Similar articles
-
HIV-1 Reservoir Dynamics after Vaccination and Antiretroviral Therapy Interruption Are Associated with Dendritic Cell Vaccine-Induced T Cell Responses.J Virol. 2015 Sep;89(18):9189-99. doi: 10.1128/JVI.01062-15. Epub 2015 Jun 24. J Virol. 2015. PMID: 26109727 Free PMC article. Clinical Trial.
-
DNA Priming Increases Frequency of T-Cell Responses to a Vesicular Stomatitis Virus HIV Vaccine with Specific Enhancement of CD8+ T-Cell Responses by Interleukin-12 Plasmid DNA.Clin Vaccine Immunol. 2017 Nov 6;24(11):e00263-17. doi: 10.1128/CVI.00263-17. Print 2017 Nov. Clin Vaccine Immunol. 2017. PMID: 28931520 Free PMC article. Clinical Trial.
-
HIV-Tat immunization induces cross-clade neutralizing antibodies and CD4(+) T cell increases in antiretroviral-treated South African volunteers: a randomized phase II clinical trial.Retrovirology. 2016 Jun 9;13(1):34. doi: 10.1186/s12977-016-0261-1. Retrovirology. 2016. PMID: 27277839 Free PMC article. Clinical Trial.
-
HIV vaccines in infants and children.Paediatr Drugs. 2005;7(5):267-76. doi: 10.2165/00148581-200507050-00001. Paediatr Drugs. 2005. PMID: 16220994 Review.
-
Aiming for protective T-cell responses: a focus on the first generation conserved-region HIVconsv vaccines in preventive and therapeutic clinical trials.Expert Rev Vaccines. 2019 Oct;18(10):1029-1041. doi: 10.1080/14760584.2019.1675518. Epub 2019 Oct 15. Expert Rev Vaccines. 2019. PMID: 31613649 Review.
Cited by
-
A Palmitic Acid-Conjugated, Peptide-Based pan-CoV Fusion Inhibitor Potently Inhibits Infection of SARS-CoV-2 Omicron and Other Variants of Concern.Viruses. 2022 Mar 6;14(3):549. doi: 10.3390/v14030549. Viruses. 2022. PMID: 35336956 Free PMC article.
-
Current progress in the development of prophylactic and therapeutic vaccines.Sci China Life Sci. 2023 Apr;66(4):679-710. doi: 10.1007/s11427-022-2230-4. Epub 2022 Dec 2. Sci China Life Sci. 2023. PMID: 36469218 Free PMC article. Review.
-
A novel and safe SmartCap® SC101 to develop the COVID-19 mRNA vaccine STP2104 inducing potent immune responses in humans.Front Immunol. 2025 Jun 16;16:1571092. doi: 10.3389/fimmu.2025.1571092. eCollection 2025. Front Immunol. 2025. PMID: 40589754 Free PMC article. Clinical Trial.
References
-
- Vardas E, Stanescu I, Leinonen M, Ellefsen K, Pantaleo G, Valtavaara M, Ustav M, Reijonen K. 2012. Indicators of therapeutic effect in FIT-06, a phase II trial of a DNA vaccine, GTU®-Multi-HIVB, in untreated HIV-1 infected subjects. Vaccine 30:4046–4054. 10.1016/j.vaccine.2012.04.007. - DOI - PubMed
Publication types
MeSH terms
Substances
Associated data
LinkOut - more resources
Full Text Sources
Other Literature Sources
Medical
Research Materials
Miscellaneous

