. 2021 Feb 10;13(580):eaaw0682.
doi: 10.1126/scitranslmed.aaw0682.

Human neurons from Christianson syndrome iPSCs reveal mutation-specific responses to rescue strategies

Affiliations

Human neurons from Christianson syndrome iPSCs reveal mutation-specific responses to rescue strategies

Sofia B Lizarraga et al. Sci Transl Med. .

Abstract

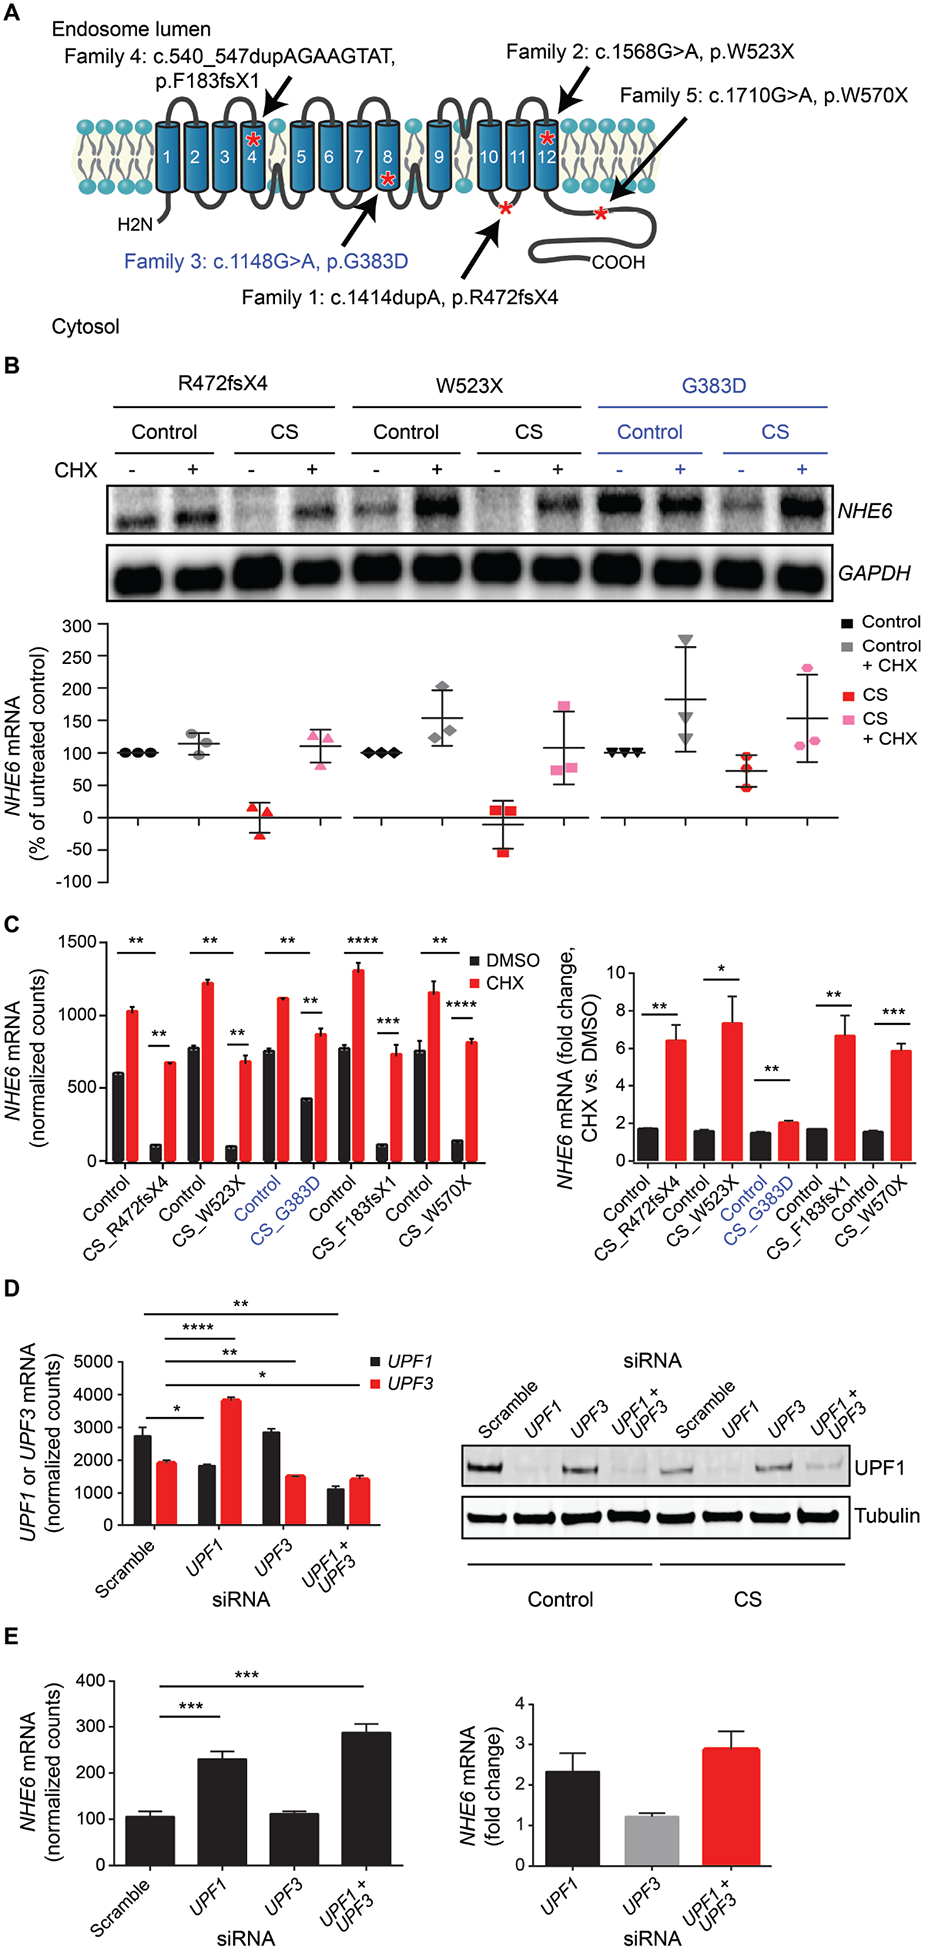
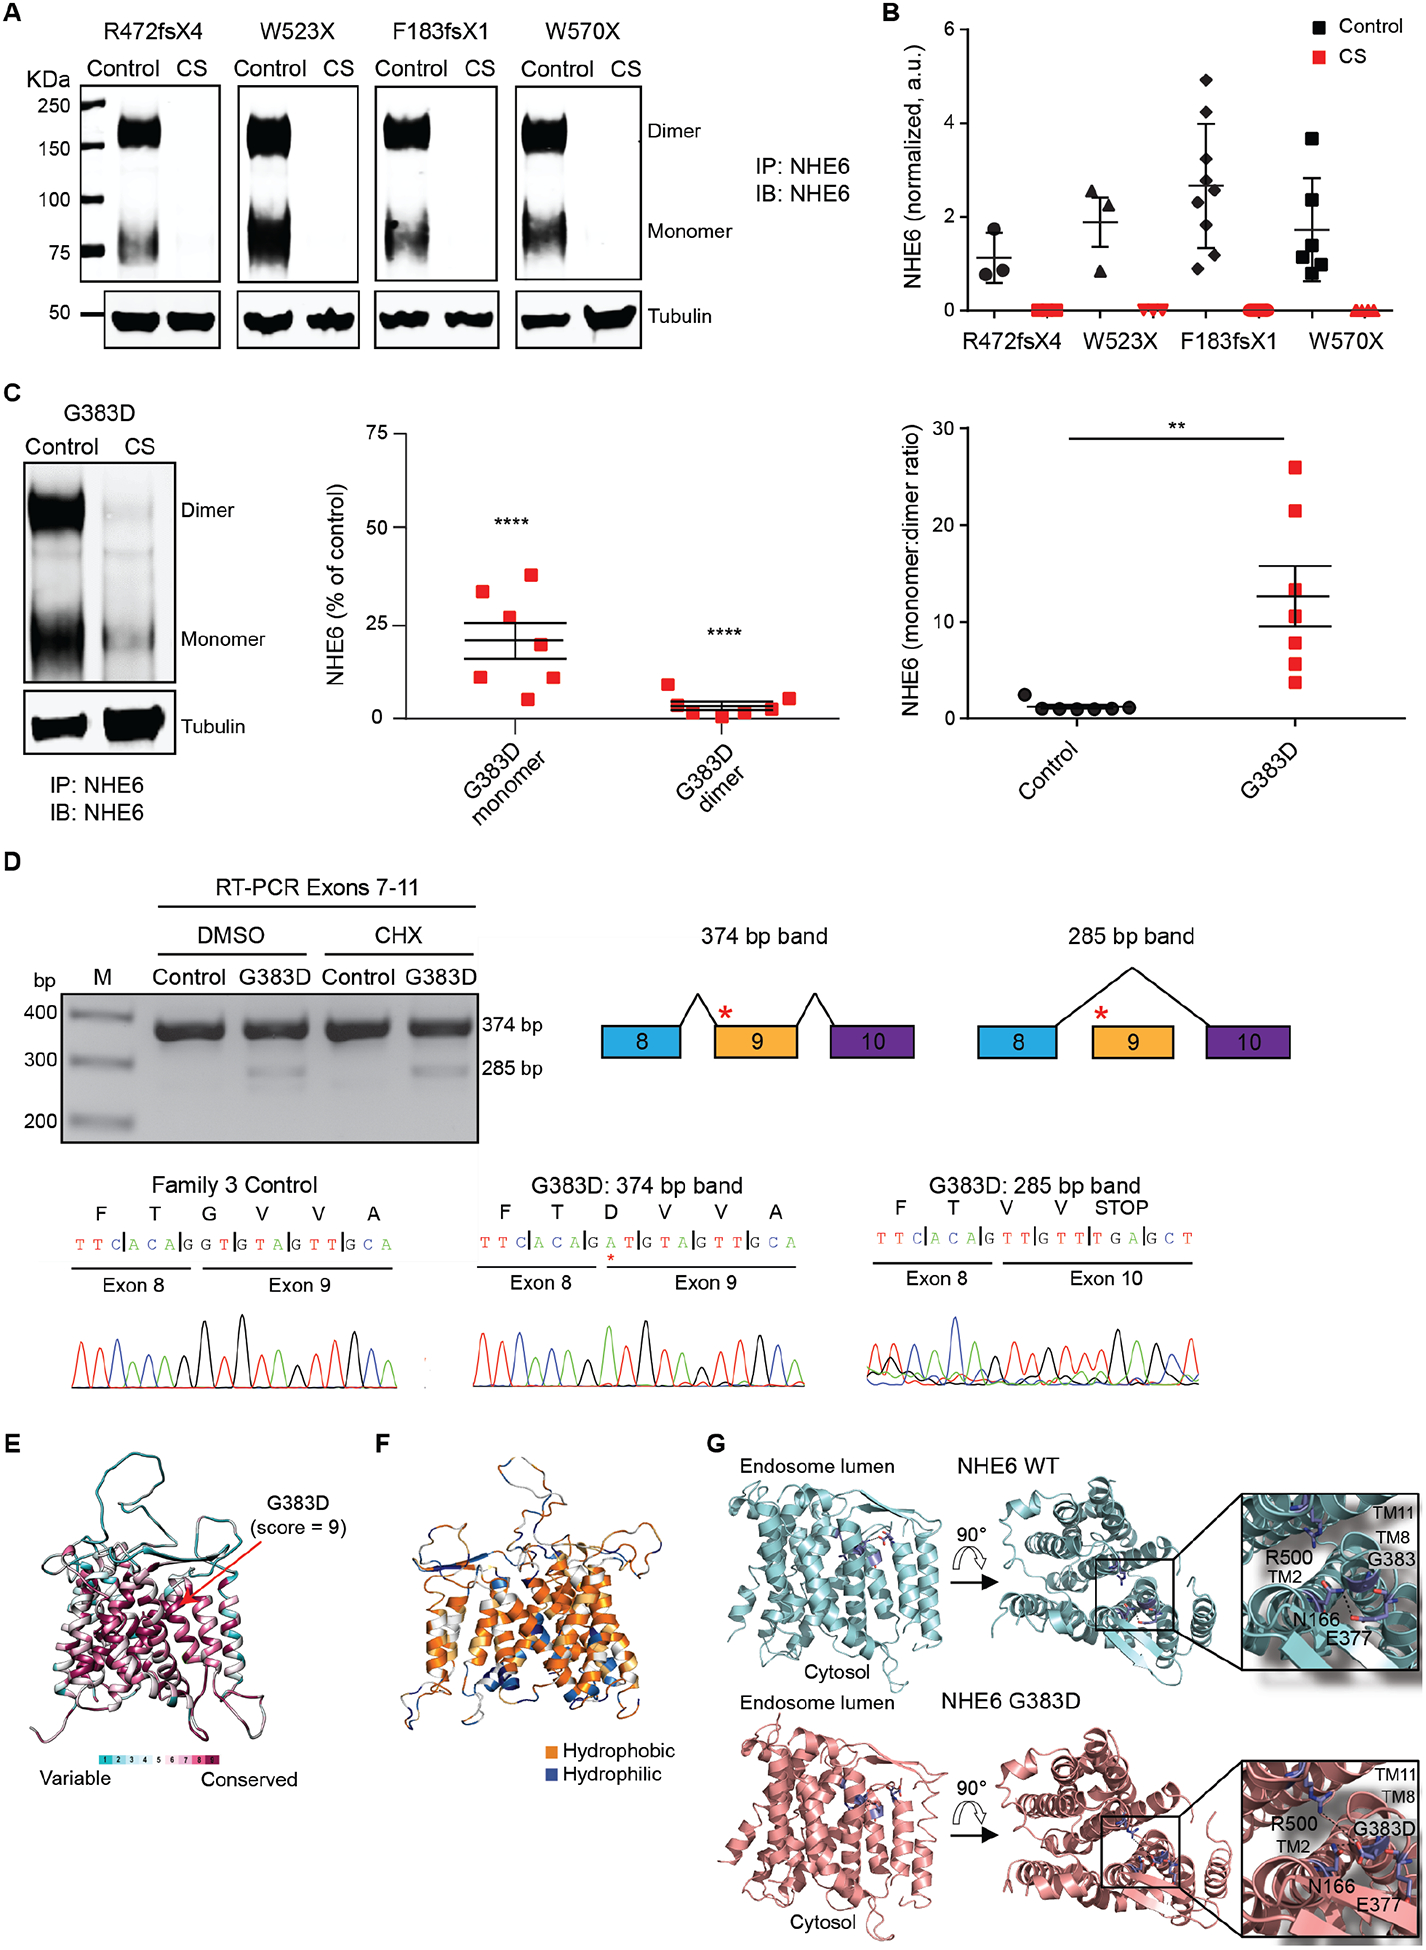
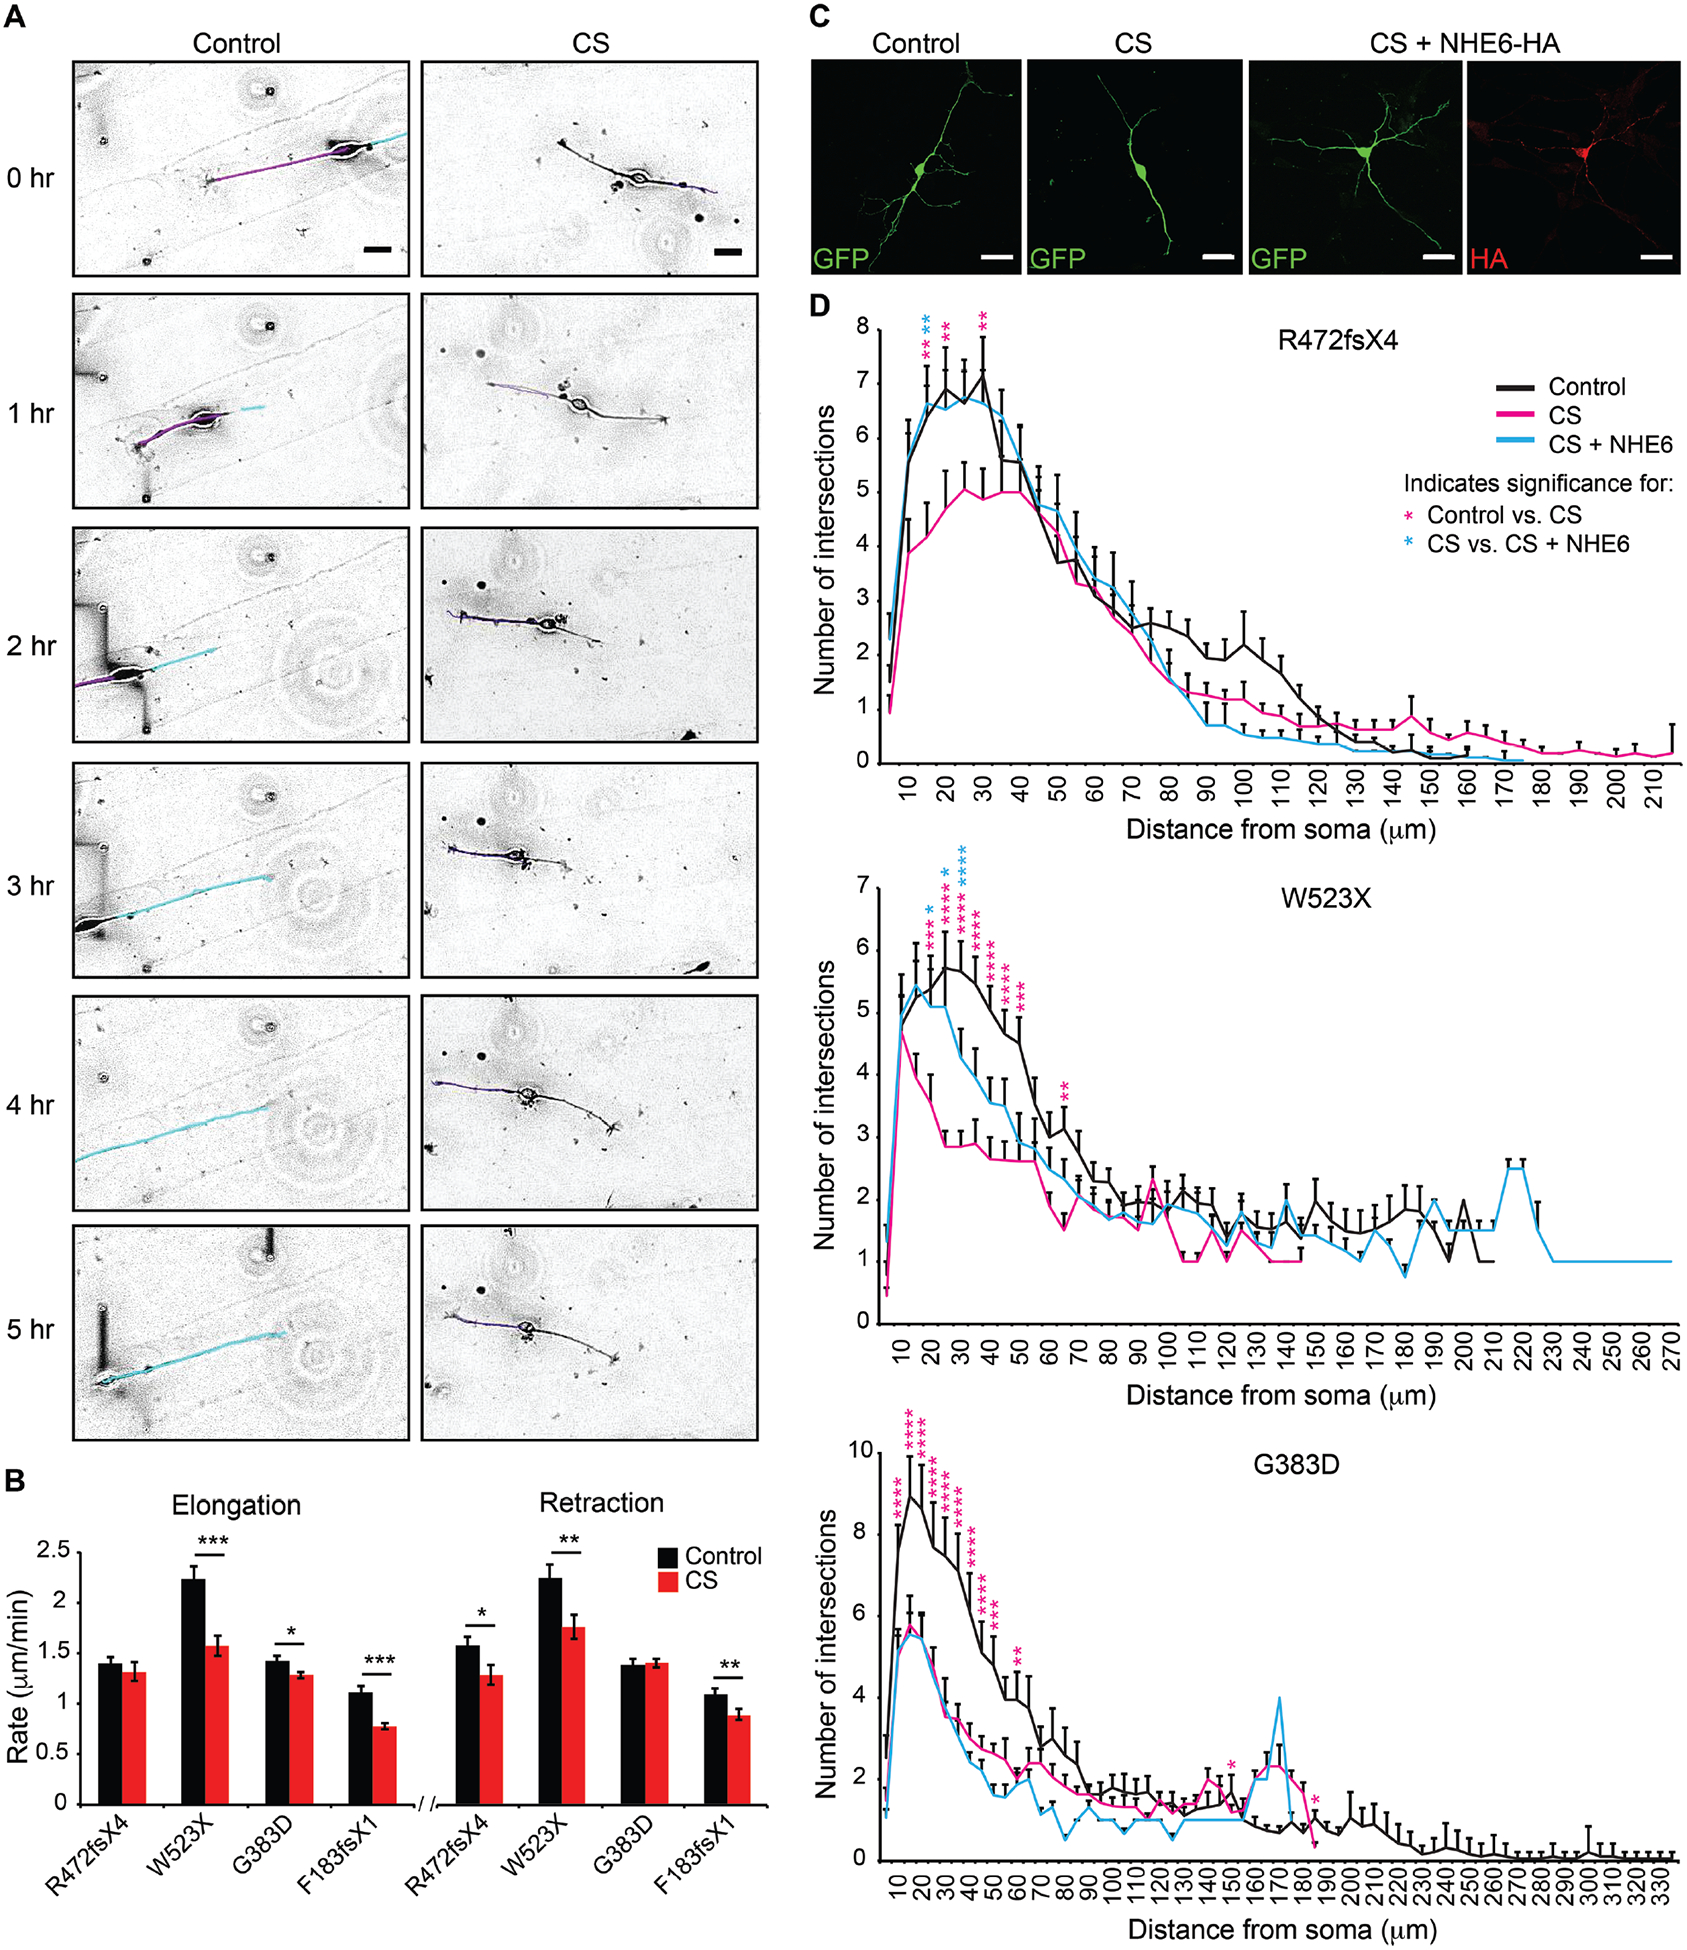
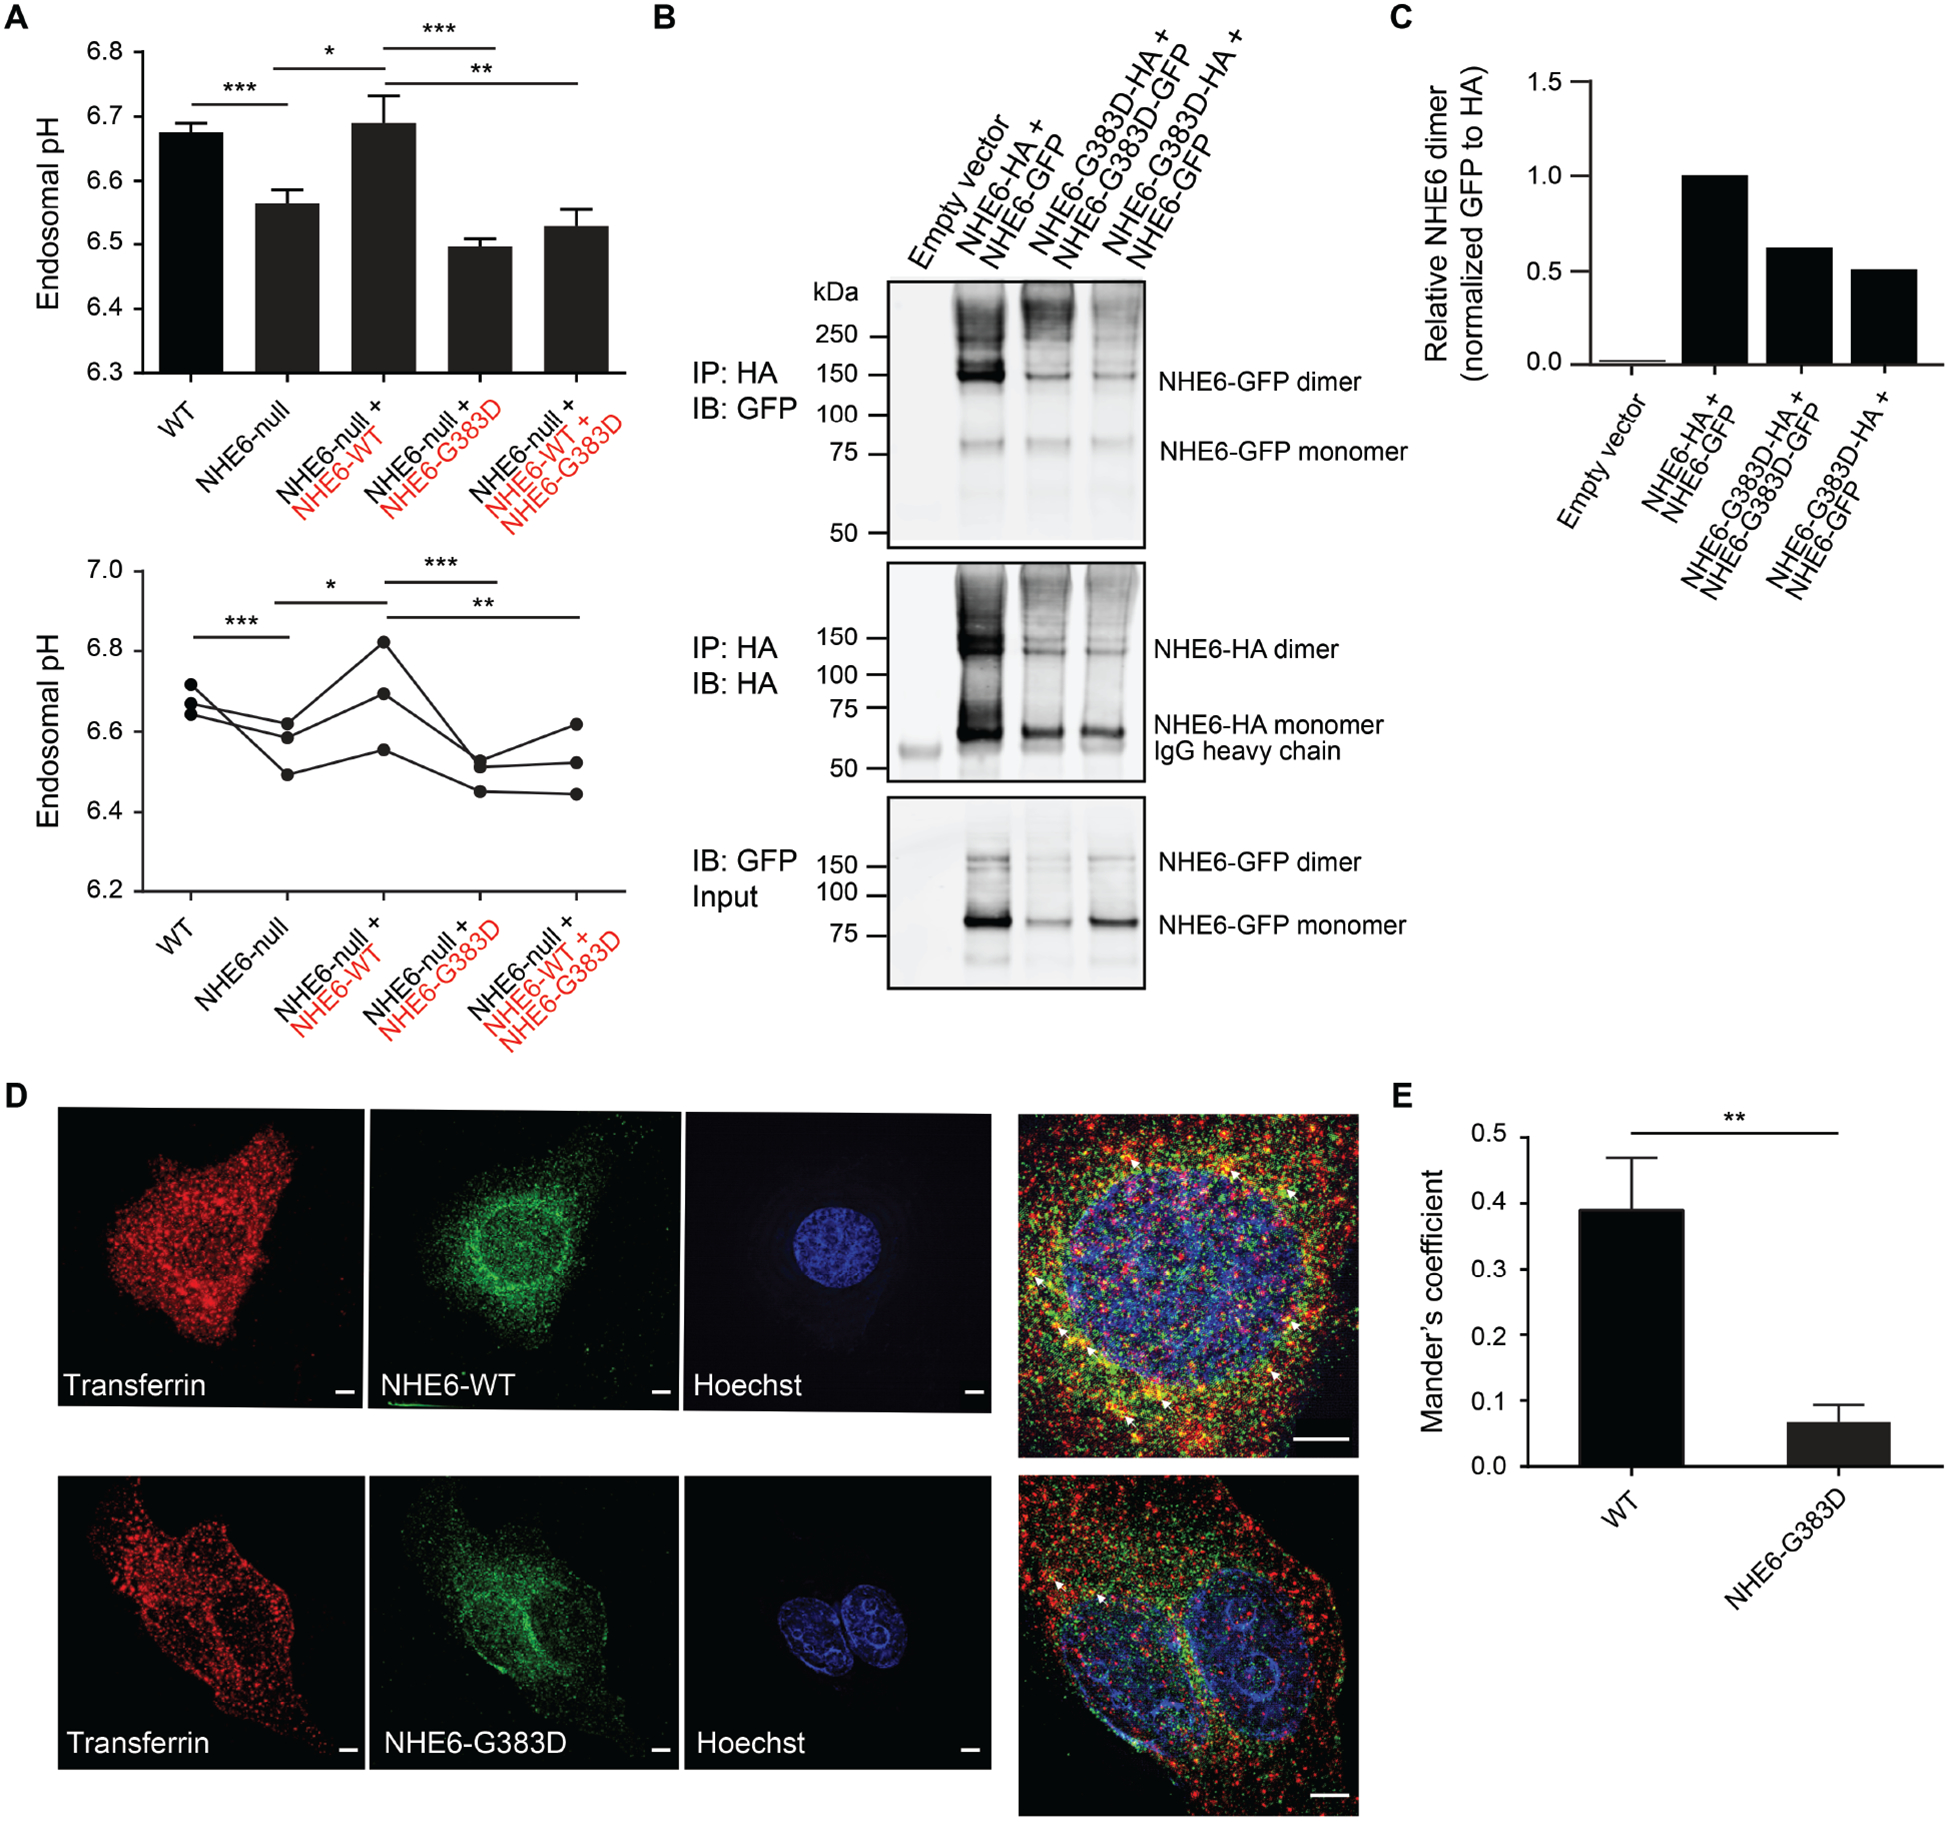
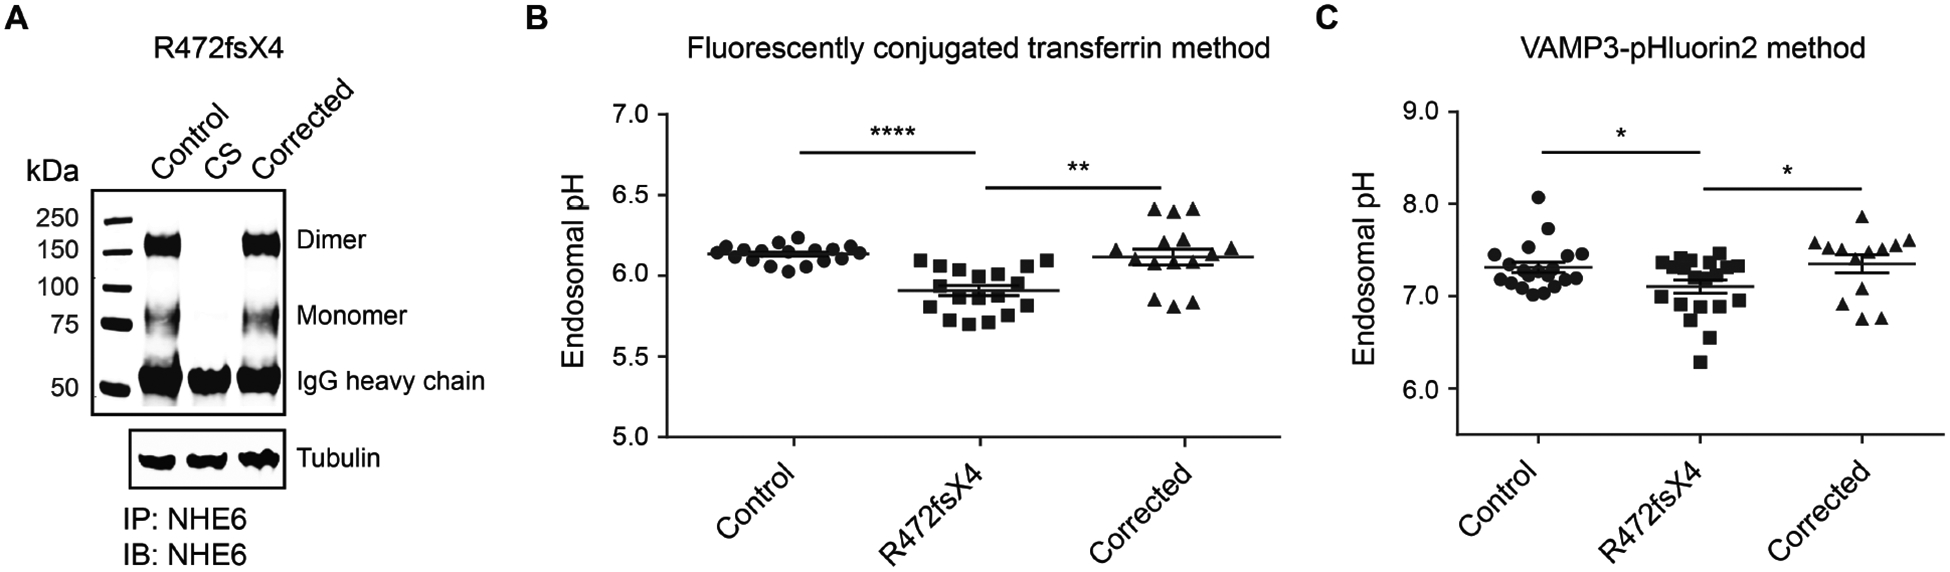
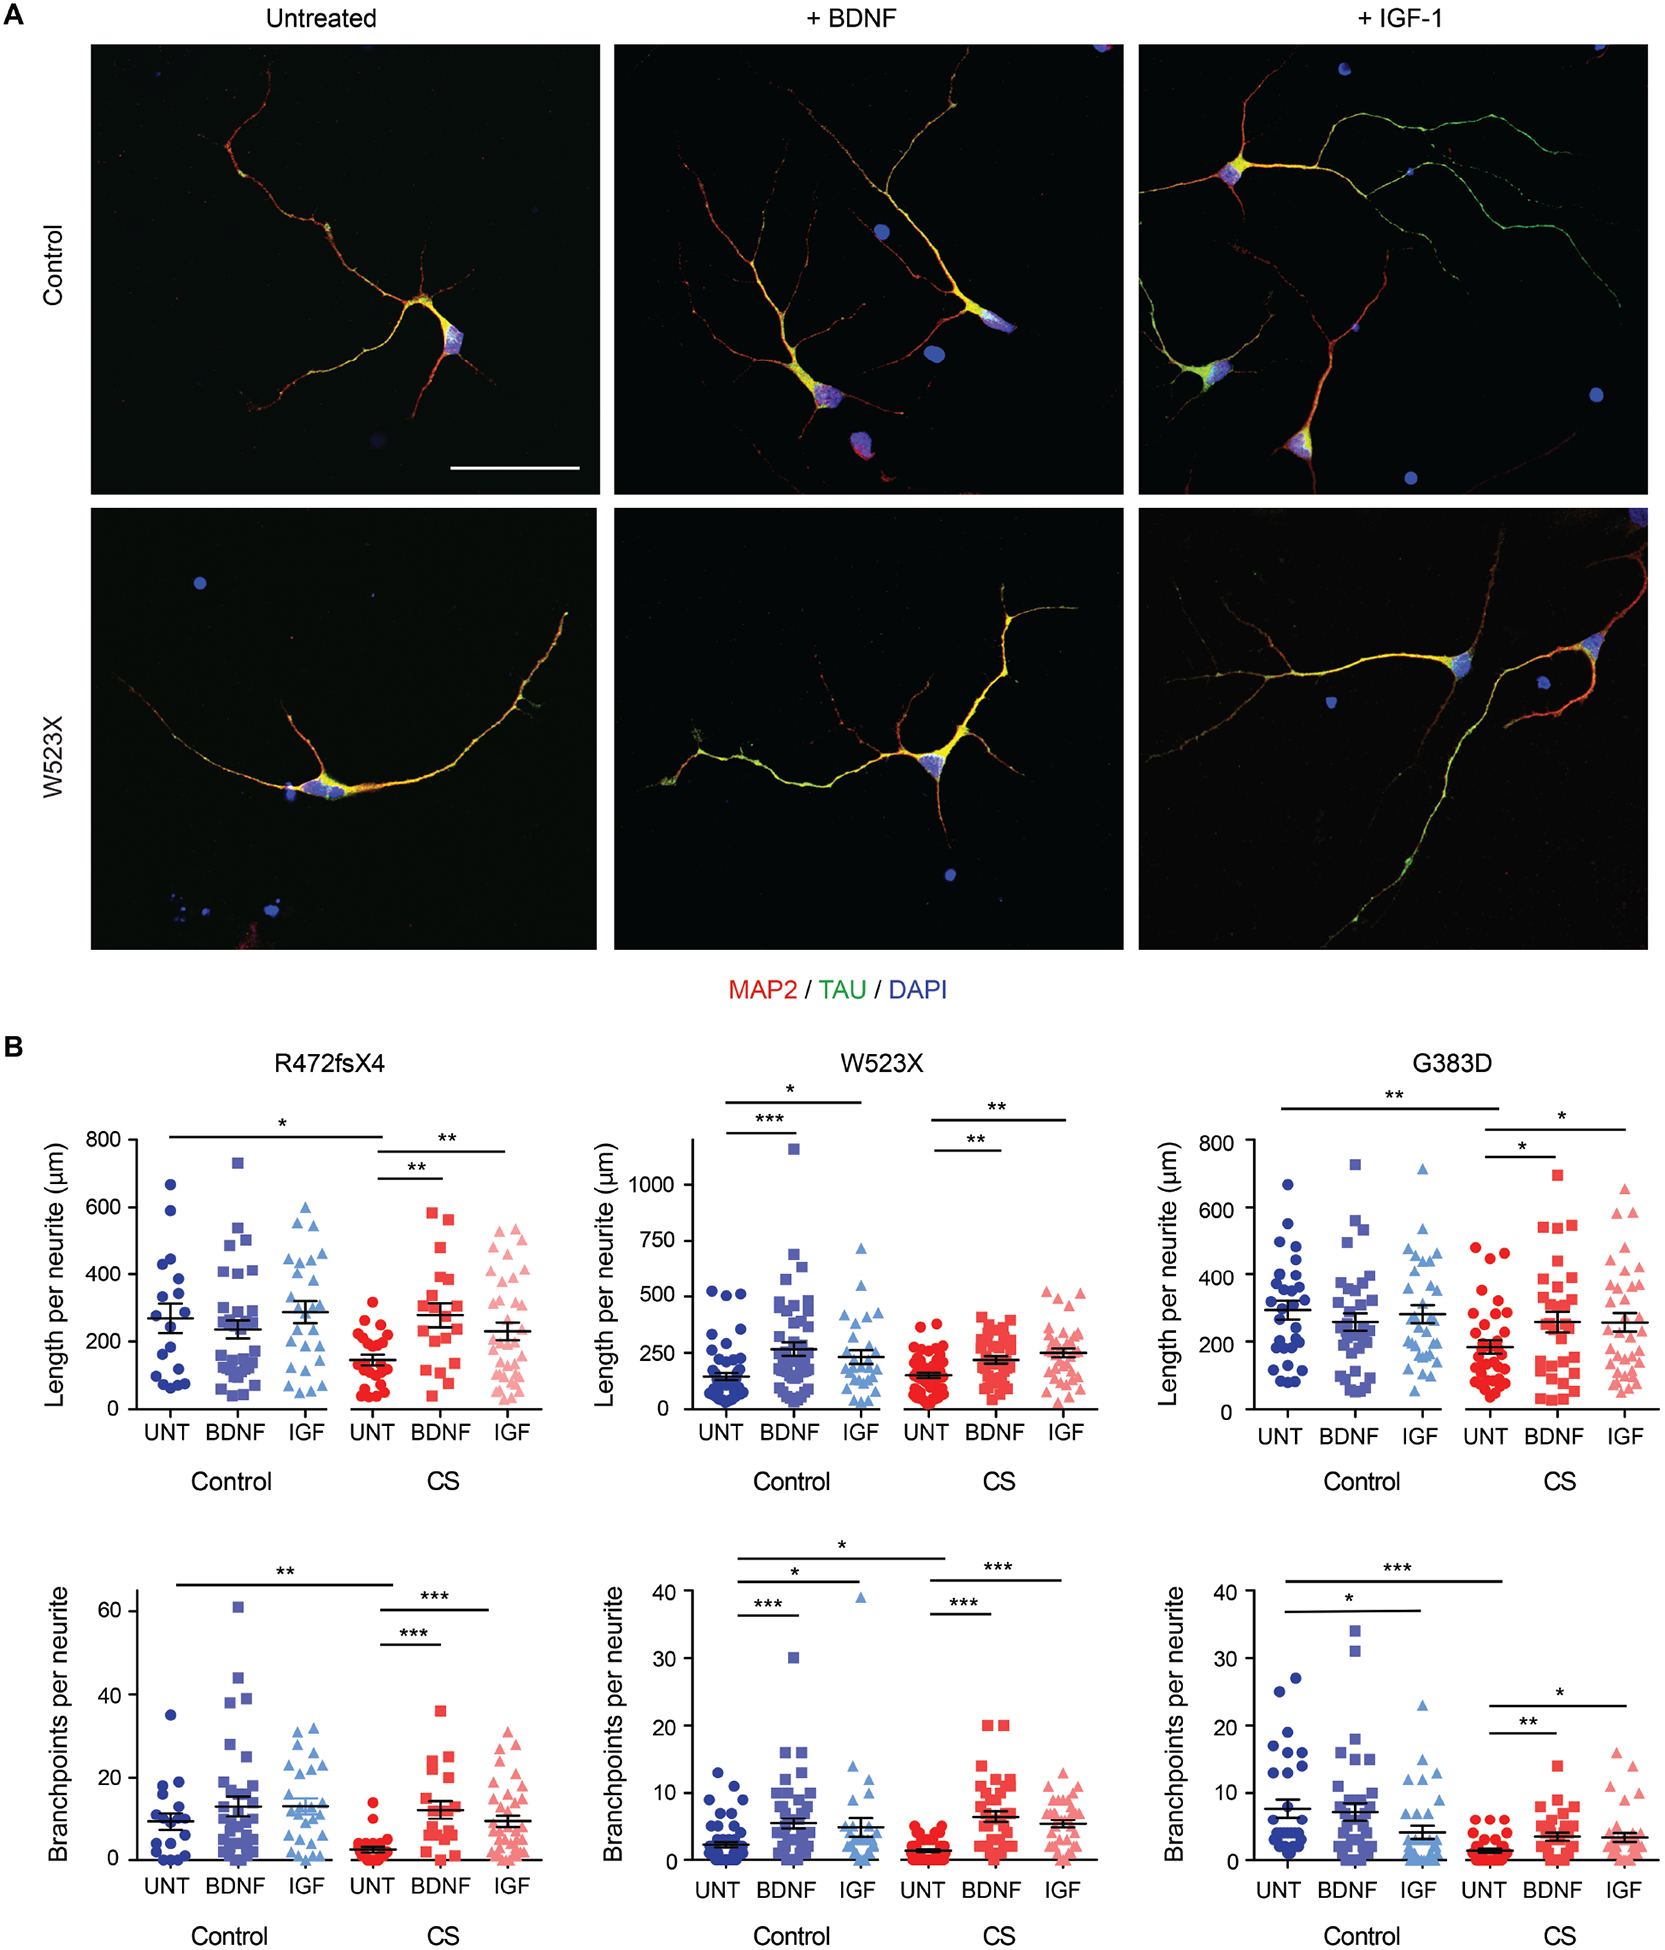
Christianson syndrome (CS), an X-linked neurological disorder characterized by postnatal attenuation of brain growth (postnatal microcephaly), is caused by mutations in SLC9A6, the gene encoding endosomal Na+/H+ exchanger 6 (NHE6). To hasten treatment development, we established induced pluripotent stem cell (iPSC) lines from patients with CS representing a mutational spectrum, as well as biologically related and isogenic control lines. We demonstrated that pathogenic mutations lead to loss of protein function by a variety of mechanisms: The majority of mutations caused loss of mRNA due to nonsense-mediated mRNA decay; however, a recurrent, missense mutation (the G383D mutation) had both loss-of-function and dominant-negative activities. Regardless of mutation, all patient-derived neurons demonstrated reduced neurite growth and arborization, likely underlying diminished postnatal brain growth in patients. Phenotype rescue strategies showed mutation-specific responses: A gene transfer strategy was effective in nonsense mutations, but not in the G383D mutation, wherein residual protein appeared to interfere with rescue. In contrast, application of exogenous trophic factors (BDNF or IGF-1) rescued arborization phenotypes across all mutations. These results may guide treatment development in CS, including gene therapy strategies wherein our data suggest that response to treatment may be dictated by the class of mutation.


Figures

Fig. 1.
Fig. 1.. Analysis of NHE6 gene expression in iPSCs from patients with NHE6 mutations and from related controls.
(A) iPSCs were derived from five patients with CS and from their genetically related, unaffected brothers without NHE6 mutation as controls. Shown is a schematic of the NHE6 protein with the predicted locations of the proband mutations, based on NHE6 transcript NM_001042537. NHE6 TM were predicted by the transmembrane hidden Markov model (TMHMM) (30) for Ensembl transcript ENST00000370695 and protein ENSP00000359729 (31). (B) NHE6 mRNA expression in control and CS iPSCs was quantified based on northern blots. Northern blotting was performed using samples from CS and control iPSCs treated (+) or untreated (−) with CHX. Expression of NHE6 mRNA was normalized to GAPDH and plotted as a percentage of untreated control cells. n = 3 experiments. (See fig. S11 for northern blots of Families 4 and 5, and data file S7 for mRNA expression quantification data.) (C) NHE6 mRNA expression in control and CS iPSCs was quantified based on NanoString data. RNA samples collected from CS and paired control iPSCs treated (+) or untreated (−) with CHX were analyzed using a customized NanoString platform. Expression of NHE6 mRNA was normalized to hybridization controls and to a set of housekeeping genes: B2M, GAPDH, GUSB, HPRT1, RPL13a, RPL27, POLR2A (left panel). Fold change in NHE6 mRNA expression, in the presence or absence of CHX treatment, was quantified for each CS and paired control iPSC (right panel). n = 15 samples per group (3 replicate wells from each of 5 control lines with or without CHX treatment and 3 replicate wells from each of 5 CS lines with or without CHX treatment). (D) UPF1 and UPF3 mRNA expression in CS iPSCs from Family 1 treated with a control set of scrambled siRNA oligonucleotides or siRNA oligonucleotides targeting UPF genes was quantified. Following siRNA treatment, expression of UPF1 and UPF3 mRNA was determined using a customized NanoString platform (left panel). Western blotting was performed using antibodies against UPF1 (top) to test for knockdown of UPF1 and against tubulin (bottom) as a loading control (right panel). Shown is a representative blot using control and CS samples from Family 2. (E) NHE6 mRNA expression in CS iPSCs from Family 1 treated with a control set of scrambled siRNA oligonucleotides or siRNA oligonucleotides targeting UPF genes was quantified. Following siRNA treatment, expression of NHE6 mRNA was determined using a customized NanoString platform (left panel). NHE6 mRNA was normalized to hybridization controls and to a set of housekeeping genes: B2M, GAPDH, HPRT1, RPL13a, POLR2A. Fold change in NHE6 mRNA expression after knockdown of UPF1, UPF3, or UPF1 + UPF3 was quantified. Shown are results for samples from Family 1 CS iPSCs (right panel). n = 4 replicates. Data represent means ± SEM. Unpaired Student’s t tests were used. * P < 0.05, ** P < 0.01, *** P < 0.001, **** P < 0.0001.
Fig. 2.
Fig. 2.. Analysis of protein expression of pathogenic NHE6 mutations and additional study of the complex alternative splicing and missense mutation G383D.
(A) Western blotting was performed to determine NHE6 protein expression in control and CS iPSCs. Lysates of CS and paired control iPSCs from Families 1, 2, 4, and 5 were immunoprecipitated using a custom-made anti-NHE6 antibody and subsequently analyzed by western blot using the same antibody. Blotting against tubulin was used as a loading control. (B) NHE6 protein expression, based on western blots such as those presented in (A), was quantified. The signal from immunoprecipitated NHE6 was normalized to the respective signal from tubulin and the average signal intensity for the control of Family 1 was set to a value of 1. n ≥ 3 experiments. (C) Western blotting was performed to determine NHE6 protein expression specifically in control and CS iPSCs from Family 3 (left panel). Samples were prepared and analyzed as described for panel (A). Amounts of NHE6 protein monomer and dimer in CS and paired control samples from Family 3 were quantified and the monomer:dimer ratios determined (middle and right panels). The signal from immunoprecipitated NHE6 was normalized to the respective signal from tubulin; the data are plotted as a percent of control. n = 7 experiments. (D) The G383D mutation generates an alternative transcript by exon skipping. RT-PCR was performed on cDNA collected from iPSCs treated or untreated with CHX. The resulting bands were sequenced and revealed the presence of an alternative splicing event in which exon 9 was skipped. The red asterisk in the diagram indicates the approximate location of the c.1148G>A/p.G383D mutation. (E) Conservation of NHE6 protein was analyzed using ConSurf. Shown are variable and conserved regions (turquoise through maroon) mapped onto the NHE6 structural model. (F) Hydrophobicity analysis of the NHE6 structural model was performed. Hydrophobic (orange) residues are located in TM, whereas hydrophilic (blue) residues are located in loop regions. (G) The protein structure of wild-type (WT) and G383D-mutant NHE6 was modeled. The model of NHE6 predicts that the G383D mutation disrupts helix packing between TM8 and TM2, possibly due to hydrogen bonding of D383 with N166 and loss of an interaction between N166 and E377 (insets, dotted lines). Alternatively, the G383D variant could form a salt-bridge with R500 on TM11 (lower inset, dotted line). Data represent means ± SEM. Unpaired Student’s t tests were used (B and C). ** P < 0.01, **** P < 0.0001.
Fig. 3.
Fig. 3.. Rescue of deficits in neuronal arborization by re-expression of NHE6 in CS lines with frameshift or nonsense mutations but not in the CS missense mutation line.
(A) Neurite outgrowth dynamics were monitored in iPSC-derived neurons. Time-lapse images of iPSC-derived neurons plated on laminin-striped coverslips were acquired using Volocity software at four XY positions every 5 min for 12 hr. Representative images are shown from the CS and paired control lines for Family 3, G383D. Tracings of neurites are shown in purple and cyan for the control line to demonstrate tracking of different neurites. Scale bars, 20 μm. (B) The rates of neurite elongation and retraction were measured using ImageJ software for the first 2 hr. Control Family 1: n = 17 cells/ 32 neurites/ 841 measurements; Family 1, R472fsX4: n = 13 cells/ 25 neurites/ 875 measurements; Control Family 2: n = 12 cells/ 15 neurites/ 635 measurements; Family 2, W523X: n = 8 cells/ 9 neurites/ 724 measurements; Control Family 3: n = 28 cells/ 55 neurites/ 827 measurements; Family 3, G383D: n = 52 cells/ 126 neurites/ 2,163 measurements; Control Family 4: n = 8 cells/ 17 neurites/ 622 measurements; and Family 4, F183fsX1: n = 9 cells/ 13 neurites/ 708 measurements. (C) Representative images reflective of each condition of gene transfection experiments are shown from Family 1, R472fsX4. iPSC-derived neurons were transfected with a construct encoding for GFP alone or with two constructs together encoding for GFP + full-length human NHE6-HA and analyzed after 5 days. Scale bars, 20 μm. (D) Sholl analysis of control iPSC-derived neurons (black lines), CS iPSC-derived neurons (magenta lines), and CS iPSC-derived neurons transfected with a construct encoding for NHE6-HA (cyan lines) was performed. The average number of neurite intersections with Sholl radii was plotted as a function of distance from the soma for each condition. n = 20–25 cells per condition. Data represent means ± SEM. Welch’s t tests (B) and two-way ANOVA followed by Bonferroni correction for multiple comparisons (D) were used. * P < 0.045, ** P < 0.008, *** P < 0.00008 (B). * P < 0.05, ** P < 0.01, *** P < 0.0001, **** P < 0.00001 (D). Magenta asterisks denote significance when comparing CS to control cells. Cyan asterisks denote significance when comparing CS to CS cells transfected with a construct encoding for NHE6-HA.
Fig. 4.
Fig. 4.. Loss-of-function and dominant-negative activity of NHE6 G383D mutation in regulation of intra-endosomal pH, and mislocalization in cells.
(A) The ability of NHE6 G383D-mutant protein to rescue endosomal pH defects in NHE6-null HEK293T cells was determined. Endosomal pH was assayed using a transferrin-based method in which cells were incubated with pH-sensitive and pH-insensitive fluorescent conjugates of transferrin and then analyzed by flow cytometry. Endosomal pH was measured in wild-type HEK293T cells (WT) (black font), HEK293T cells lacking NHE6 by way of gene editing (NHE6-null) (black font), and HEK293T cells lacking NHE6 but expressing mCherry-tagged WT (red font) and/or G383D-mutant NHE6 (red font). Data are presented as a bar graph (top) and as individual data points wherein each dot represents the average of three replicates from one independent experiment (bottom). n = 3 experiments. (B) Lysates from HEK293T cells expressing HA- or GFP-tagged forms of NHE6, as indicated, were immunoprecipitated using an anti-HA antibody and subsequently analyzed by western blot using antibodies against GFP (top panel) and HA (middle panel). Protein input was determined by western blot of lysates that had not undergone immunoprecipitation for HA-tagged protein using an antibody against GFP (bottom panel). (C) The relative amount of immunoprecipitated NHE6 dimer was quantified based on results shown in panel (B). (D) HeLa cells expressing HA-tagged WT or G383D-mutant NHE6 were incubated with Alexa Fluor 568-conjugated transferrin (red) for 10 min and subsequently immunostained for HA (green) and imaged using srSIM. Arrows (white) in the magnified images indicate areas of co-localization between transferrin and NHE6 in endosomes. Scale bars, 5 μm. (E) Co-localization of NHE6 WT protein vs. NHE6 G383D-mutant protein with transferrin was quantified using ImageJ, and a Mander’s coefficient was determined. Data represent means ± SEM. Unpaired Student’s t tests were used. * P < 0.05, ** P < 0.01, *** P < 0.001.
Fig. 5.
Fig. 5.. Correction of endosomal pH defects in genome-edited CS iPSCs.
(A) Western blotting was performed to confirm expression of NHE6 protein in CS iPSCs that had undergone genome editing to correct the R472fsX4 mutation. Lysates of paired control, CS, and genome-corrected iPSCs from Family 1 were immunoprecipitated using a custom-made anti-NHE6 antibody and subsequently analyzed by western blot using the same antibody. Blotting against tubulin was used as a loading control. (B and C) Whether correction of the NHE6 R472fsX4 mutation might rescue endosomal pH defects present in mutant iPSCs was determined. Endosomal pH was assayed using two different ratiometric methods, a transferrin-based method (B) and a VAMP3-pHluorin2-based method (C). For the transferrin-based method, cells were incubated with pH-sensitive and pH-insensitive fluorescent conjugates of transferrin and then analyzed by flow cytometry. For the VAMP3-pHluorin2-based method, cells were transfected with a construct allowing for expression of VAMP3-pHluorin2 and then analyzed by flow cytometry. Endosomal pH was measured in paired control, R472fsX4-mutant, and genome-corrected iPSCs. Data are presented as individual data points wherein each dot represents a technical replicate. n ≥ 3 experiments. Data represent means ± SEM. Unpaired Student’s t tests were used. * P < 0.05, ** P < 0.01, **** P < 0.0001.
Fig. 6.
Fig. 6.. Rescue of deficiencies in neuronal arborization, regardless of mutation type, by BDNF or IGF-1 treatment.
(A) Immunostaining of control and CS iPSC-derived neurons left untreated or treated with BDNF or IGF-1 was performed for MAP2 (red), a marker of dendrites, and TAU (green), a marker of axons. Nuclei were labelled using DAPI (blue). Representative images are shown from the CS and paired control lines for Family 2, W523X. Scale bar, 50 μm. (B) The recovery of deficiencies in neuronal arborization present in CS iPSC-derived neurons by way of growth factor treatment was quantified. Average length (top panels) and number of branchpoints per neurite (bottom panels) were measured using Neurolucida tracing software for control and CS iPSC-derived neurons left untreated (UNT) or treated with BDNF or IGF-1 (IGF). Neurites stained with either MAP2 or TAU were analyzed; no distinction was made between dendrites or axons during measurements. Control Family 1: n = 18 (UNT), 35 (BDNF), 26 (IGF) neurites; Family 1, R472fsX4: n = 24 (UNT),19 (BDNF), 36 (IGF) neurites; Control Family 2: n = 54 (UNT), 48 (BDNF), 28 (IGF) neurites; Family 2, W523X: n = 53 (UNT), 37 (BDNF), 37 (IGF) neurites; Control Family 3: n = 30 (UNT), 35 (BDNF), 32 (IGF) neurites; and Family 3, G383D: n = 32 (UNT), 31 (BDNF), 35 (IGF) neurites. Data represent means ± SEM. Welch’s t tests were used. * P < 0.05, ** P < 0.005, *** P < 0.0005.

References

    1. Christianson AL, Stevenson RE, van der Meyden CH, Pelser J, Theron FW, van Rensburg PL, Chandler M, Schwartz CE, X linked severe mental retardation, craniofacial dysmorphology, epilepsy, ophthalmoplegia, and cerebellar atrophy in a large South African kindred is localised to Xq24-q27. J Med Genet 36, 759–766 (1999). - PMC - PubMed
    1. Pescosolido MF, Stein DM, Schmidt M, El Achkar CM, Sabbagh M, Rogg JM, Tantravahi U, McLean RL, Liu JS, Poduri A, Morrow EM, Genetic and phenotypic diversity of NHE6 mutations in Christianson syndrome. Ann Neurol 76, 581–593 (2014). - PMC - PubMed
    1. Gilfillan GD, Selmer KK, Roxrud I, Smith R, Kyllerman M, Eiklid K, Kroken M, Mattingsdal M, Egeland T, Stenmark H, Sjoholm H, Server A, Samuelsson L, Christianson A, Tarpey P, Whibley A, Stratton MR, Futreal PA, Teague J, Edkins S, Gecz J, Turner G, Raymond FL, Schwartz C, Stevenson RE, Undlien DE, Stromme P, SLC9A6 mutations cause X-linked mental retardation, microcephaly, epilepsy, and ataxia, a phenotype mimicking Angelman syndrome. Am J Hum Genet 82, 1003–1010 (2008). - PMC - PubMed
    1. van Dyck LI, Morrow EM, Genetic control of postnatal human brain growth. Curr Opin Neurol 30, 114–124 (2017). - PMC - PubMed
    1. Barford K, Deppmann C, Winckler B, The neurotrophin receptor signaling endosome: Where trafficking meets signaling. Dev Neurobiol 77, 405–418 (2017). - PMC - PubMed

Publication types

Supplementary concepts