. 2021 Feb 10;13(580):eabc6894.
doi: 10.1126/scitranslmed.abc6894.

Targeted immunotherapy for HER2-low breast cancer with 17p loss

Affiliations

Targeted immunotherapy for HER2-low breast cancer with 17p loss

Yujing Li et al. Sci Transl Med. .

Abstract

The clinical challenge for treating HER2 (human epidermal growth factor receptor 2)-low breast cancer is the paucity of actionable drug targets. HER2-targeted therapy often has poor clinical efficacy for this disease due to the low level of HER2 protein on the cancer cell surface. We analyzed breast cancer genomics in the search for potential drug targets. Heterozygous loss of chromosome 17p is one of the most frequent genomic events in breast cancer, and 17p loss involves a massive deletion of genes including the tumor suppressor TP53 Our analyses revealed that 17p loss leads to global gene expression changes and reduced tumor infiltration and cytotoxicity of T cells, resulting in immune evasion during breast tumor progression. The 17p deletion region also includes POLR2A, a gene encoding the catalytic subunit of RNA polymerase II that is essential for cell survival. Therefore, breast cancer cells with heterozygous loss of 17p are extremely sensitive to the inhibition of POLR2A via a specific small-molecule inhibitor, α-amanitin. Here, we demonstrate that α-amanitin-conjugated trastuzumab (T-Ama) potentiated the HER2-targeted therapy and exhibited superior efficacy in treating HER2-low breast cancer with 17p loss. Moreover, treatment with T-Ama induced immunogenic cell death in breast cancer cells and, thereby, delivered greater efficacy in combination with immune checkpoint blockade therapy in preclinical HER2-low breast cancer models. Collectively, 17p loss not only drives breast tumorigenesis but also confers therapeutic vulnerabilities that may be used to develop targeted precision immunotherapy.


Conflict of interest statement

Competing interests: X.L. has a U.S. patent (no. 10563204) on “Methods of treating cancer harboring hemizygous loss of TP53” licensed to Heidelberg Pharma AG. T.H. holds patents (WO2014135282A1, WO2016142049A1, WO2017149077A1, WO2018115466A1, WO2019030171A1, WO2019030173A1, WO2019057964A1, WO2019197654A1, and WO2020216947A1) in the field of amanitin-based ADCs.

Figures

Fig. 1.
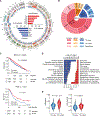
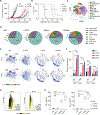
Fig. 1.. 17ploss is one of the most frequent chromosome abnormalities in breast cancer and correlates with low T cell infiltration and cytotoxicity in TNBC.
(A) Circos plot depicts the distribution of various genomic attributes along the genetic map of human breast cancer (BRCA) from The Cancer Genome Atlas (TCGA) and Molecular Taxonomy of Breast Cancer International Consortium (METABRIC) cohorts, with tracks for chromosome ideograms and genome-wide copy number variation (red, amplification; blue, deletion). The center of the plot shows the percentage of patients with breast cancer with the most frequent chromosome amplification (red) or deletion (blue). (B) The proportions of breast cancer with various 17p statuses in each subtype are shown in the pie chart. The CNA data of 2590 patients with breast cancer from TCGA and the METABRIC cohorts were evaluated. (C) Kaplan-Meier survival curves of overall survival for patient groups with 17ploss or 17pintact using TCGA and METABRIC datasets. P values were determined by log-rank test. (D) The gene set enrichment analysis for 17ploss versus 17pintact TNBC (blue, down-regulated pathways; red, up-regulated pathways in 17ploss TNBC). The bar chart represents significance of gene enrichment for any given pathway. The orange lines indicate the ratio or percent coverage of a pathway subject to pathway size bias. A P value of Fisher’s exact test of <0.05 and a false discovery rate (FDR) of <0.01 were set as the cutoff criteria. ECM, extracellular matrix; TCA, tricarboxylic acid; TCR, T cell receptor; NK, natural killer. (E) Violin box plots showed the correlation of 17p status with infiltration and cytotoxicity of T cells in TNBC. The boxes represent the interquartile range (IQR). The line in the box represents the median. The lower edge line of the box represents the 25th percentile (Q1), whereas the upper edge line of the box represents the 75th percentile (Q3). The end point of the vertical line below the box represents the minimum value (Q1 − 1.5 * IQR), whereas the end point of the vertical line above the box represents the maximum value (Q3 + 1.5 * IQR). Data were analyzed with the ICTD algorithm on 251 patients with TNBC (17ploss, 123 patients; 17pintact, 128 patients) from the METABRIC cohort.
Fig. 2.
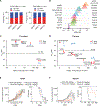
Fig. 2.. T-Ama exhibits superior efficacy in killing HER2-low TNBC cells with 17ploss.
(A) Frequencies of 17ploss and 17pintact in patients with TNBC with different HER2 scores from TCGA dataset or TNBC tissue microarrays (TMA). (B) The amounts of HER2 molecules on the surface of breast cancer cells were analyzed by flow cytometry. Median fluorescence intensity (MFI) of HER2 of standard microspheres with known antibody binding capacity (ABC) values was recorded. A regression curve associating fluorescence channel value to the beads’ ABC is generated. ABC values are assigned to stained cell samples based on the MFI of HER2+ populations of the cell samples using this standard curve. The value of ABC is equal to the number of HER2 molecules. n = 3. (C and D) The cytotoxicity of T-Ama (red dots) was compared to that of T-DM1 (blue squares) in terms of IC50 value in indicated 17pintact (C) and 17ploss (D) breast cancer cell lines with different concentrations of HER2 on the cell surface. IC50, half-maximal inhibitory concentration. n = 3. (E and F) Tumor growth curve and survival analysis in nude mice orthotopically implanted with HER2-low 17pintact BT20 cells (E) and HER2-low 17ploss HCC70 cells (F). Mice were randomized to four groups (n = 8 mice per group). On day 7 and day 14 after tumor inoculation, mice were intraperitoneally injected with either trastuzumab (Trzm) (20 mg/kg) or indicated doses of T-Ama. Data shown are means ± SD. Statistical analysis was conducted by two-way ANOVA with Tukey’s test for correction for tumor burden among groups and by log-rank (Mantel-Cox) test for animal survival. n.s., not significant. **P < 0.01, ***P < 0.001, and ****P < 0.0001.
Fig. 3.
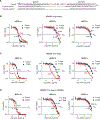
Fig. 3.. 17p loss renders HER2-low breast cancer cells highly vulnerable to T-Ama.
(A) Generation of 17p deletion (~20 Mb) in HS578T cells using Cas9 and two sgRNAs (sgWDR81 and sgMAP2K3). The sgRNA-targeting sites were underlined, and the protospacer adjacent motif sequence was highlighted in red. Colonies were screened using primers flanking the residual WDR81 and MAP2K3 (indicated by the arrows). Sanger sequencing results confirmed the break point junction with the deletion region indicated by the dashes. (B and C) 17pintact (B) and 17ploss (C) HS578T cells with different HER2 levels (scores 1, 2, and 3) were treated in vitro with T-Ama and T-DM1. The IC50 value is shown beside the curve. (D) Ectopic expression of POLR2A partially restored the resistance of 17ploss HS578T cells to T-Ama. IC50, half maximal inhibitory concentration; ADC, antibody-drug conjugate. The cell viability data were presented as means ± SD of three independent experiments (N = 3).
Fig. 4.
Fig. 4.. T-Ama exhibits in vivo antitumor activity in treating HER2-low breast cancer with 17p loss.
(A and B) Tumor growth curve and survival analysis of nude mice orthotopically implanted with HER2-low 17pintact (A) and the isogenic 17ploss HS578T cells (B). Mice were randomized to four groups (n = 8 mice per group) after tumors were established. On days 11 and 18 after tumor inoculation, mice were intraperitoneally injected with trastuzumab (Trzm), T-DM1, or T-Ama at indicated doses. Data shown are mean tumor volumes ± SD. (C and D) Tumor growth analysis of T-DM1–resistant HER2-low patient-derived xenograft with 17pintact (C) or 17ploss (D) in athymic (nu/nu) female mice. Tumors were intraperitoneally administered with a single dose of Trzm or T-Ama 33 days (HBCx-10) after tumor implantation or 36 days (HBCx-11) after tumor implantation. n = 4 to 8 mice per group. Data shown are mean tumor volumes ± SD. Immunohistochemical staining of HER2 was shown for both tumor models. Scale bars, 0.3 mm. Statistical analysis was conducted by two-way ANOVA test with Tukey’s test for correction for tumor burden among groups and by log-rank (Mantel-Cox) test for animal survival. n.s., not significant. ***P < 0.001 and ****P < 0.0001.
Fig. 5.
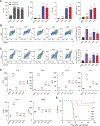
Fig. 5.. Treatment with α-amanitin induces immunogenic cell death in breast cancer cells.
(A) Treatment with α-amanitin triggered calreticulin exposure on the cell surface and extracellular release of ATP and HMGB1 in MDA-MB-453 cells in vitro. MDA-MB-453 cells were treated with IC50 dose of Crm (C2 ceramide), Dox (doxorubicin), or Ama (α-amanitin) for 72 hours, followed by assessment of the proportion of pre-apoptotic cells (AnnV+, PI) and apoptotic cells (AnnV+, PI+). The MFI of calreticulin on the cell membrane was quantified on PI cells. Extracellular ATP was measured with the ENLITEN ATP Assay System, whereas HMGB1 were detected with HMGB1 ELISA kit. AnnV, annexin V; PI, propidium iodide. All bars were compared to the mock bar. Statistical analysis was conducted by one-way ANOVA with Turkey’s test for correction. N = 3 repeats. (B and C) Analysis of bone marrow–derived dendritic cell (BMDC) maturation induced by coculture with the cytotoxicant-treated EO771 cells. BMDCs were stimulated with lipopolysaccharide (LPS) or EO771 cells pretreated with Crm, Dox (doxorubicin), or Ama (α-amanitin) for 72 hours. BMDC maturation was measured by MHC-II and CD80 expression (B) or MHC-II and CD86 expression (C) by flow cytometry. All bars were compared to the mock bar. Statistical analysis was conducted by one-way ANOVA with Turkey’s test for correction. N = 3 repeats. (D) The cytokines in the supernatant of BMDCs were analyzed by ELISA. Tumor cells were pretreated with mock, Crm, Dox, or Ama treated for 72 hours. The dead cells were harvested and then cocultured with BMDCs at a ratio of 1:5. After 24 hours, the dead cells were removed, and new medium was refilled. The BMDCs were stimulated with LPS (20 ng/ml) as a positive control. Data are depicted as box and whisker plots with whiskers showing minimum to maximum reported concentrations. All bars were compared to the mock bar. Statistical analysis was conducted by one-way ANOVA with Turkey’s test for correction. N = 3 repeats. (E) C57BL/6 mice were vaccinated with cytotoxicant-treated EO771 tumor cells and rechallenged with live untreated EO771 tumor cells. Control mice received an equivalent volume of phosphate-buffered saline as a control. Overall survival was recorded after rechallenge. Statistical analysis was conducted by log-rank (Mantel-Cox) test for animal survival. n.s., not significant. **P < 0.01, ***P < 0.001, and ****P < 0.0001.
Fig. 6.
Fig. 6.. T-Ama potentiates immune checkpoint blockade therapy in treating HER2-low breast cancer.
(A and B) Tumor growth curve (A) and survival analysis (B) in the C57BL/6-Tg(WapHER2) mice orthotopically implanted with 1 × 10⁶ HER2-low EO771 cells with 11B loss. When the tumor reached 75 to 100 mm3, the mice were randomized to four groups (n = 10 mice per group) for intraperitoneal injection with: (i) trastuzumab (20 mg/kg) (ctrl group) on days 7 and 14; (ii) T-Ama (5.0 mg/kg) on days 7 and 14; (iii) anti-mouse PD-1 (10 mg/kg) on days 5, 7, 9, 12, and 14; and (iv) combo treatment, T-Ama (5.0 mg/kg) on days 7 and 14 and anti-mouse PD-1 (10 mg/kg) on days 5, 8, 10, 13, and 15. (C and D) Analysis of the immune profile and microenvironment of mouse tumors derived from HER2-low/11B loss E0771 cells with the treatment as in (A) by CyTOF. tSNE (t-distributed stochastic neighbor embedding) representation of the immune cell subtypes after SPADE clustering is shown in (C) and mean percentages of distinct immune cell populations in the tumors are shown in (D). Mɸ, macrophage; NKT, natural killer T cells; DC, dendritic cells; Mo-MDSCs, Monocytic Myeloid-Derived Suppressor Cells; PMN-MDSCs, polymorphonucler myeloid-derived suppressor cells; Treg, regulatory T cell. (E) Analysis of PD-1 and TIM3 expression on CD4+ (black dashed line circled) and CD8+ (red dashed line circled) T cells from mice treated as in (A). (F) Quantitative data analysis of (E). (G) Expression of TNFα and IFN-γ from the infiltrating CD8+ T cells was analyzed by CyTOF. (H) Intratumoral CD3+ T cells from the tumors of the mice treated as in (A) were isolated, cultured ex vivo, and analyzed for the concentration of secreted TNFα and IFN-γ by ELISA. n = 5 replicates. For statistical analysis, one-way ANOVA with Tukey’s test for correction was used in (H), two-way ANOVA test with Tukey’s test for correction was used in (F), and log-rank (Mantel-Cox) test was used in (B). n.s., not significant. **P < 0.01, ***P < 0.001, and ****P < 0.0001.

References

    1. Chen LC, Neubauer A, Kurisu W, Waldman FM, Ljung BM, Goodson III W, Goldman ES, Moore II D, Balazs M, Liu E., Loss of heterozygosity on the short arm of chromosome 17 is associated with high proliferative capacity and DNA aneuploidy in primary human breast cancer. Proc. Natl. Acad. Sci. U.S.A 88, 3847–3851 (1991). - PMC - PubMed
    1. Li Y, Liu Y, Xu H, Jiang G, Van der Jeught K, Fang Y, Zhou Z, Zhang L, Frieden M, Wang L, Luo Z, Radovich M, Schneider BP, Deng Y, Liu Y, Huang K, He B, Wang J, He X, Zhang X, Ji G, Lu X., Heterozygous deletion of chromosome 17p renders prostate cancer vulnerable to inhibition of RNA polymerase II. Nat. Commun 9, 4394 (2018). - PMC - PubMed
    1. Liu Y, Zhang X, Han C, Wan G, Huang X, Ivan C, Jiang D, Rodriguez-Aguayo C, Lopez-Berestein G, Rao PH, Maru DM, Pahl A, He X, Sood AK, Ellis LM, Anderl J, Lu X., TP53 loss creates therapeutic vulnerability in colorectal cancer. Nature 520, 697–701 (2015). - PMC - PubMed
    1. Scarpa A, Di Pace C, Talamini G, Falconi M, Lemoine NR, Iacono C, Achille A, Baron A, Zamboni G., Cancer of the ampulla of Vater: Chromosome 17p allelic loss is associated with poor prognosis. Gut 46, 842–848 (2000). - PMC - PubMed
    1. Menendez D, Inga A, Resnick MA, The expanding universe of p53 targets. Nat. Rev. Cancer 9, 724–737 (2009). - PubMed

Publication types