. 2021 Feb 10;12(1):906.
doi: 10.1038/s41467-021-21150-2.

Nascent RNA sequencing identifies a widespread sigma70-dependent pausing regulated by Gre factors in bacteria

Affiliations

Nascent RNA sequencing identifies a widespread sigma70-dependent pausing regulated by Gre factors in bacteria

Zhe Sun et al. Nat Commun. .

Abstract

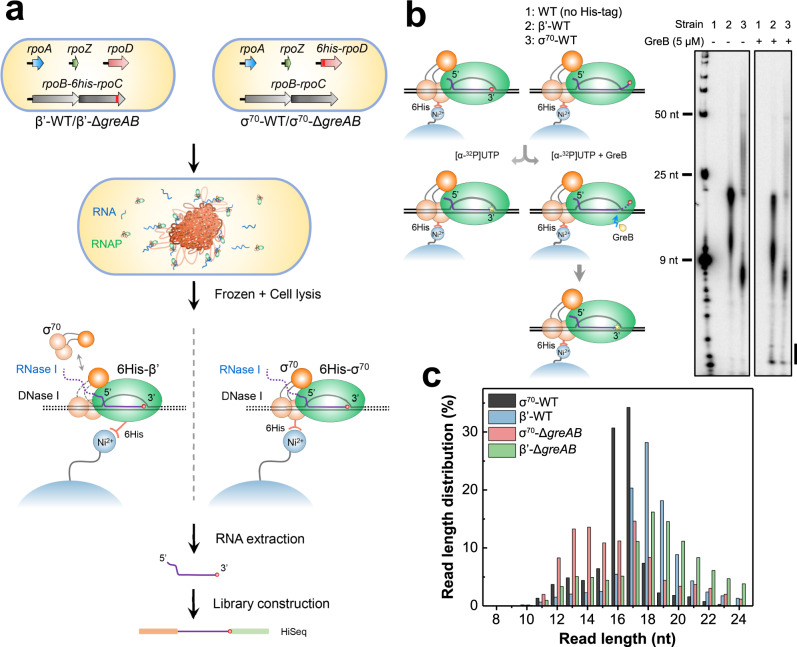
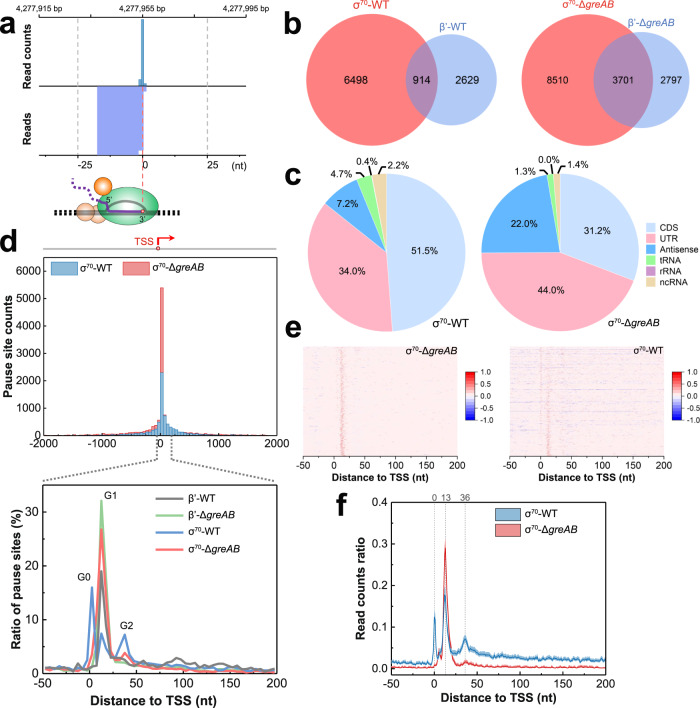
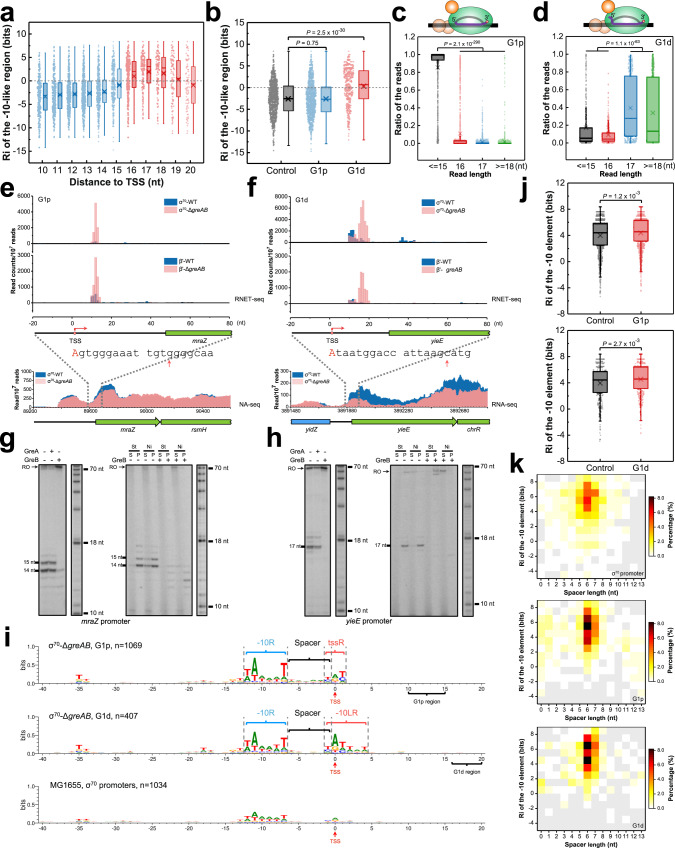
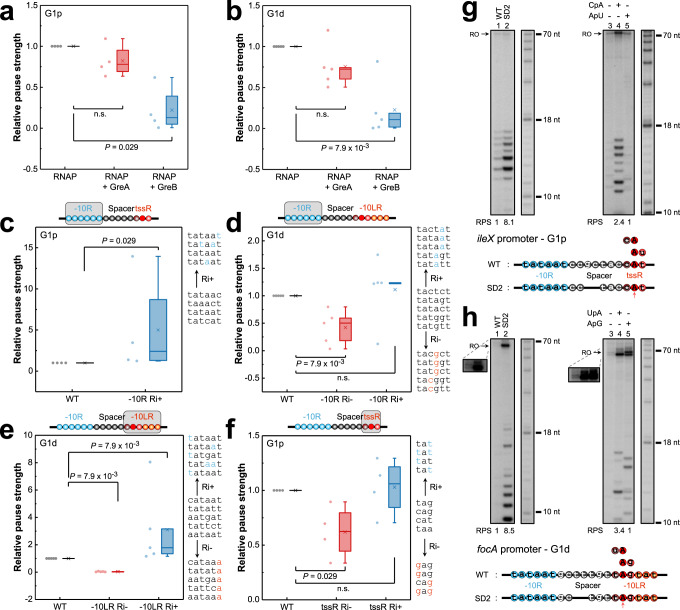
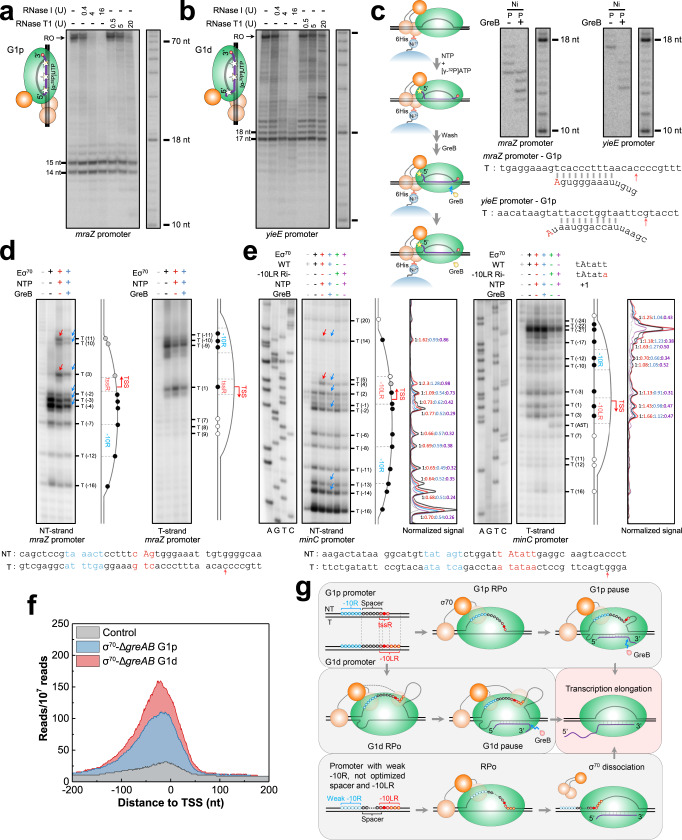
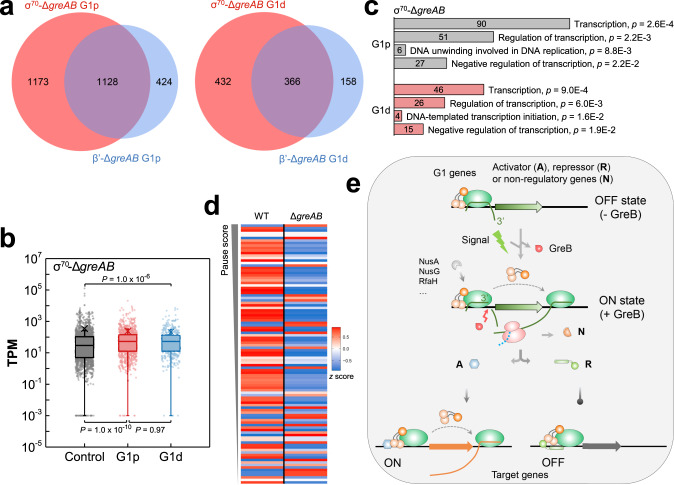
Promoter-proximal pausing regulates eukaryotic gene expression and serves as checkpoints to assemble elongation/splicing machinery. Little is known how broadly this type of pausing regulates transcription in bacteria. We apply nascent elongating transcript sequencing combined with RNase I footprinting for genome-wide analysis of σ70-dependent transcription pauses in Escherichia coli. Retention of σ70 induces strong backtracked pauses at a 10-20-bp distance from many promoters. The pauses in the 10-15-bp register of the promoter are dictated by the canonical -10 element, 6-7 nt spacer and "YR+1Y" motif centered at the transcription start site. The promoters for the pauses in the 16-20-bp register contain an additional -10-like sequence recognized by σ70. Our in vitro analysis reveals that DNA scrunching is involved in these pauses relieved by Gre cleavage factors. The genes coding for transcription factors are enriched in these pauses, suggesting that σ70 and Gre proteins regulate transcription in response to changing environmental cues.


Conflict of interest statement

The authors declare no competing interests.

Figures

Fig. 1
Fig. 1. RNET-seq identifies σ70-dependent pauses and the corresponding translocation states of RNAP in WT and ΔgreAB cells.
a Principles of RNET-seq. The σ70 and β’ strains with 6His-tagged RpoD (σ70) and RpoC (β’) subunits were used for purification of the intact paused TECs from bacterial nucleoids after treatment with nucleases (see details in Methods). The green oval represents the RNAP core enzyme. Three connected brown circles represent individual domains of the σ70 subunit bound to the −10/−35 promoter elements or to RNAP core. β’-WT/β’-ΔgreAB, WT or ΔgreAB with His-tagged β’; σ70-WT/σ70greAB, WT or ΔgreAB with His-tagged σ70. b PAGE of the 32P-RNA-labeled paused complexes and their sensitivity to GreB-stimulated cleavage. WT, E. coli W3110 strain lacking the His-tag in σ70 and β’. The first lane, RNA ladder. Vertical bar, cleavage products. Similar quantity of paused TECs were used to allow direct comparison of the RNA yields between β’-WT and σ70-WT cells. Data shown are representative of three independent experiments. c Histogram shows RNA length distributions (RNA footprints) for the uniquely mapped RNET-seq reads from the indicated strains. The length of protected RNA allowed determination of the translocation register of RNAP in β’-WT at each pause: 16−17-nt, 18-nt and >18-nt RNAs corresponded to the post-translocated, pre-translocated and backtracked states, respectively. The average read lengths for σ70-WT, β’-WT, σ70greAB and β’-ΔgreAB strains are 16.3-nt, 18.0-nt, 16.0-nt and 18.3-nt. The <16-nt RNAs were derived from RNAP pausing at a short <16-bp distance from promoters where the nascent transcripts were not yet accessible to the nucleases.
Fig. 2
Fig. 2. Classification of σ70-dependent transcription pauses.
a Example of σ70-dependent pause upstream of the yjcE coding sequence (CDS) identified by RNET-seq in the σ70greAB strain. The genomic coordinates for 3’ ends of all uniquely mapped RNA reads (bottom lane) were determined and the read count for each 3′ end position was calculated and plotted (top lane). The genomic positions where 3’ end/3’ end median (51-bp window) read counts ratio (pause score) was ≥ 20 and read counts/106 reads was ≥ 10 satisfied our stringent definition for a pause site. b Venn diagrams show the total and shared numbers of pauses identified in σ70-WT (n = 7412), β’-WT (n = 3543), σ70greAB (n = 12211) and β’-ΔgreAB (n = 6498) strains. c Distribution of σ70-dependent pauses among CDS, UTR, Antisense, tRNA, rRNA and ncRNA regions in σ70-WT and σ70greAB strains. The “Antisense” pauses included those in CDS, tRNA, rRNA and ncRNA genes. d Distribution of pause sites in promoter-proximal regions. The TSS coordinates identified by dRNA-seq were used to plot pause counts against the pause distance from the nearest TSS on the same DNA strand. The zero and positive coordinates correspond to the pauses overlapping the TSS or located downstream of the TSS, respectively. The upper panel shows the counts of pauses in 50-nt bins within −2000/+2000-bp window centered at the TSS. The bottom panel shows the ratio obtained by dividing the count of pause sites in a 5-bp sliding window to the total count of pause sites in the −50/+200-bp register surrounding the TSS. Heatmap (e) and mean (f) of the read counts for σ70greAB G1 pause sites (n = 3099) in σ70greAB (left) and σ70-WT (right) strains. The pause sites were ranked based on the pause score (described in a). The counts of reads aligned to the sense and antisense strands in each coordinate were normalized to 0 to 1 and 0 to −1 by dividing the maximum read count in each −50/+200-bp region. The regions with multiple pause sites were counted only once (e). The dashed line and number on the top indicate the distance of the peak from the TSS. The line and the shadowed region represent the mean and 95% confidence interval for the read counts ratio (f).
Fig. 3
Fig. 3. Statistical and in vitro biochemical analysis of G1 pauses.
a Information content (Ri) for −10LR (−10-like region) encoded by all σ70greAB G1 pauses as a function of its distance from the TSS. The second base in the −10-like hexamer marked the location of the −10LR. The highest Ri of the hexamers ranging from −1 to +2 was adopted and assigned to −10LR (n = 3099). b Boxplot compares the Ri of −10LR for proximal G1p and distal G1d pauses. All σ70 promoters from RegulonDB with a labeled −10 element were used as a control, n = 950 σ70 promoters. In this and all subsequent boxplots, the median (solid line), mean (cross), 25th and 75th percentiles are indicated, and the whiskers represent 1.5-fold interquartile range. c, d Read length distribution at G1p (n = 1069) and G1d (n = 407) pauses, respectively. Ratio of reads, number of reads with specific length(es)/number of total reads. The cartoon on the top depict the backtracked translocation states of G1d complexes based on a significant difference of their read lengths. Note, that the short ≤15-nt RNAs detected at most G1p pauses were due to the close proximity of G1p pauses to the TSS that precluded determination of the translocation state of G1p complexes by treatment with RNase I. e, f RNET-seq and RNA-seq profiles of two representative genomic regions containing G1p and G1d pauses identified by RNET-seq at mraZ and yieE promoters, respectively. The first 20 nt of mraZ and yieE transcripts are shown. The red capital letters and arrows indicate the TSS and the pause peaks from RNET-seq data. g, h in vitro validation of the σ70-dependent G1p and G1d pauses at mraZ and yieE promoters, respectively. The left panel shows nascent RNA in the paused complexes obtained in the presence and absence of GreA or GreB. Immobilization on streptavidin beads through 5′-biotin DNA was used to confirm integrity of the RNA-labeled paused complexes (right panel). Eσ70 with His-tagged σ70 was used for the assay confirming the presence of σ70 in the paused complexes. RO, run-off transcripts; St, streptavidin; Ni, Ni2+-NTA agarose; S, supernatant; P, pellet. The representative results are based on three independent experiments. i Sequence logo for σ70greAB G1p and G1d promoters and for σ70 promoters from RegulonDB. The DNA sequences were aligned relative to the TSS. Only the strongest pause was used for analysis of the TSSs following multiple pause sites. Coordinate “0” represents TSS (commonly marked as the +1 site) in the sequence logo, otherwise the standard “+1” TSS nomenclature was used. −10R, −10 promoter element; tssR, region surrounding TSS; −10LR, −10-like region; spacer, spacing region between −10R and TSS. j Boxplot comparing Ri of the −10 elements for G1p (top) and G1d (bottom) promoters. G1p promoters, n = 1069 and G1d promoters, n = 407. −10R of the same numbers of randomly chosen promoters were used as a control. k Heatmap showing correlation between distribution of spacer length and information content (Ri) of the promoter −10 element for all σ70 promoters (top), promoters containing G1p (middle) and G1d (bottom) pauses. The two-tailed Mann-Whitney U-test was used for the statistical analysis shown above.
Fig. 4
Fig. 4. −10R, spacer length and tssR/−10LR determine G1p and G1d pauses in vitro.
Boxplots of pause strength for G1p (a) and G1d (b) pauses in the absence and presence of GreA or GreB. G1p (exuR, mraZ, ileX and mocA; n = 4 G1p promoters) and G1d (yieE, minC, gadW, mrdB and artP; n = 5 G1d promoters) promoters were used for the analysis (af). The pause strength was determined by dividing the signal intensity of run-off and paused RNA products to the signal intensity of paused RNA product in the gel for each in vitro template (Pause strength = Signal intensity[paused RNA]/(Signal intensity[paused RNA] + Signal intensity[run-off])). The pause strength in the absence of Gre factors was set to 1 (a, b). Boxplots show the effect on pause strength of −10R and tssR mutations in G1p promoters (c, f), and −10R and −10LR mutations in G1d promoters (d, e). Pause strength of the WT promoters was set to 1 (cf). −10R (−10LR; tssR) Ri−/Ri+ , mutated −10R (−10LR; tssR) with decreased or increased Ri are indicated. The gray rectangle in each cartoon represents the motif used for mutation analysis. The original and mutated (colored in blue or red) DNA sequences designed to increase (Ri+) or decrease (Ri−) Ri are shown on the right in gene order. Two-tailed Mann-Whitney U-test was used for statistical analysis of the data. Effect of the spacer length on G1p (g) and G1d (h) pauses. The in vitro transcription was initiated on the WT template or on the mutant template with the shortened DNA spacer (left); different dinucleotide RNA primers overlapping the tssR were employed to alter the position of the TSS (right). The inset shows the run-off transcripts with higher exposure to visualize the faint bands. Data represent three independent experiments. Structural elements of the WT and mutated promoters are shown on the bottom. Each circle represents a single nucleotide. Open blue circles, −10R; Dark red circle, overlapped nucleotide between spacer and tssR/−10LR; Open black and dark red circles, spacer; Red circles, tssR; Red and orange circles, −10LR; Filled red circle, TSS. Red arrows indicate TSS. WT, wild-type promoter; SD2, spacer with 2-nt deletion; RPS, relative pause strength. The analysis included the data from two or more independent experiments.
Fig. 5
Fig. 5. In vitro analysis of G1p/G1d pauses and the corresponding open promoter complexes.
Protection of the nascent RNA by Eσ70 (6His-σ70) holoenzyme from digestion by RNases I and T1 at G1p (a) and G1d (b) pauses. In the regular (non-paused) elongation complex, RNAP protects 14 nt (RNase T1) and 17−18 nt (RNase I) of the 3’ RNA from nuclease digestion. The cartoons on the left show the proposed alternative translocation states of the RNA in the paused complex. The stars indicate the RNA positions labeled by [α-32P] UMP. Data shown represent two independent experiments. c GreB-induced transcript cleavage of nascent RNA at G1p (mraZ) and G1d (yieE) pauses. The workflow for the experiment is shown on the left. Ni, Ni2+-NTA beads; P, pellet. Results represent two independent experiments. The template strand sequences of the mraZ and yieE promoters and backtracked RNAs at the pause sites are shown at the bottom. Red arrows indicate the pausing peaks identified by RNET-seq. d Permanganate footprints of the non-template and template strands of the transcription bubble at the mraZ (G1p) promoter. The positions of all T residues in the bubble are indicated. The diagrams on the right show the transcription bubble at the mraZ promoter during G1p pausing. Black filled circles, T residues sensitive to KMnO4 in the absence and presence of NTP; gray filled circles, permanganate-sensitive T residues only in the presence of NTP; white filled circle, T residues resistant to permanganate. e Permanganate footprints of the transcription bubble at the minC (G1d) promoter. Both DNA strands of the mraZ and minC promoters including the −10R (blue), tssR/−10LR (red) elements and TSS (red capital) are shown at the bottom, and the corresponding G1p and G1d pause sites are marked by red arrows. f Profiles of median ChIP-seq reads coverage at G1p, G1d and control promoters based on the heatmaps (Supplementary Fig. 16). Permanganate footprinting results are representative of three independent experiments. g Model depicting the structural properties of σ70-dependent G1p and G1d pauses. The interaction of σ70 domains with the promoter elements, the DNA scrunching and the corresponding changes in the RNA register at G1p and G1d pauses are indicated.
Fig. 6
Fig. 6. Role of σ70-dependent pauses in transcription regulation.
a Venn diagrams of all G1p (left) and G1d (right) pauses from ΔgreAB cells identified in this work. b Boxplot of transcripts per million (TPM) for the genes with and without G1p or G1d pauses. Control genes, n = 1641; genes with G1p pauses, n = 863 and genes with G1d pauses, n = 386. P value was calculated by two-tailed Mann-Whitney U-test. c Gene Ontology (GO) analysis of genes with G1p and G1d pauses in the corresponding promoter-proximal regions. All significantly enriched gene categories are listed. The number of genes in each category is shown inside the bars. d Heatmap shows the transcription pattern of genes containing G1 pauses in σ70-WT and σ70greAB datasets. The G1 genes whose start codon is ≤ 20 bp upstream and ≤ 100 bp downstream from σ70greAB G1 pause sites (pause score ≥ 1000, n = 104) are shown. Data from three biological replicates are presented. WT, σ70-WT strain; ΔgreAB, σ70greAB strain. e Schematic illustration of the mechanism for σ70-induced promoter-proximal pausing, its suppression by GreB, and the impact of the pausing on global regulation of transcription. σ70 induces strong backtracked G1 pauses to inhibit gene transcription by hindering RNAP elongation. The GreB expression is increased under certain environmental stresses to relieve the G1 pauses. The release of G1 pauses increases the corresponding genes transcription, especially the genes coding for transcription regulators. The transcription regulators further up- or down-regulate transcription of target genes to response to environmental perturbations.

Similar articles

Cited by

References

    1. Adelman K, Lis JT. Promoter-proximal pausing of RNA polymerase II: emerging roles in metazoans. Nat. Rev. Genet. 2012;13:720–731. doi: 10.1038/nrg3293. - DOI - PMC - PubMed
    1. Core L, Adelman K. Promoter-proximal pausing of RNA polymerase II: a nexus of gene regulation. Genes Dev. 2019;33:960–982. doi: 10.1101/gad.325142.119. - DOI - PMC - PubMed
    1. Mayer A, Landry HM, Churchman LS. Pause & go: from the discovery of RNA polymerase pausing to its functional implications. Curr. Opin. Cell Biol. 2017;46:72–80. doi: 10.1016/j.ceb.2017.03.002. - DOI - PMC - PubMed
    1. Kang JY, Mishanina TV, Landick R, Darst SA. Mechanisms of transcriptional pausing in bacteria. J. Mol. Biol. 2019;431:4007–4029. doi: 10.1016/j.jmb.2019.07.017. - DOI - PMC - PubMed
    1. Vvedenskaya IO, et al. Interactions between RNA polymerase and the “core recognition element” counteract pausing. Science. 2014;344:1285–1289. doi: 10.1126/science.1253458. - DOI - PMC - PubMed

Publication types

MeSH terms