. 2021 Feb 10;12(1):919.
doi: 10.1038/s41467-021-21142-2.

Quantitative single-protein imaging reveals molecular complex formation of integrin, talin, and kindlin during cell adhesion

Affiliations

Quantitative single-protein imaging reveals molecular complex formation of integrin, talin, and kindlin during cell adhesion

Lisa S Fischer et al. Nat Commun. .

Abstract

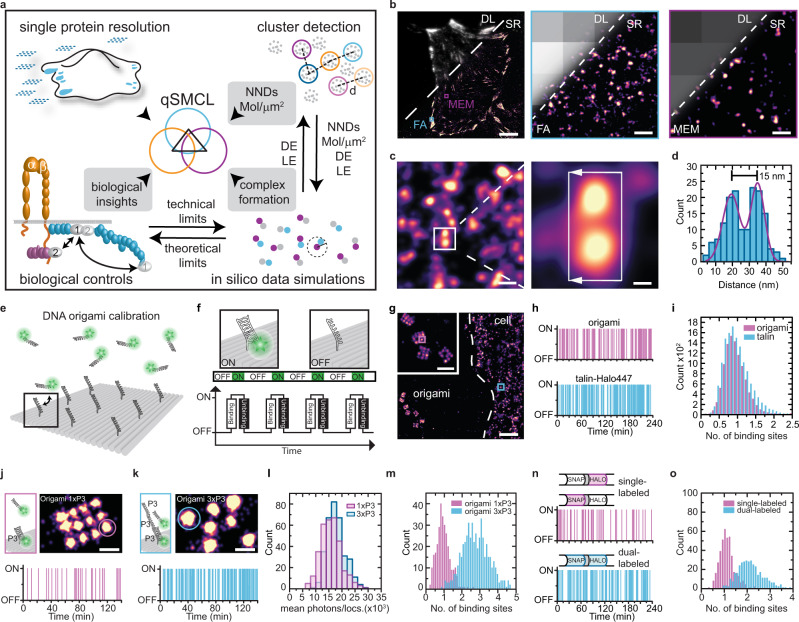
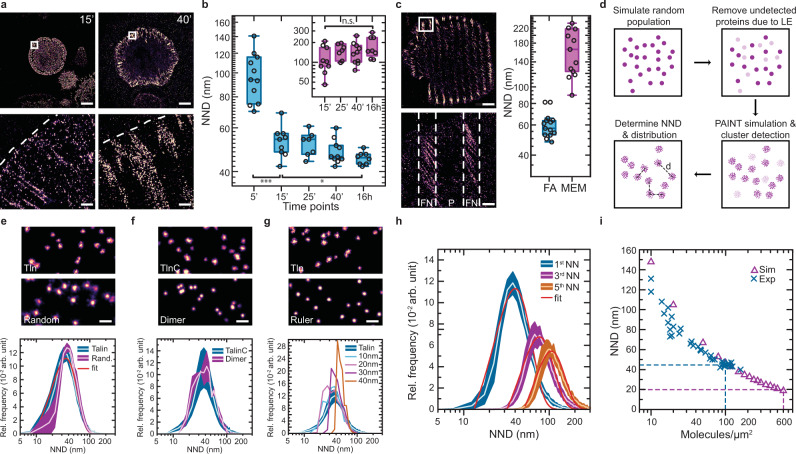
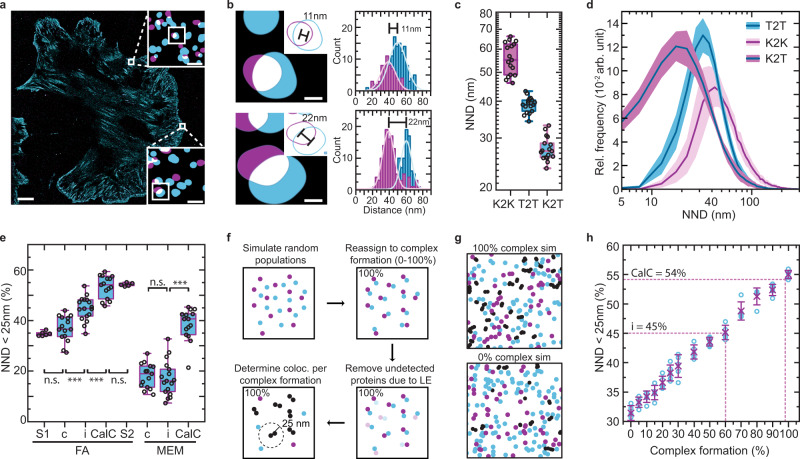
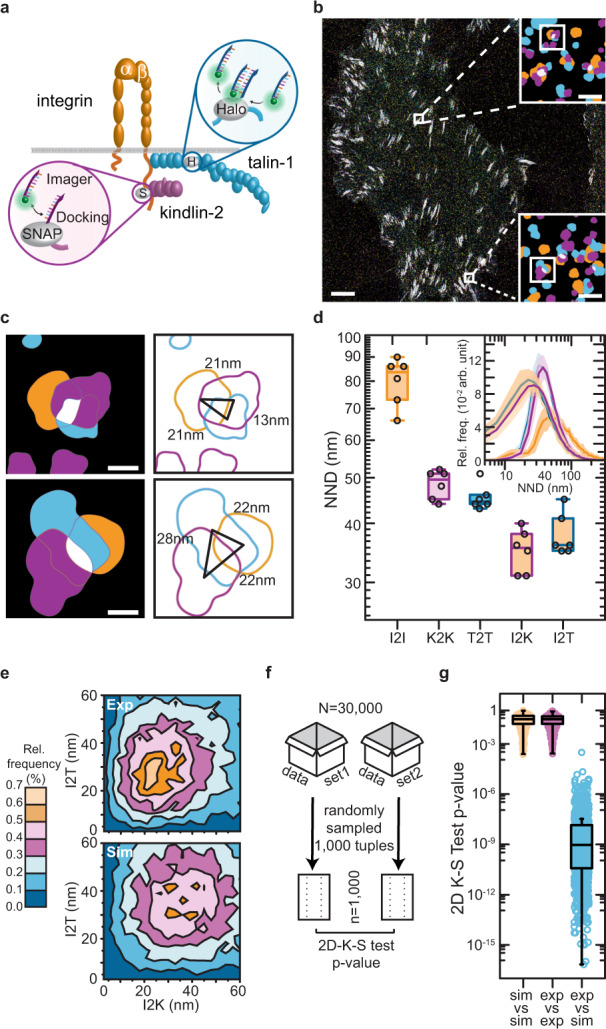
Single-molecule localization microscopy (SMLM) enabling the investigation of individual proteins on molecular scales has revolutionized how biological processes are analysed in cells. However, a major limitation of imaging techniques reaching single-protein resolution is the incomplete and often unknown labeling and detection efficiency of the utilized molecular probes. As a result, fundamental processes such as complex formation of distinct molecular species cannot be reliably quantified. Here, we establish a super-resolution microscopy framework, called quantitative single-molecule colocalization analysis (qSMCL), which permits the identification of absolute molecular quantities and thus the investigation of molecular-scale processes inside cells. The method combines multiplexed single-protein resolution imaging, automated cluster detection, in silico data simulation procedures, and widely applicable experimental controls to determine absolute fractions and spatial coordinates of interacting species on a true molecular level, even in highly crowded subcellular structures. The first application of this framework allowed the identification of a long-sought ternary adhesion complex-consisting of talin, kindlin and active β1-integrin-that specifically forms in cell-matrix adhesion sites. Together, the experiments demonstrate that qSMCL allows an absolute quantification of multiplexed SMLM data and thus should be useful for investigating molecular mechanisms underlying numerous processes in cells.


Conflict of interest statement

The authors declare no competing interests.

Figures

Fig. 1
Fig. 1. Resolving the location of individual molecules in crowded subcellular structures.
a Schematic overview of quantitative single-molecule colocalization analysis (qSMCL) to evaluate nearest-neighbor distance (NND), molecular densities (mol/µm2), detection efficiencies (DEs), and labeling efficiencies (LEs). b Overlay of diffraction-limited (DL) and super-resolved (SR) DNA-PAINT image showing a talin-Halo447 expressing cell. Zoom into focal adhesion area reveals distinct talin localization clouds. Regions in the free membrane (MEM) are characterized by more disperse talin localization clouds. c The approach allows the separation of distinct talin-1 localization clouds at a distance of approximately 15 nm. d Histogram analysis demonstrates that the localization clouds shown in c can indeed be resolved (σPeak1 = 3.5 nm, σPeak2 = 5.6 nm); number of localizations (nlocs = 157). e Schematic illustration of a DNA origami calibration. f Transient binding events of dye-labeled imager strands to the complementary, immobilized docking strands, creating the characteristic “blinking” (ON/OFF) required for single-molecule localization microscopy. g DNA origami structures carrying single docking strands were placed next to talin-Halo447 cells to calculate the number of molecules per localization cloud. Inset: Zoom onto DNA origami structures. h Plotting the binding events over the number of recorded frames reveals similar binding traces in DNA origami and talin-Halo447 localization clouds. i Quantitative histogram analysis of absolute binding site numbers on DNA origami and talin localization clouds confirming that the observed talin localization clouds represent single talin-1 proteins (n = 8 cells). j Zoom-in of a 20 nm grid DNA origami displaying a single binding sequence (1xP3) per site and the corresponding binding event history. k Zoom-in of a DNA origami structure with three concatenated binding sequences (3xP3) per docking strand and the corresponding binding event history. l Analysis of the mean photon counts per individual localization event reveals highly similar values for single (j) and triple (k) binding sequences (n = 334 localization events). m qPAINT analysis confirmed either one or three binding sites per DNA origami localization cloud (n = 1). n Binding frequency of a single-labeled (due to <100% labeling efficiency) and a dual-labeled localization cloud. o qPAINT analysis reveals, as expected, that either one or two binding sites are detected (n = 1 cell). Scale bars: 7 µm (b), 370 nm (g), 110 nm (g inset), 70 nm (b insets), 50 nm (c, right), 30 nm (j, k), 9 nm (c, right). Source data are provided in the Source Data file.
Fig. 2
Fig. 2. Combining cluster analysis with theoretical simulations enables the investigation of molecular assembly models.
a Localization of talin-1 to first adhesion clusters 15 min and maturing focal adhesions (FAs) 40 min after initiation of cell–ECM adhesion. b Nearest-neighbor distance (NND) analysis reveals the compaction of talin-1 molecules during FA maturation towards a characteristic endpoint density (blue); the molecular distance of talin-1 in the membrane region (MEM) is unaffected by the cell adhesion state (purple) (n5 min = 11; n15 min = 9; n25 min = 7; n40 min = 10; n16 h = 8 cells) (FA: p5 min vs. 15 min = 1.79 × 10−5; p15 min vs. 16 h = 0.01619; MEM: p15 min vs. 16h = 0.06115). c Analysis of talin-Halo447 expressing cells on 1 μm thick micropatterned fibronectin (FN) stripes—separated by passivated (P) 2 μm stripes—demonstrates that the molecular localization of talin is governed by integrin-mediated ECM engagement (n = 13 cells). d Schematic overview of the DNA-PAINT data simulation workflow considering random distributions, labeling efficiency (LE) and cluster detection efficiency (DE) allowing distance (d) calculations. e Comparison of experimental talin-Halo447 data (Talin) with a simulation of randomly organized proteins (Rand.) shows highly similar distributions. Bottom: experimental data of talin-1 were fitted with a 2D Poisson density function (red line) and plotted as relative frequency (Rel. frequency) in arbitrary units (arb. unit). f Comparing experimental data from C-terminally tagged talin-1 constructs (TalinC) with a simulation of a protein complex (Dimer) does not indicate talin dimer formation. g Comparison of experimental talin-Halo447 data (Talin) with a simulation assuming steric hindrance at 10–40 nm indicates that talin does not act as a molecular ruler in FAs. h Talin-1 distribution of the 1st, 3rd, and 5th nearest-neighbor (NN) in FAs. Distributions were fitted with a 2D Poisson density function (red line) indicating a random organization of talin-1 molecules on length scales between 40 and 120 nm (n = 8 cells). i Random distribution simulations (Sim; magenta triangle) indicate an absolute molecular density of approximately 600 molecules/μm2 for talin-1 in focal adhesions (purple dashed line); blue crosses indicate experimental data (Exp) and the dashed blue line indicates the experimentally observed densities (n = 39 cells). Boxplots show median and 25th and 75th percentage with whiskers reaching to the last data point within 1.5× interquartile range. NND distributions show the mean (line) ± SD (shaded area). Two-sample t-test: ***p ≤ 0.001, *p ≤ 0.05, n.s. (not significant) p > 0.05. NND distributions show mean and standard deviations. Scale bars: 10 μm (a, c), 500 nm (a, c, inset), and 50 nm (eg). Source data are provided in the Source Data file.
Fig. 3
Fig. 3. Integrating Exchange-PAINT with theoretical simulations allows the quantification of protein–protein interactions.
a Representative image of a reconstituted cell with labeled talin-Halo447 (blue) and SNAP-kindlin (purple). b Zoom into focal adhesions reveals that talin-1 and kindlin-2 molecules are in close spatial proximity. Gaussian fits of the aligned single-molecule localizations to their center-of-mass reveal neighboring talin-1 (blue) and kindlin-2 (purple) molecules at distances of 11 nm (σPeak1 = 8.8 nm; σPeak2 = 10.4 nm) and 22 nm (σPeak1 = 6.4 nm; σPeak2 = 6.9 nm). c Nearest-neighbor distance (NND) analyses reveal the molecular spacing between kindlin-2 (K2K) and talin-1 molecules (T2T). The average distance between kindlin and talin molecules (K2T) is significantly lower (n = 17 cells). d T2T, K2K, and K2T NND distributions (plotted as relative frequency (Rel. frequency) in arbitrary units (arb. unit)) indicate a shift of K2T towards shorter distances (n = 17 cells). e Simulations (S1) indicate that 35% of talin-1 and kindlin-2 molecules can be expected in close spatial proximity (<25 nm), due to high protein density in FAs. Forty-five percent of labeled kindlin-2 molecules are in close proximity to the next internally tagged talin-1 molecule (i); this spatial proximity is significantly lower in cells expressing C-terminally tagged talin-1 (c). Experiments of talin-CalC, which mimics perfect spatial proximity, yields a value of 54% (CalC) in consistency with simulations that consider the published labeling efficiencies for HaloTag and SNAP-tag (S2). The observed effects are specific to focal adhesions (FAs) and not observed in free membrane (MEM) regions (nS1 = 6; nc = 15; ni = 17; nCalC = 15; nS2 = 5 simulated data sets) (FA: pS1 vs. c = 0.365; pc vs. i = 8.05 × 10−5; pi vs. CalC = 9.84 × 10−6; pCalC vs. S2 = 0.667; MEM: pc vs. i = 0.61; pi vs. CalC = 4.33 × 10−10). NND distributions show the mean (line) ± SD (shaded area). f Schematic overview of in silico data simulation for two protein populations (purple and blue) undergoing molecular complex formation, considering the labeling efficiencies (LEs). Spatially associated proteins within 25 nm are colored in black. g Simulation data (sim) of two protein populations undergoing 100% or 0% complex formation. h Theoretical simulations of colocalization experiments. The percentage of binding sites closer than 25 nm was plotted over the percentage of complex formation. Crosses indicate mean, and error bars the standard deviation. Boxplots show median and 25th and 75th percentage with whiskers reaching the last data point within 1.5× interquartile range. Two-sample t-test: ***p ≤ 0.001, n.s. (not significant) p > 0.05. Visualization of a and b is based on the convex hull of grouped localization clouds. Scale bars: 5 μm (a), 100 nm (a, insets), and 20 nm (b). Source data are provided in the Source Data file.
Fig. 4
Fig. 4. qSMCL provides direct evidence for a ternary complex formation of talin and kindlin with active integrin receptors.
a Overview of HaloTag and SNAP-tag-based DNA-PAINT imaging of talin and kindlin molecules in cells. b Representative image of labeled talin-Halo447, SNAP-kindlin, and β1-integrin; integrins were labeled with a DNA-conjugated antibody (9EG7) allowing the visualization (but not absolute quantification, due to heterogenous docking site number per labeled antibody) of β1-integrin in the extended conformation. c Zoom into FAs reveals close proximity of talin-1 (blue), kindlin-2 (purple), and extended β1-integrin (orange). d Nearest-neighbor distance (NND) analyses reveal the molecular spacing distributions of talin-1 (T2T) and kindlin-2 (K2K) in reconstituted cells; extended β1-integrin is observed at larger distances of ~85 nm (I2I); average integrin-to-kindlin (I2K) and integrin-to-talin (I2T) distances were observed at around 35 nm (n = 6 cells). NND distributions show mean (line) ± SD (shaded area). e Randomly distributed simulations at the observed molecular densities for talin-1, kindlin-2, and β1-integrin were compared to experimental data by plotting I2K and corresponding I2T tuples for each detected β1-integrin; Rel. frequency: relative frequency. f Comparing experimental integrin-talin-kindlin data with simulations using bootstrap analysis. To determine the goodness of fit and significance level between experimental data and simulated data, a 2D Kolmogorov–Smirnov (K–S) test was used. g Statistical evaluation of experimental and simulated integrin-talin-kindlin bootstrapped data (sample size = 1000 data points, test runs = 1000) revealed high p-values for intrinsic data bootstrapping (“sim vs. sim” and “exp vs. exp”) but low p-values when comparing experimental with simulated data sets (“exp vs. sim”). Boxplots show median and 25th and 75th percentage with whiskers reaching to the last data point within 1.5× interquartile range. Visualization of b and c is based on the convex hull of grouped localization clouds. Scale bars: 5 μm (b), 100 nm (b, insets), and 20 nm (c). Source data are provided in the Source Data file.

References

    1. Jungmann R, et al. Single-molecule kinetics and super-resolution microscopy by fluorescence imaging of transient binding on DNA origami. Nano Lett. 2010;10:4756–4761. doi: 10.1021/nl103427w. - DOI - PubMed
    1. Jungmann R, et al. Multiplexed 3D cellular super-resolution imaging with DNA-PAINT and Exchange-PAINT. Nat. Methods. 2014;11:313–318. doi: 10.1038/nmeth.2835. - DOI - PMC - PubMed
    1. Gwosch KC, et al. MINFLUX nanoscopy delivers 3D multicolor nanometer resolution in cells. Nat. Methods. 2020;17:217–224. doi: 10.1038/s41592-019-0688-0. - DOI - PubMed
    1. Thevathasan JV, et al. Nuclear pores as versatile reference standards for quantitative superresolution microscopy. Nat. Methods. 2019;16:1045–1053. doi: 10.1038/s41592-019-0574-9. - DOI - PMC - PubMed
    1. Schlichthaerle T, et al. Direct visualization of single nuclear pore complex proteins using genetically-encoded probes for DNA-PAINT. Angew. Chem. Int. Ed. Engl. 2019;58:13004–13008. doi: 10.1002/anie.201905685. - DOI - PMC - PubMed

Publication types