. 2021 Feb 10;12(1):909.
doi: 10.1038/s41467-021-21269-2.

Genotyping cognate Plasmodium falciparum in humans and mosquitoes to estimate onward transmission of asymptomatic infections

Affiliations

Genotyping cognate Plasmodium falciparum in humans and mosquitoes to estimate onward transmission of asymptomatic infections

Kelsey M Sumner et al. Nat Commun. .

Abstract

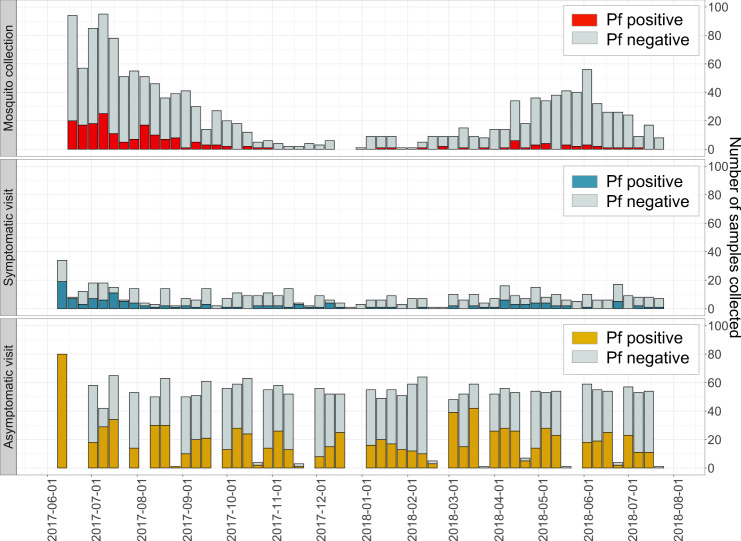
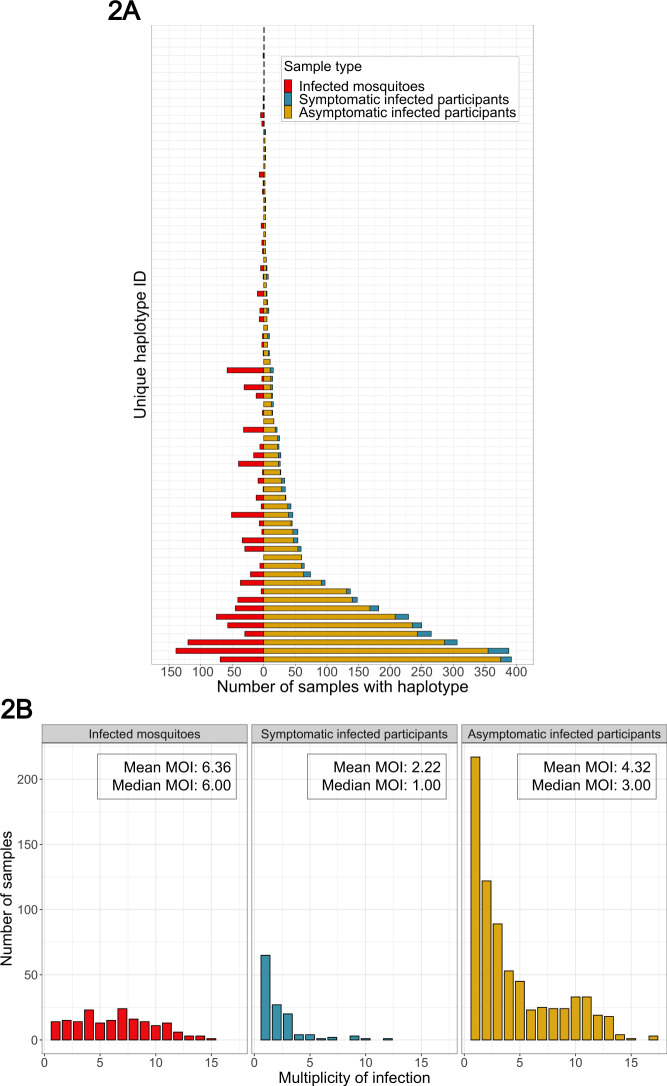
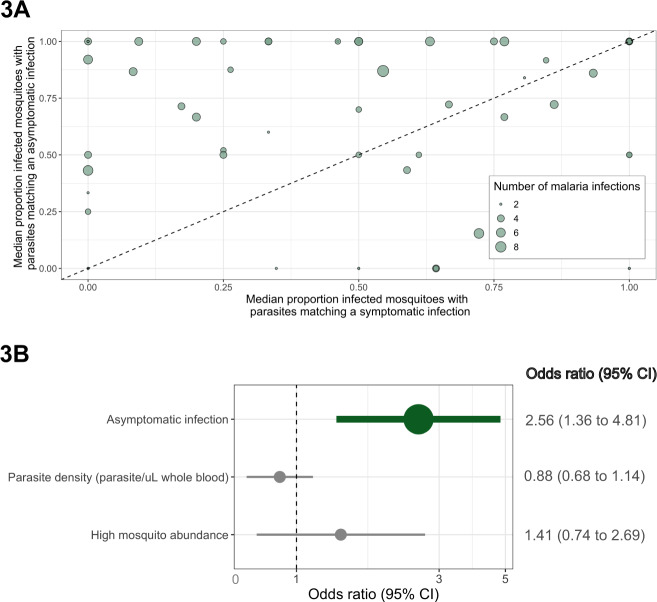
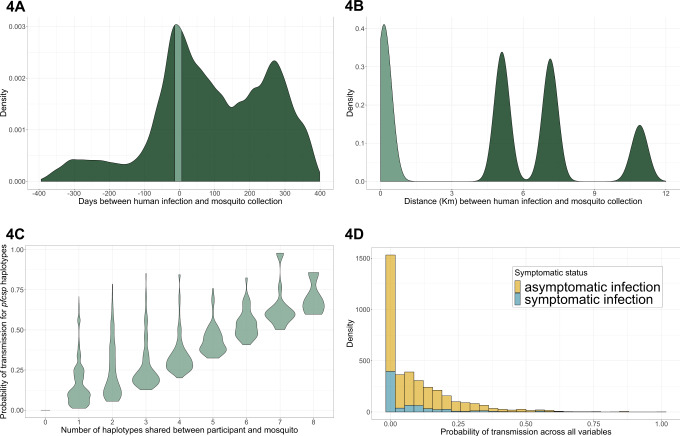
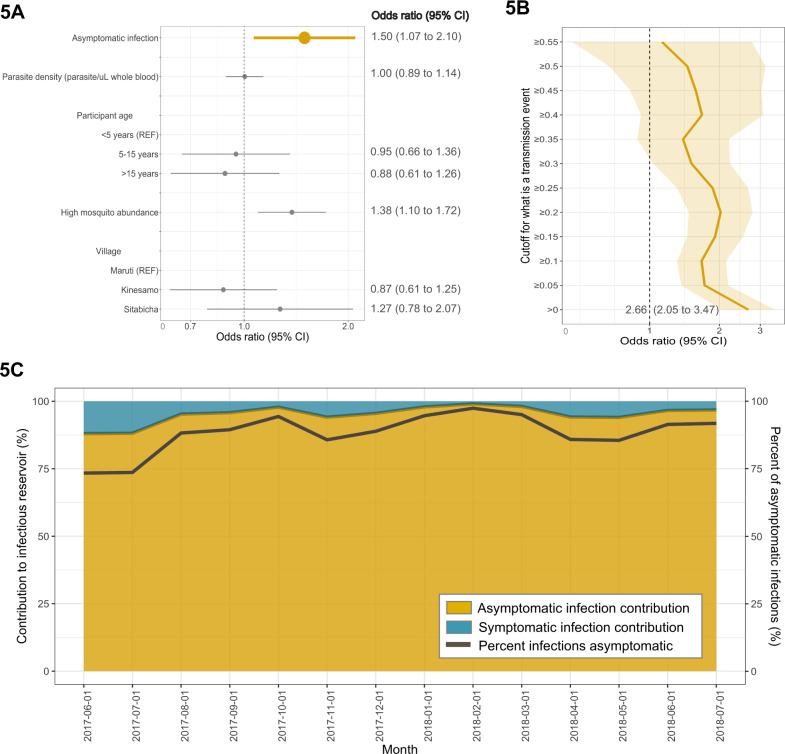
Malaria control may be enhanced by targeting reservoirs of Plasmodium falciparum transmission. One putative reservoir is asymptomatic malaria infections and the scale of their contribution to transmission in natural settings is not known. We assess the contribution of asymptomatic malaria to onward transmission using a 14-month longitudinal cohort of 239 participants in a high transmission site in Western Kenya. We identify P. falciparum in asymptomatically- and symptomatically-infected participants and naturally-fed mosquitoes from their households, genotype all parasites using deep sequencing of the parasite genes pfama1 and pfcsp, and use haplotypes to infer participant-to-mosquito transmission through a probabilistic model. In 1,242 infections (1,039 in people and 203 in mosquitoes), we observe 229 (pfcsp) and 348 (pfama1) unique parasite haplotypes. Using these to link human and mosquito infections, compared with symptomatic infections, asymptomatic infections more than double the odds of transmission to a mosquito among people with both infection types (Odds Ratio: 2.56; 95% Confidence Interval (CI): 1.36-4.81) and among all participants (OR 2.66; 95% CI: 2.05-3.47). Overall, 94.6% (95% CI: 93.1-95.8%) of mosquito infections likely resulted from asymptomatic infections. In high transmission areas, asymptomatic infections are the major contributor to mosquito infections and may be targeted as a component of transmission reduction.


Conflict of interest statement

The authors declare no competing interests.

Figures

Fig. 1
Fig. 1. P. falciparum infections observed across study participants and female Anopheles mosquitoes across 14 months.
Female Anopheline mosquitoes were captured weekly by vacuum aspiration and their abdomens were tested using real-time PCR for the presence (red) or absence (gray) of P. falciparum (Pf) parasites. Symptomatic malaria infections were captured by passive case detection with clinical symptoms and positive P. falciparum results by both RDT and real-time PCR (blue). The number of participants who had malaria-like symptoms and requested a symptomatic visit but did not have a confirmed symptomatic infection were also identified (gray). Asymptomatic malaria infections were captured by active case detection at monthly follow-up visits with participants and real-time PCR-positive for P. falciparum. These monthly visits were conducted in different weeks for each of the three villages, with additional re-visits if needed to sample enrolled participants who were absent for the initial visit. Monthly counts of asymptomatic malaria infections (yellow) and uninfected participants (gray) were reported.
Fig. 2
Fig. 2. Distributions of pfcsp haplotypes across and within participants and mosquitoes.
A Distribution of the 75 most common pfcsp haplotypes in mosquitoes (red), symptomatic infections (blue), and asymptomatic infections (yellow), ordered vertically by the number in the asymptomatic infections. A full plot of all 229 pfcsp haplotypes and a table of the counts for these haplotypes across sample types is in the supplement (S12 Fig and Table S6). B Multiplicity of infection (MOI) based on observed number unique pfcsp haplotypes in each mosquito abdomen (red), symptomatic infection (blue), and asymptomatic infection (yellow).
Fig. 3
Fig. 3. Comparison of the proportion of infected mosquitoes harboring a matching pfcsp haplotype for participants with both asymptomatic and symptomatic infections.
A Scatterplot of the proportion of pairings with a mosquito that shared a minimum of one haplotype for asymptomatic (y-axis) and symptomatic (x-axis) infections. Each dot is a participant who suffered at least one asymptomatic and symptomatic infection, and for participants with more than one of either type of infection, the plotted value is the median of proportions across infections within that type. Size of dots is relative to the total number of the participant’s infections. B Odds ratios of the proportion of matched mosquitoes in a multi-level logistic regression model using the continuous coding of the proportion of participant–mosquito pairings that shared haplotypes for each infection (N = 1565 participant–mosquito pairings). Data are presented as odds ratios (dots) with 95% confidence intervals (bars).
Fig. 4
Fig. 4. Modeling approach to estimate the probability of a P. falciparum transmission event to mosquitoes using the pfcsp gene target.
A Distribution of the interval in days between all possible pairings (N = 159,285) of all infected participants and mosquito abdomens. Day 0 was set as the date of the mosquito infection, and therefore negative values indicate that the mosquito was collected prior to the participant infection. The light green area indicates those pairings in which the mosquito was collected within 7 days prior to or 14 days after the participant’s infection. Subsequent analysis was restricted to these pairings. B Distribution of the distance interval between all possible pairings of infected participants and mosquito abdomens. The light green area indicates those pairings within the same village and at a maximum distance of 3 km, to which subsequent analysis was restricted. Across these pairings, a probability function was applied (Fig. S7) to upweight pairings with shorter distance intervals. The peaks result from differences in distance across the three villages. C Distribution of the estimated probabilities of transmission as a function of the number of pfcsp haplotypes shared within the participant–mosquito pair. These probabilities were estimated by upweighting pairings which shared more haplotypes and which shared haplotypes that were rare across the entire study population. D Distributions of the final estimated probabilities of transmission events stratified by symptomatic status of the participant infection. Final probabilities were computed as the product of the individual probabilities based on the time interval, distance interval, and pfcsp haplotypes of each pairing.
Fig. 5
Fig. 5. Multi-level logistic regression results for the odds of a participant-to-mosquito malaria transmission event from participants with asymptomatic compared to symptomatic infections using the pfcsp gene target.
A Odds ratios (ORs) of the probability of malaria transmission events from infected participants to mosquitoes (N = 3727 participant–mosquito pairings). ORs were computed using a multi-level logistic regression model with the probability of transmission outcome coded continuously. Values >1 indicate a factor that is associated with a greater likelihood of transmission of parasites to a mosquito, while values <1 indicate a lesser probability. Data are presented as odds ratios (dots) with 95% confidence intervals (bars). B ORs of the probability of transmission from infected participants to mosquitoes were re-estimated using multi-level logistic regression models with the outcome coded dichotomously (N = 3727 participant–mosquito pairings). Models were computed iteratively by dichotomizing the probability of transmission at increasing values from 0.00 to 0.55, thereby increasing the stringency of the definition of a transmission event. The dark yellow line indicates the OR at each dichotomized level of the probability outcome, and the shaded area indicates the 95% confidence interval around each OR. C The contribution to the infectious reservoir was calculated using the odds of transmission to mosquitoes from participants with asymptomatic compared to symptomatic infections each month. The yellow area indicates the percentage of asymptomatic infections that contributed to the infectious reservoir, whereas the blue area indicates the percentage of contribution of symptomatic infections. The dark gray line indicates the percentage of infections that were asymptomatic each month.

References

    1. World Health Organisation (WHO). World Malaria Report 2019 (WHO, 2019).
    1. Nguyen TN, et al. The persistence and oscillations of submicroscopic Plasmodium falciparum and Plasmodium vivax infections over time in Vietnam: an open cohort study. Lancet Infect. Dis. 2018;18:565–572. doi: 10.1016/S1473-3099(18)30046-X. - DOI - PMC - PubMed
    1. Bousema T, et al. Hitting hotspots: spatial targeting of malaria for control and elimination. PLoS Med. 2012;9:e1001165. doi: 10.1371/journal.pmed.1001165. - DOI - PMC - PubMed
    1. Churcher TS, et al. Predicting mosquito infection from Plasmodium falciparum gametocyte density and estimating the reservoir of infection. Elife. 2013;2:e00626. doi: 10.7554/eLife.00626. - DOI - PMC - PubMed
    1. Ouédraogo AL, et al. Substantial contribution of submicroscopical Plasmodium falciparum gametocyte carriage to the infectious reservoir in an area of seasonal transmission. PLoS ONE. 2009;4:e8410. doi: 10.1371/journal.pone.0008410. - DOI - PMC - PubMed

Publication types

MeSH terms

LinkOut - more resources