. 2021 Feb 10;11(1):3515.
doi: 10.1038/s41598-021-82852-7.

Morphometry of SARS-CoV and SARS-CoV-2 particles in ultrathin plastic sections of infected Vero cell cultures

Affiliations

Morphometry of SARS-CoV and SARS-CoV-2 particles in ultrathin plastic sections of infected Vero cell cultures

Michael Laue et al. Sci Rep. .

Abstract

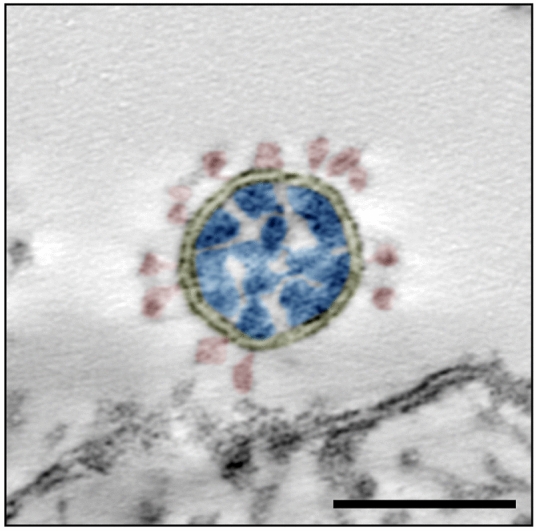
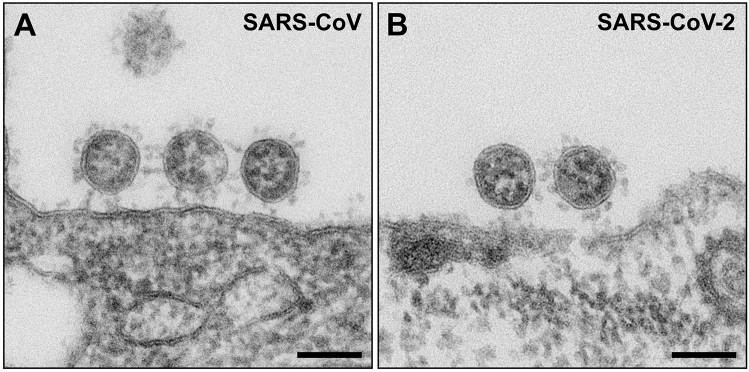
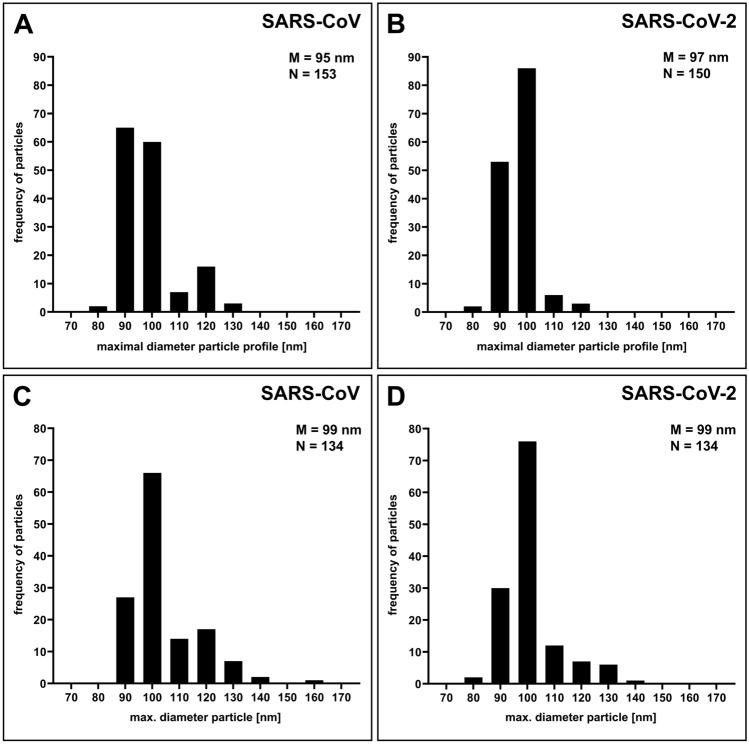
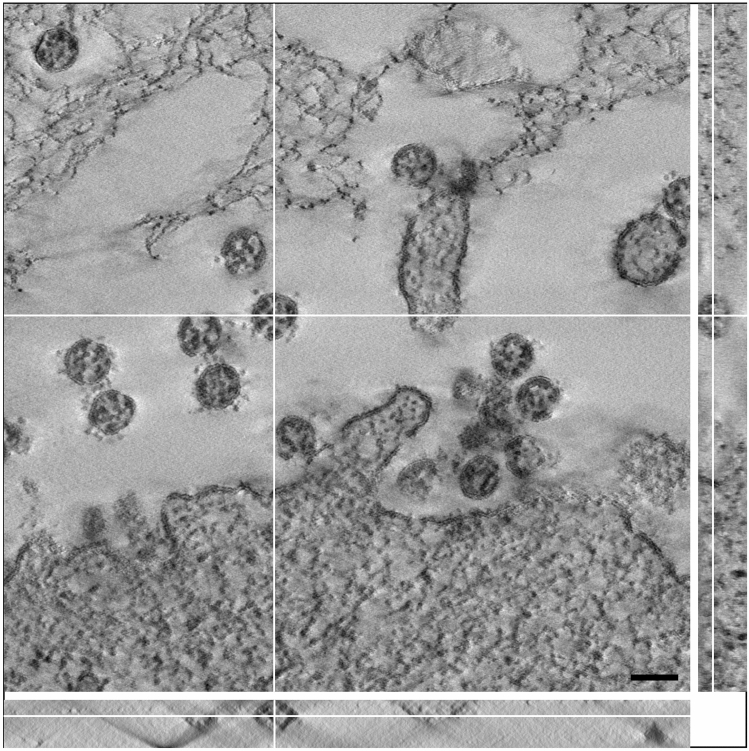
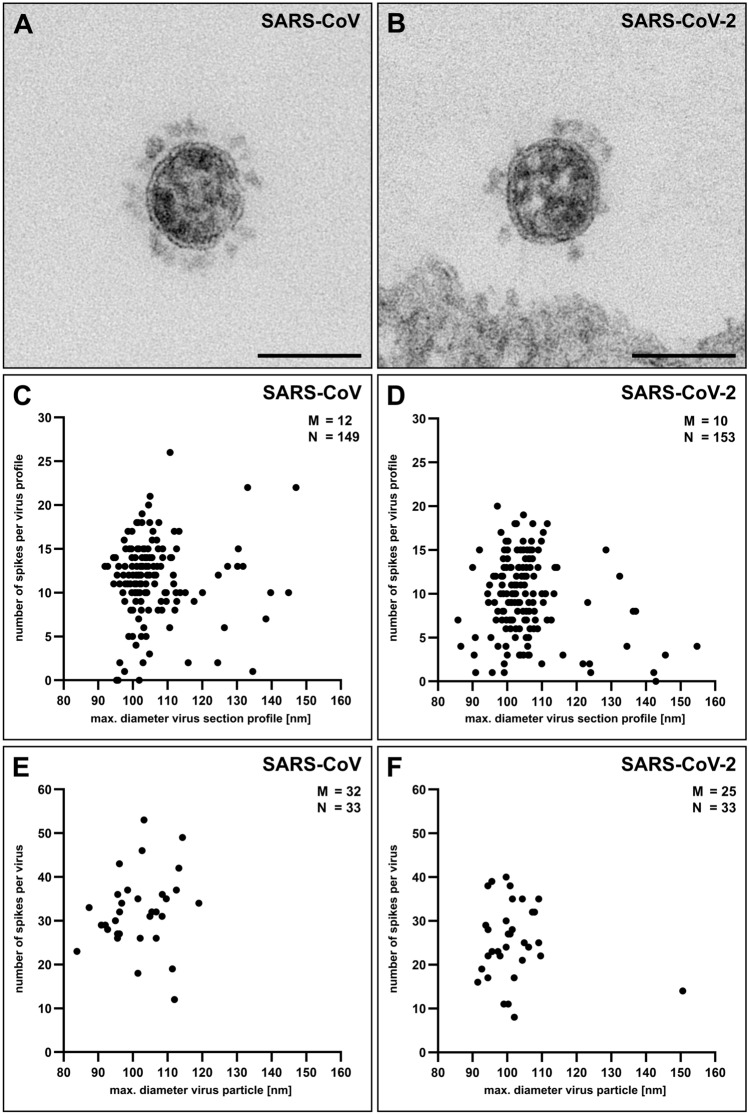
SARS-CoV-2 is the causative of the COVID-19 disease, which has spread pandemically around the globe within a few months. It is therefore necessary to collect fundamental information about the disease, its epidemiology and treatment, as well as about the virus itself. While the virus has been identified rapidly, detailed ultrastructural analysis of virus cell biology and architecture is still in its infancy. We therefore studied the virus morphology and morphometry of SARS-CoV-2 in comparison to SARS-CoV as it appears in Vero cell cultures by using conventional thin section electron microscopy and electron tomography. Both virus isolates, SARS-CoV Frankfurt 1 and SARS-CoV-2 Italy-INMI1, were virtually identical at the ultrastructural level and revealed a very similar particle size distribution with a median of about 100 nm without spikes. Maximal spike length of both viruses was 23 nm. The number of spikes per virus particle was about 30% higher in the SARS-CoV than in the SARS-CoV-2 isolate. This result complements a previous qualitative finding, which was related to a lower productivity of SARS-CoV-2 in cell culture in comparison to SARS-CoV.


Conflict of interest statement

The authors declare no competing interests.

Figures

Figure 1
Figure 1
Transmission EM of a single virus particle of SARS-CoV-2 at the surface of a Vero cell in an ultrathin plastic section (10 summed up digital slices of an electron tomogram). The section through the virus particle shows the main ultrastructural features of the virus which were manually highlighted by color: yellow = virus-enveloping membrane, red = surface projection (spike, peplomer; trimeric S protein), blue = ribonucleoprotein (N protein and RNA). Scale bar = 100 nm.
Figure 2
Figure 2
Transmission EM of ultrathin sections through Vero cells which were either infected with SARS-CoV (A), or with SARS-CoV-2 (B). Viruses are attached to the surface of the cells and do not reveal substantial differences in their ultrastructure. Scale bars = 100 nm.
Figure 3
Figure 3
Particle size distribution of SARS-CoV and SARS-CoV-2. (A, B) Histograms of maximal particle profile diameter without spikes in ultrathin (65 nm) sections (datasets 01 and 02; Table 1). (C, D) Histograms of maximal particle profile diameter without spikes in electron tomograms of thin (150–180 nm) sections (datasets 04 and 05; Table 1). Particles were measured at their thickest diameter (see Fig. 4 and Methods section). M = median; N = number of measured particles.
Figure 4
Figure 4
A single digital slice (z view) of an electron tomogram of SARS-CoV-2 particles. The ortho-slice view shows the particle labelled by the white cross lines in side view (x/z and y/z) of the volume at the indicated section plane. The particle appears ovoid in shape and the thickest part of the particle in z was selected for size measurement. Note that the section is compressed in z and thinner than the nominal 180 nm set at the microtome, which also affects the shape of the particle viewed in x/z and y/z. This artifact is well known in electron tomography of plastic sections and only slightly affects the size in x/y which our shrinkage measurements demonstrated (see Results). Scale bar = 100 nm.
Figure 5
Figure 5
Determination of the spike number of SARS-CoV and SARS-CoV-2 by transmission EM. (A, B) Single virus particles of either SARS-CoV (A) or SARS-CoV-2 (B) in ultrathin (45 nm) sections which show differences in their spike number. Scale bars = 100 nm. (C, D) Scatter plot of the number of spikes per maximal particle profile diameter of SARS-CoV (C) and SARS-CoV-2 (D) (datasets 06 and 07; Table 1) in ultrathin (45 nm) sections. (E, F) Scatter plot of the number of spikes per maximal particle diameter of SARS-CoV (E) and SARS-CoV-2 (F) (datasets 11 and 12; Table 1) in tomograms of thin (200–250 nm) sections. M = median; N = number of measured particles.

References

    1. Tang D, Comish P, Kang R. The hallmarks of COVID-19 disease. PLoS Pathog. 2020;16:e1008536. doi: 10.1371/journal.ppat.1008536. - DOI - PMC - PubMed
    1. Martines RB, et al. Pathology and pathogenesis of SARS-CoV-2 associated with fatal coronavirus disease United States. Emerg. Infect. Dis. 2020;26:2005–2015. doi: 10.3201/eid2609.202095. - DOI - PMC - PubMed
    1. Puelles VG, et al. Multiorgan and renal tropism of SARS-CoV-2. New Engl. J. Med. 2020;383:590–592. doi: 10.1056/NEJMc2011400. - DOI - PMC - PubMed
    1. Lu R, et al. Genomic characterisation and epidemiology of 2019 novel coronavirus: implications for virus origins and receptor binding. Lancet. 2020;395:565–574. doi: 10.1016/S0140-6736(20)30251-8. - DOI - PMC - PubMed
    1. Hoffmann M, et al. SARS-CoV-2 cell entry depends on ACE2 and TMPRSS2 and is blocked by a clinically proven protease inhibitor. Cell. 2020;181:271–280. doi: 10.1016/j.cell.2020.02.052. - DOI - PMC - PubMed

Publication types