. 2021 Feb 10;11(1):3477.
doi: 10.1038/s41598-021-83189-x.

PHAIR: a biosensor for pH measurement in air-liquid interface cell culture

Affiliations

PHAIR: a biosensor for pH measurement in air-liquid interface cell culture

Mohammadhossein Dabaghi et al. Sci Rep. .

Abstract

In many biological systems, pH can be used as a parameter to understand and study cell dynamics. However, measuring pH in live cell culture is limited by the sensor ion specificity, proximity to the cell surface, and scalability. Commercially available pH sensors are difficult to integrate into a small-scale cell culture system due to their size and are not cost-effective for disposable use. We made PHAIR-a new pH sensor that uses a micro-wire format to measure pH in vitro human airway cell culture. Tungsten micro-wires were used as the working electrodes, and silver micro-wires with a silver/silver chloride coating were used as a pseudo reference electrode. pH sensitivity, in a wide and narrow range, and stability of these sensors were tested in common standard buffer solutions as well as in culture media of human airway epithelial cells grown at the air-liquid interface in a 24 well cell culture plate. When measuring the pH of cells grown under basal and challenge conditions using PHAIR, cell viability and cytokine responses were not affected. Our results confirm that micro-wire-based sensors have the capacity for miniaturization and detection of diverse ions while maintaining sensitivity. This suggests the broad application of PHAIR in various biological experimental settings.


Conflict of interest statement

The authors declare no competing interests.

Figures

Scheme 1
Scheme 1
The fabrication process of miniaturized reference electrodes in a wire format: (a1a3) a 10-cm long silver wire (diameter = 250 µm) was immersed in silver/silver chloride paste for 5 min, extra paste on the wire was removed by a disposable brush, and the coated silver wire was cured in an oven at 65 °C overnight, (b1,b2) a 10-cm long silver wire was immersed in a commercial bleach or sodium hypochlorite (NaClO) solution for 5 or 10 min, rinsed rigorously with DI water, and dried at RT, and (c1c5) a 10-cm long silver wire was first chlorinated in a commercial bleach solution of NaClO for 5 min, rinsed with DI water, dried in an oven at 65 °C for 2–3 h, immersed in silver/silver chloride paste for 5 min, extra material was removed and dried in in an oven at 65 °C.
Scheme 2
Scheme 2
The fabrication process of the macro-well array: (a) the PDMS was cut and punched to create wells, (b) tungsten wires were pushed through PDMS to be placed into wells, (c) a cut (1 mm from the bottom) was made followed by treating flame activation for bonding, and (d) silver/silver chloride reference electrodes were placed in their locations and two pieces were brought in contact to initiate the bonding followed by sealing cuts using PDMS.
Figure 1
Figure 1
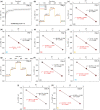
Open circuit potential (E) versus a commercial reference electrode (CRE) for tungsten (W) wires: (a) the stability testing of tungsten wires (n = 7) over 20 min in a buffer with the pH of 10, (b) real-time response of tungsten wires in 3 standard pH buffers (4, 7, and 10) after being conditioned in PBS (pH 7.4) for 1 day, (cf) the calibration curve for each wire at day one, (g) real-time response of tungsten wires in 3 standard pH buffers (4, 7, and 10) after being stored in PBS (pH 7.4) for 4 days, and (hk) the calibration curve for each wire at day four. N = 4. Red colors show the decrease in pH, and the increase in pH is shown in black color.
Figure 2
Figure 2
The stability evolution of custom-made reference electrodes: (a) real-time response of silver wires coated with silver/silver chloride paste versus a tungsten wire in a buffer with the pH of 10 for 30 min-RE1, (b) real-time response of 5-min bleached silver wires versus a tungsten wire in a buffer with the pH of 10 for 30 min-RE2, (c) real-time response of 10-min bleached silver wires versus a tungsten wire in a buffer with the pH of 10 for 30 min-RE3, and (d) real-time response of 5-min bleached silver wires + silver/silver chloride paste versus a tungsten wire in a buffer with the pH of 10 for 30 min-RE4. N = 6.
Figure 3
Figure 3
Characterization and testing of tungsten wires with custom-made chlorinated reference electrodes: (a) real-time response of silver wires undergoing 5 min of bleached (NaClO) versus a tungsten wire in a series of buffers with the pH of 10, 7, and 4 with a different conditioning treatment, (b) real-time response of 5-min bleached silver wires versus a tungsten wire in a buffer with the pH of 10 for 30 min, (c) real-time response of 5-min bleached silver wires versus a tungsten wire in standard buffers (pH 4, 7, and 10) after being conditioned in PBS for 1 day, (dh) the calibration curves for each sensor. N = 5. Red colors show the decrease in pH, and the increase in pH is shown in black color.
Figure 4
Figure 4
The long-term stability testing of tungsten wires with the custom-made reference electrodes at day 4: (a) real-time response of 5-min bleached silver wires versus a tungsten wire in standard buffers (pH 4, 7, and 10) after being stored in PBS for 4 days, (be) the calibration curves for each sensor. N = 4. Red colors show the decrease in pH, and the increase in pH is shown in black color.
Figure 5
Figure 5
The pH sensitivity of tungsten wires and the custom-made reference electrodes for measuring pH in a narrower range: (a) Real-time response of 5-min bleached (NaClO) silver wires versus a tungsten wire in a different set of buffers with a narrower pH range after being conditioned for 1 h in DI water, (be) the calibration curves for each sensor. N = 4. Red colors show the decrease in pH, and the increase in pH is shown in black color.
Figure 6
Figure 6
In vitro studies of wire format sensors placed in an array of macro wells: (a) the schematic and dimensions of macro wells, (b) real-time response of 5-min bleached silver wires versus a tungsten wire in cell culture medium without bicarbonate and adjusted pH after being conditioned in PBS for 1 day, (ce) the calibration curves for each sensor, (fh) in vitro viability assay of Calu-3 cells cultured in PDMS macro wells without the present of wire sensors, and (ik) in vitro viability assay of Calu-3 cells cultured in PDMS macro wells with the present of wire sensors. N = 3. Red colors show the decrease in pH, and the increase in pH is shown in black color.
Figure 7
Figure 7
In vitro studies of wire format sensors placed in an array of macro wells: (a) cytotoxicity of wire-format sensors adjacent cells using LDH assay, (b) the production of IL-8, and (c) the production of IL-6. The error bars are standard deviations.
Figure 8
Figure 8
(a) a schematic of the 3D-printed holder for bringing wire sensors in tough with the apical testing solution with a close-up view of the micro-wires at ALI, (b) real-time response of 5-min bleached silver wires versus a tungsten wire in home-made Ringer’s solution without any buffer with various pH after being conditioned in PBS for 1 day, (c) the calibration curve for the sensor (decrease in pH is shown by red colors and increase in pH is indicated by black color.), (d) the experimental setup for measuring pH of the apical solution in Transwell insert after being treated by DMSO or DMSO + Forskolin, (e) a comparison between the measured pH by the wire sensor and a commercial pH electrode (apical solutions were collected and pH of them were measured later by the commercial pH meter), and in vitro viability assay of Calu-3 cells treated by (f) DMSO or (g) DMSO + Forskolin. Scale bars are 1 cm.

Similar articles

Cited by

References

    1. Ghosh S, Chang YF, Yang DM, Chattopadhyay S. Upconversion nanoparticle-mOrange protein FRET nanoprobes for self-ratiometric/ratiometric determination of intracellular pH, and single cell pH imaging. Biosens. Bioelectron. 2020;155:112115. doi: 10.1016/j.bios.2020.112115. - DOI - PubMed
    1. Sun F, et al. Functionalized plasmonic nanostructure arrays for direct and accurate mapping extracellular pH of living cells in complex media using SERS. Biosens. Bioelectron. 2015;73:202–207. doi: 10.1016/j.bios.2015.05.060. - DOI - PubMed
    1. Sakata T, Sugimoto H, Saito A. Live monitoring of microenvironmental ph based on extracellular acidosis around cancer cells with cell-coupled gate ion-sensitive field-effect transistor. Anal. Chem. 2018;90:12731–12736. doi: 10.1021/acs.analchem.8b03070. - DOI - PubMed
    1. McBeth C, Dughaishi RA, Paterson A, Sharp D. Ubiquinone modified printed carbon electrodes for cell culture pH monitoring. Biosens. Bioelectron. 2018;113:46–51. doi: 10.1016/j.bios.2018.04.052. - DOI - PubMed
    1. Ges IA, et al. Thin-film IrOxpH microelectrode for microfluidic-based microsystems. Biosens. Bioelectron. 2005;21:248–256. doi: 10.1016/j.bios.2004.09.021. - DOI - PubMed

Publication types

LinkOut - more resources