

Optimal control of the COVID-19 pandemic: controlled sanitary deconfinement in Portugal
- PMID: 33568716
- PMCID: PMC7876047
- DOI: 10.1038/s41598-021-83075-6
Optimal control of the COVID-19 pandemic: controlled sanitary deconfinement in Portugal
Abstract
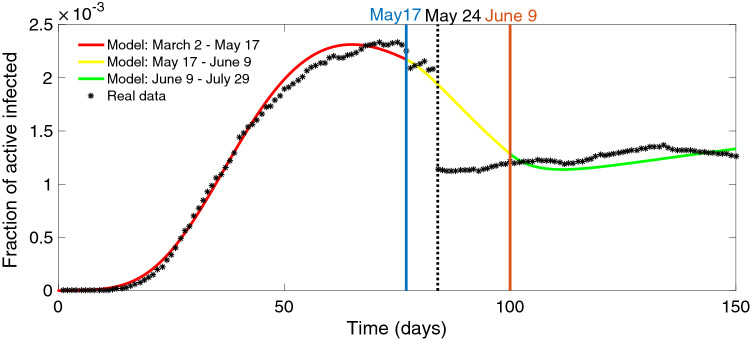
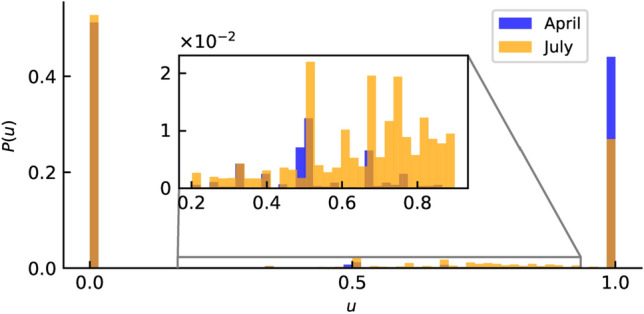
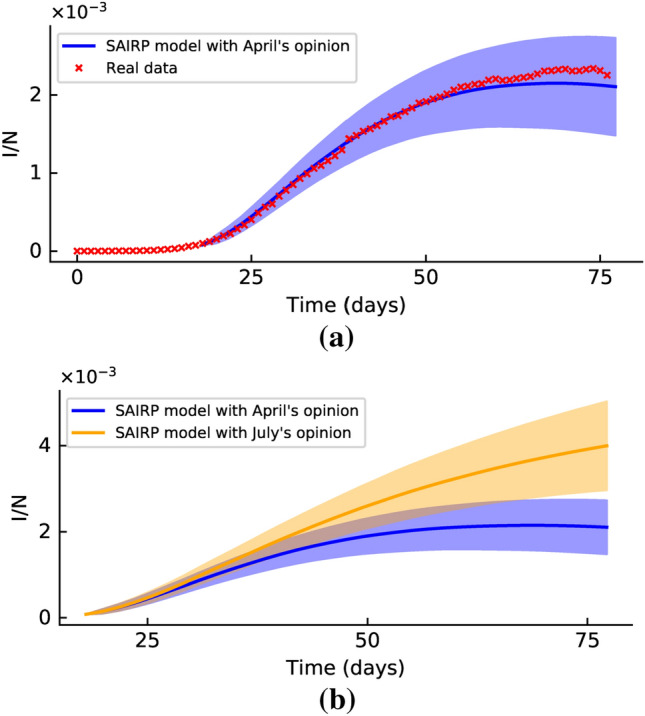
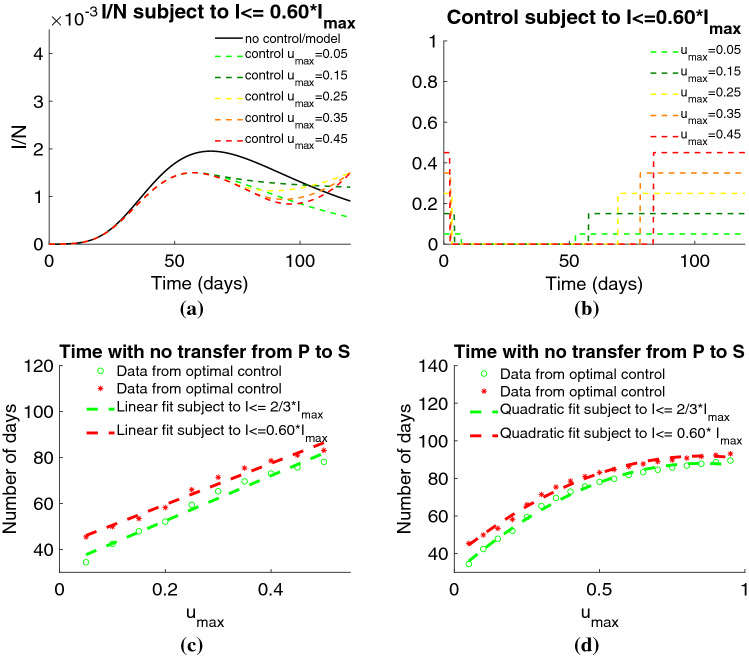
The COVID-19 pandemic has forced policy makers to decree urgent confinements to stop a rapid and massive contagion. However, after that stage, societies are being forced to find an equilibrium between the need to reduce contagion rates and the need to reopen their economies. The experience hitherto lived has provided data on the evolution of the pandemic, in particular the population dynamics as a result of the public health measures enacted. This allows the formulation of forecasting mathematical models to anticipate the consequences of political decisions. Here we propose a model to do so and apply it to the case of Portugal. With a mathematical deterministic model, described by a system of ordinary differential equations, we fit the real evolution of COVID-19 in this country. After identification of the population readiness to follow social restrictions, by analyzing the social media, we incorporate this effect in a version of the model that allow us to check different scenarios. This is realized by considering a Monte Carlo discrete version of the previous model coupled via a complex network. Then, we apply optimal control theory to maximize the number of people returning to "normal life" and minimizing the number of active infected individuals with minimal economical costs while warranting a low level of hospitalizations. This work allows testing various scenarios of pandemic management (closure of sectors of the economy, partial/total compliance with protection measures by citizens, number of beds in intensive care units, etc.), ensuring the responsiveness of the health system, thus being a public health decision support tool.
Conflict of interest statement
The authors declare no competing interests.
Figures
References
-
- COVID-19 Coronavirus Pandemic. https://www.worldometers.info/coronavirus/ (2020).
-
- República Portuguesa, Ministério da Educação, XXII Governo. Comunicação enviada às escolas sobre suspensão das atividades com alunos nas escolas de 16 de março a 13 de abril. https://www.portugal.gov.pt/pt/gc22/comunicacao/documento?i=comunicacao-... (2020).
-
- Capacidade de Medicina Intensiva aumentou 23%. https://covid19.min-saude.pt/capacidade-de-medicina-intensiva-aumentou-23/ (2020).
-
- Metcalf CJE, Morris DH, Park SW. Mathematical models to guide pandemic response. Science. 2020;369:368–369. - PubMed
Publication types
MeSH terms
Grants and funding
LinkOut - more resources
Full Text Sources
Other Literature Sources
Medical
