. 2021 Feb 10;4(1):179.
doi: 10.1038/s42003-021-01699-w.

DeepACSON automated segmentation of white matter in 3D electron microscopy

Affiliations

DeepACSON automated segmentation of white matter in 3D electron microscopy

Ali Abdollahzadeh et al. Commun Biol. .

Abstract

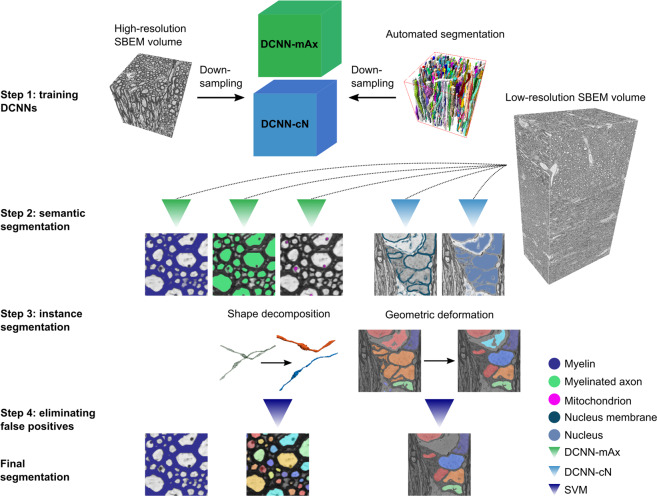
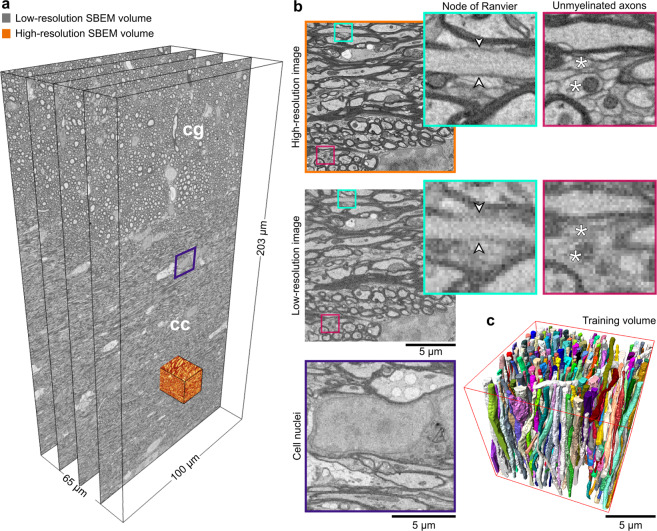
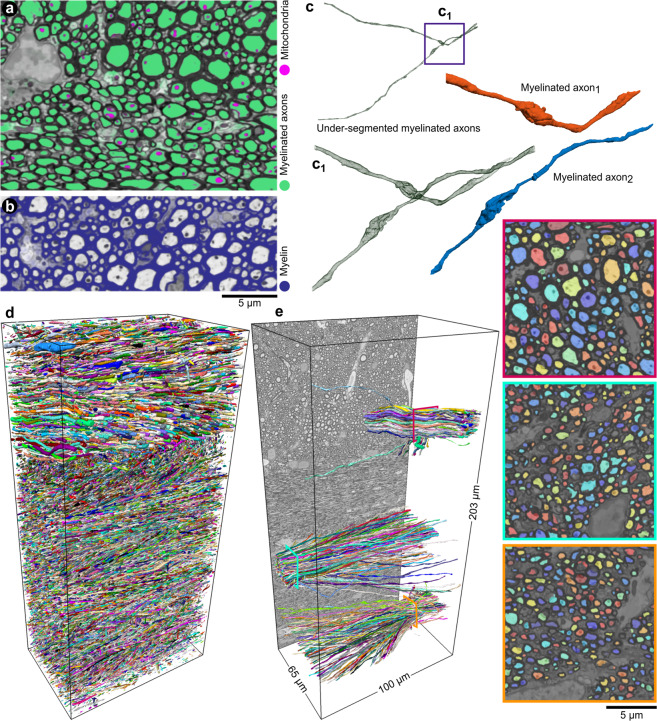
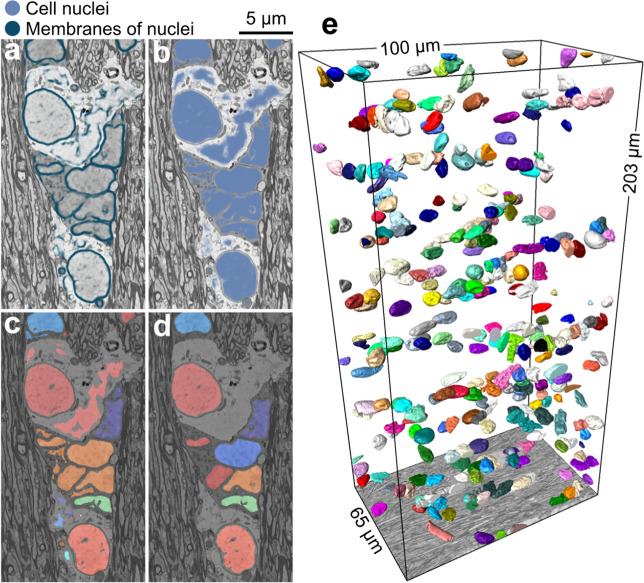
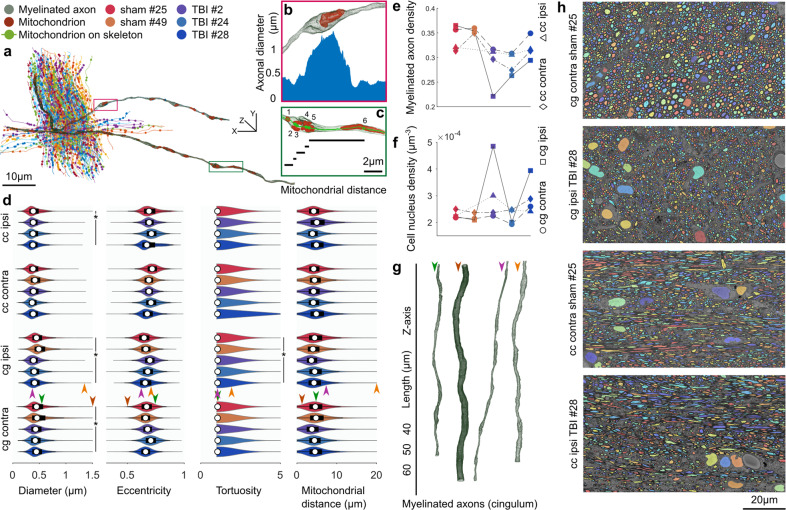
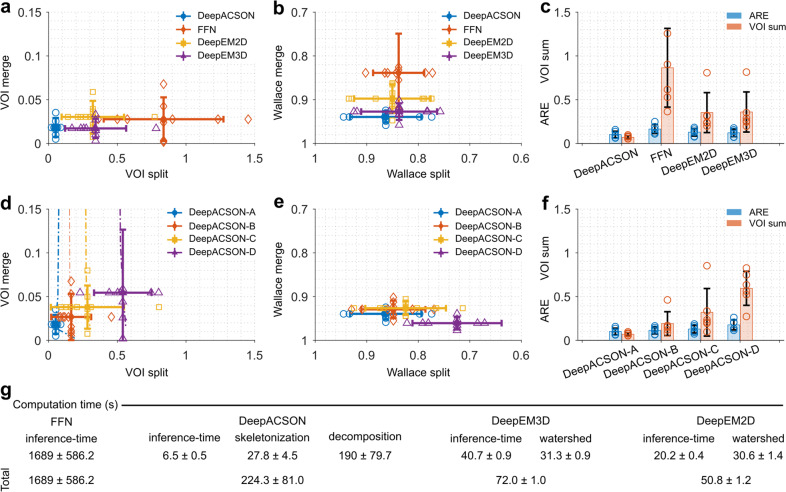
Tracing the entirety of ultrastructures in large three-dimensional electron microscopy (3D-EM) images of the brain tissue requires automated segmentation techniques. Current segmentation techniques use deep convolutional neural networks (DCNNs) and rely on high-contrast cellular membranes and high-resolution EM volumes. On the other hand, segmenting low-resolution, large EM volumes requires methods to account for severe membrane discontinuities inescapable. Therefore, we developed DeepACSON, which performs DCNN-based semantic segmentation and shape-decomposition-based instance segmentation. DeepACSON instance segmentation uses the tubularity of myelinated axons and decomposes under-segmented myelinated axons into their constituent axons. We applied DeepACSON to ten EM volumes of rats after sham-operation or traumatic brain injury, segmenting hundreds of thousands of long-span myelinated axons, thousands of cell nuclei, and millions of mitochondria with excellent evaluation scores. DeepACSON quantified the morphology and spatial aspects of white matter ultrastructures, capturing nanoscopic morphological alterations five months after the injury.


Conflict of interest statement

The authors declare that they have no conflict of interest.

Figures

Fig. 1
Fig. 1. DeepACSON pipeline.
Step 1: We used the ACSON segmentation of the high-resolution (small field-of-view) SBEM images down-sampled to the resolution of the low-resolution (large field-of-view) images to train DeepACSON. We trained two DCNNs denoted as DCNN-mAx and DCNN-cN. Step 2: DCNN-mAx returned the probability maps of myelin, myelinated axons, and mitochondria. DCNN-cN returned the probability maps of cell nuclei and the membrane of cell nuclei. Step 3: The segmentation of myelin was finalized by thresholding the myelin probability map. We performed the initial segmentation of myelinated axons by the binarization and connected component analysis. The geometry of the segmented components was subsequently rectified using our newly developed cylindrical shape decomposition (CSD) technique. We performed the segmentation of cell nuclei in a geometric deformable model (GDM) framework by applying elastic deformations to the initial segmentation of cell nuclei. Step 4: The segmentation of myelinated axons and cell nuclei was finalized by eliminating non-axonal and non-nucleus structures using support vector machines (SVMs).
Fig. 2
Fig. 2. Low- and high-resolution SBEM imaging of the contralateral corpus callosum and cingulum of a sham rat.
a We acquired SBEM images of the white matter, corpus callosum (cc) and cingulum (cg), simultaneously at the high- and low-resolution. The field-of-view of the low-resolution dataset is 204.80 × 102.20 × 65.30 μm3 equivalent to 4096 × 2044 × 1306 voxels in x, y, and z directions, respectively, which is approximately 400 times larger than the field-of-view of the high-resolution datasets. b Images of the low- and high-resolution datasets acquired from the same location (the orange-rendered volume in a). The visualization of the high- and low-resolution images shows that myelin, myelinated axons, mitochondria, and cell nuclei were resolved in both settings. In contrast, the axonal membrane at nodes of Ranvier (cyan panel, arrowheads) and unmyelinated axons (fuchsia panel, asterisks) was only resolved in the high-resolution images. The purple panel shows a cell nucleus from the low-resolution dataset (a), where the membrane was resolved, but not continuously. c A 3D rendering of myelinated axons in the high-resolution SBEM dataset (contralateral sham #25) segmented by the automated ACSON pipeline.
Fig. 3
Fig. 3. DeepACSON segmentation of myelin, myelinated axons, and mitochondria.
a, b The probability maps of myelinated axons, mitochondria, and myelin returned from DCNN-mAx, overlaid on their corresponding BM4D filtered images. c The CSD algorithm decomposed myelinated axons with erroneous merges. d 3D rendering of DeepACSON final segmentation of myelinated axons (at one-third of the original resolution) in the contralateral corpus callosum and cingulum of sham #25 low-resolution dataset. e 3D rendering of myelinated axons sampled at the corpus callosum and cingulum illustrates the variance of the axonal diameter among myelinated axons and the orientation dispersion in these bundles.
Fig. 4
Fig. 4. DeepACSON segmentation of cell nuclei.
a, b The probability maps of cell nuclei and their membrane were returned from DCNN-cN and overlaid on their corresponding BM4D filtered images. c The initial segmentation of cell nuclei contained topological errors as the membrane of cell nuclei exhibited discontinuity. d We rectified the segmentation of cell nuclei in a GDM framework and excluded non-nucleus instances by an SVM with a quadratic kernel. e 3D rendering of cell nuclei in the contralateral corpus callosum and cingulum of sham #25 dataset.
Fig. 5
Fig. 5. White matter morphology analysis.
a A bundle of myelinated axons was sampled from the cingulum of the sham #25 dataset. Myelinated axons are represented by their curve skeletons. The centroids of mitochondria were projected on the axonal skeletons, shown as filled-circles. b A small section of a myelinated axon from a represents how the axonal diameter can vary substantially along its length. The increased axonal diameter can be related to the accumulation of mitochondria. The plot shows the axonal diameter along the magnified section of the myelinated axon. c A small section of a myelinated axon from a shows the measure of inter-mitochondrial distance. Five mitochondria are accumulated with distances less than 1 μm, and one mitochondrion is distant from others with over 5 μm distance. d DeepACSON quantified the axonal diameter, eccentricity, and tortuosity of about 288 000 myelinated axons and the inter-mitochondrial distance of about 1 800 000 mitochondria. On each bean plot, the central mark indicates the median, and the left and right edges of the box indicate the 25th and 75th percentiles, respectively. The whiskers extend to the most extreme data points not considered outliers. The colors correspond with the animal ID. e The comparison of the density of myelinated axons, as the ratio of the volume of myelinated axons to the myelin volume plus the volume of myelinated axons. The color of the indicators corresponds with the animal ID. f The comparison of the density of cells, as the number of cell nuclei over the dataset volume. The color of the indicators corresponds with the animal ID. DeepACSON segmented about 2 600 cell nuclei in the ten large field-of-view datasets. g 3D rendering of myelinated axons from the cingulum visualizes the normative and outliers of the axonal diameter distribution. Each myelinated axon is given an arrowhead to mark its measurements in panel d. h Representative images of the cingulum and corpus callosum in sham-operated and TBI rats visualize the smaller density of myelinated axons caused by the injury.
Fig. 6
Fig. 6. DeepACSON quantitative evaluations.
Comparison of DeepACSON against state-of-the-art segmentation methods, DeepEM2D, DeepEM3D, and FFN, using a variation of information (VOI, split and merge contribution, lower value is better), b Wallace indices (split and merge contribution, higher value is better), and c adapted Rand error (ARE, lower value is better) and the sum of VOI split and VOI merge (VOI sum, lower value is better). DeepACSON outperformed other techniques as it produced the smallest VOI split, VOI merge, VOI sum, and ARE, and the biggest Wallace split and merge values. Comparison of the design parameters of DeepACSON: standard DeepACSON (DeepACSON-A), a U-Net with residual modules (DeepACSON-B), the effect of BM4D denoising (DeepACSON-C), and adjusting the resolution between the training and test sets (DeepACSON-D) over d VOI (split and merge contribution) e Wallace indices (split and merge contribution), and f ARE and VOI sum. The filled-circles and error bars show the mean and standard deviation of the evaluations, respectively. The dash-dotted lines show the choice of binarization threshold. The comparisons were run over the best threshold, i.e., smallest VOI merge and VOI split. g Comparison of the computation time of DeepACSON against DeepEM2D/3D and FFN (mean ± standard deviation). All comparisons were run over six test SBEM datasets of size 290 × 290 × 285 voxel3, automatically segmented using the ACSON pipeline.

References

    1. Hildebrand DGC, et al. Whole-brain serial-section electron microscopy in larval zebrafish. Nature. 2017;545:345–349. doi: 10.1038/nature22356. - DOI - PMC - PubMed
    1. Zheng Z, et al. A complete electron microscopy volume of the brain of adult Drosophila melanogaster. Cell. 2018;174:730–743. doi: 10.1016/j.cell.2018.06.019. - DOI - PMC - PubMed
    1. Maniates-Selvin, J. T. et al. Reconstruction of motor control circuits in adult Drosophila using automated transmission electron microscopy. 10.1101/2020.01.10.902478 (2020). - PMC - PubMed
    1. Berning M, Boergens KM, Helmstaedter M. SegEM: efficient image analysis for high-resolution connectomics. Neuron. 2015;87:1193–1206. doi: 10.1016/j.neuron.2015.09.003. - DOI - PubMed
    1. Abdollahzadeh A, Belevich I, Jokitalo E, Tohka J, Sierra A. Automated 3D axonal morphometry of white matter. Sci. Rep. 2019;9:6084. doi: 10.1038/s41598-019-42648-2. - DOI - PMC - PubMed

Publication types