

Metabolic activation and colitis pathogenesis is prevented by lymphotoxin β receptor expression in neutrophils
- PMID: 33568785
- PMCID: PMC8075978
- DOI: 10.1038/s41385-021-00378-7
Metabolic activation and colitis pathogenesis is prevented by lymphotoxin β receptor expression in neutrophils
Abstract
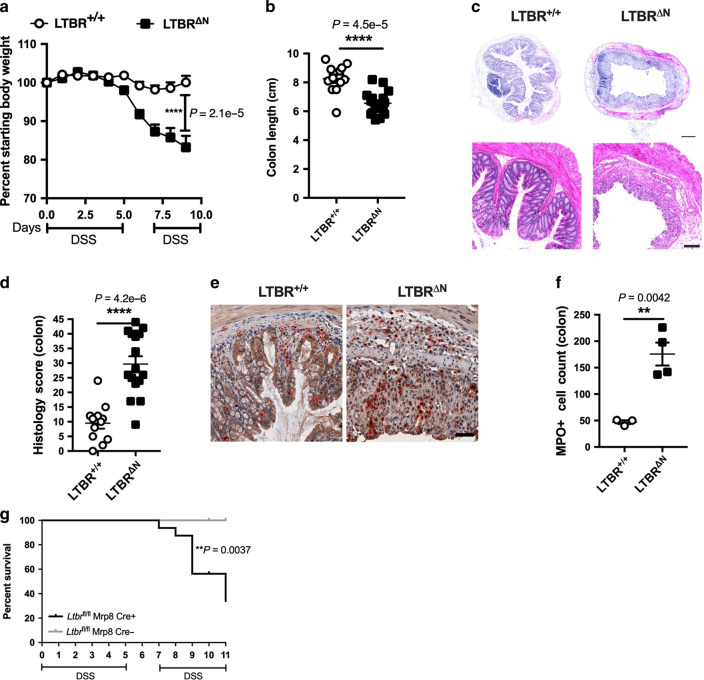
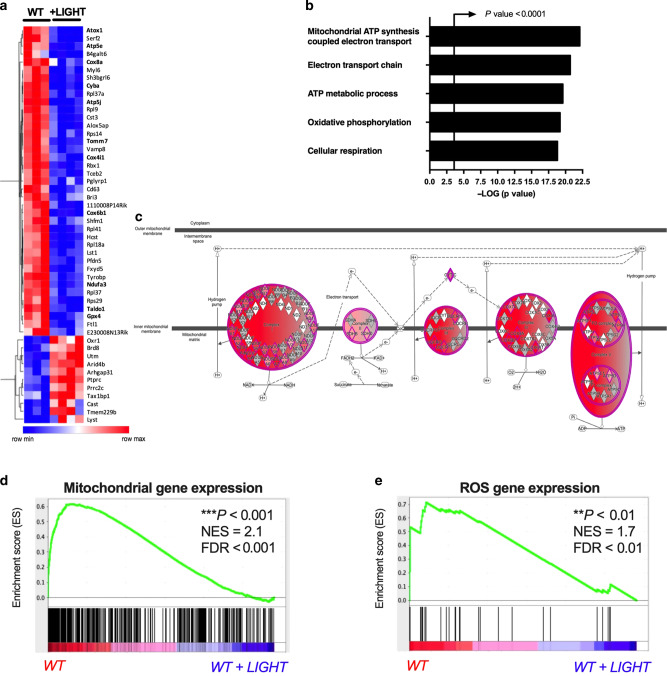
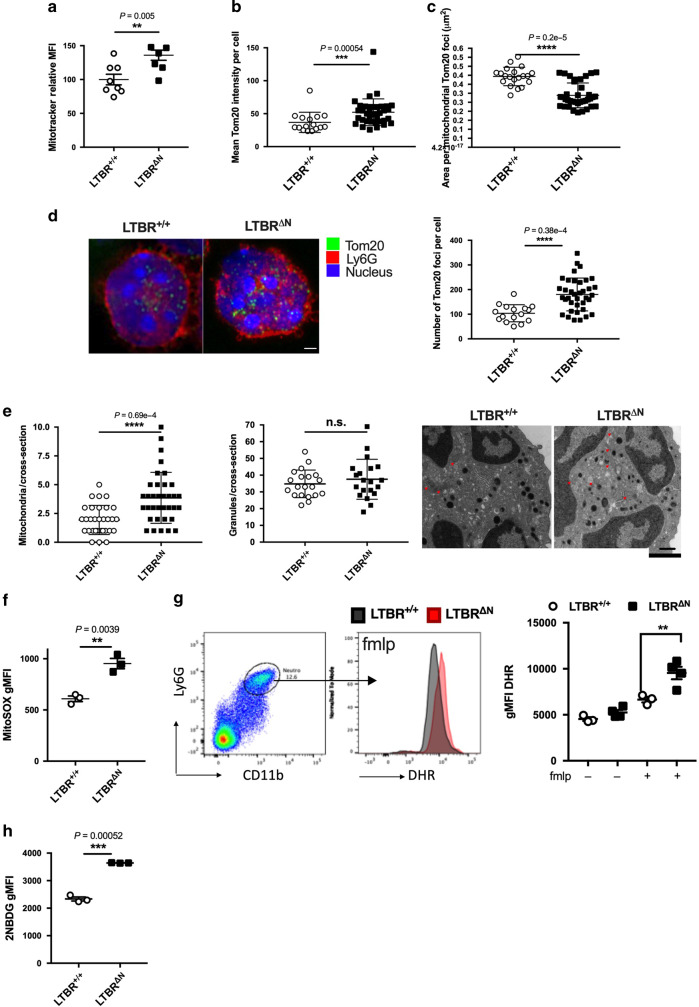
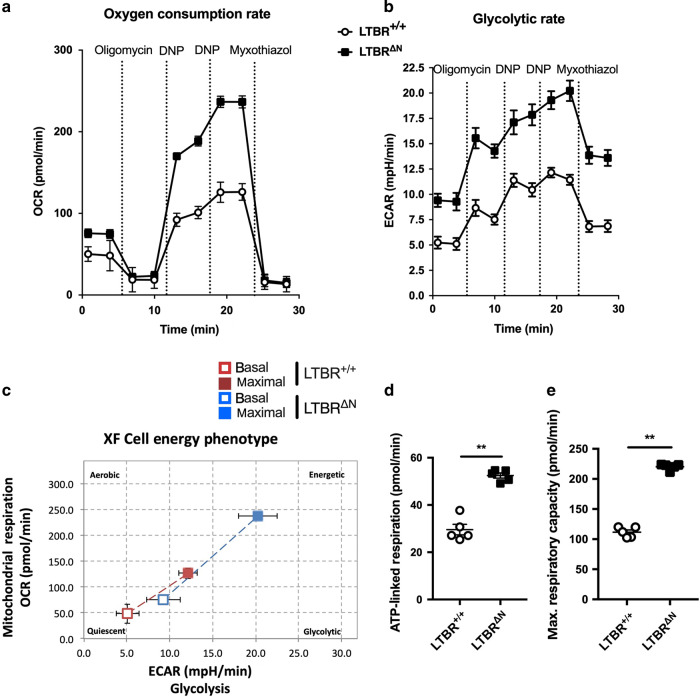
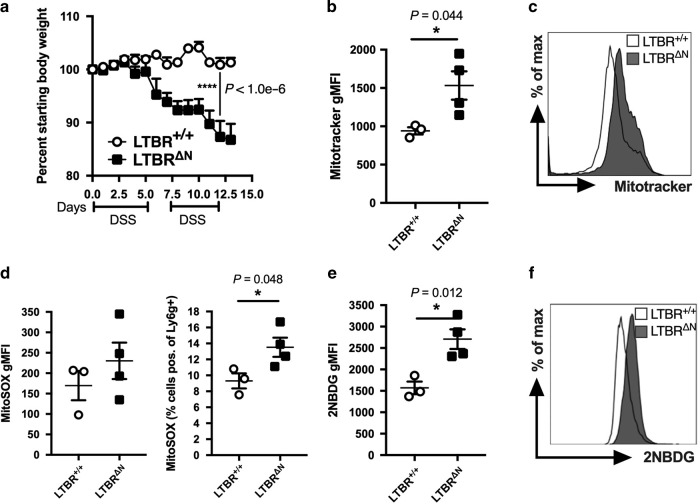
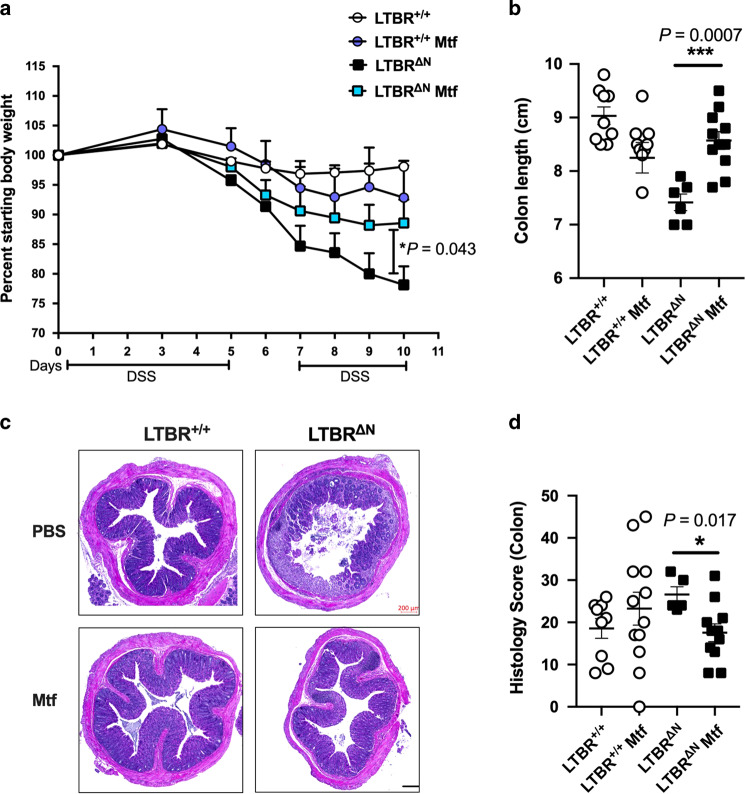
Inflammatory bowel disease is characterized by an exacerbated intestinal immune response, but the critical mechanisms regulating immune activation remain incompletely understood. We previously reported that the TNF-superfamily molecule TNFSF14 (LIGHT) is required for preventing severe disease in mouse models of colitis. In addition, deletion of lymphotoxin beta receptor (LTβR), which binds LIGHT, also led to aggravated colitis pathogenesis. Here, we aimed to determine the cell type(s) requiring LTβR and the mechanism critical for exacerbation of colitis. Specific deletion of LTβR in neutrophils (LTβRΔN), but not in several other cell types, was sufficient to induce aggravated colitis and colonic neutrophil accumulation. Mechanistically, RNA-Seq analysis revealed LIGHT-induced suppression of cellular metabolism, and mitochondrial function, that was dependent on LTβR. Functional studies confirmed increased mitochondrial mass and activity, associated with excessive mitochondrial ROS production and elevated glycolysis at steady-state and during colitis. Targeting these metabolic changes rescued exacerbated disease severity. Our results demonstrate that LIGHT signals to LTβR on neutrophils to suppress metabolic activation and thereby prevents exacerbated immune pathogenesis during colitis.
Conflict of interest statement
The authors declare no competing interests.
Figures
Similar articles
-
The Tumor Necrosis Factor Superfamily Members TNFSF14 (LIGHT), Lymphotoxin β and Lymphotoxin β Receptor Interact to Regulate Intestinal Inflammation.Front Immunol. 2018 Nov 22;9:2585. doi: 10.3389/fimmu.2018.02585. eCollection 2018. Front Immunol. 2018. PMID: 30524422 Free PMC article.
-
The tumor necrosis factor family member TNFSF14 (LIGHT) is required for resolution of intestinal inflammation in mice.Gastroenterology. 2014 Jun;146(7):1752-62.e4. doi: 10.1053/j.gastro.2014.02.010. Epub 2014 Feb 19. Gastroenterology. 2014. PMID: 24560868 Free PMC article.
-
Lymphotoxin-beta receptor activation on macrophages ameliorates acute DSS-induced intestinal inflammation in a TRIM30α-dependent manner.Mol Immunol. 2012 Jun;51(2):128-35. doi: 10.1016/j.molimm.2012.02.118. Epub 2012 Mar 20. Mol Immunol. 2012. PMID: 22437076
-
The signaling networks of the herpesvirus entry mediator (TNFRSF14) in immune regulation.Immunol Rev. 2011 Nov;244(1):169-87. doi: 10.1111/j.1600-065X.2011.01064.x. Immunol Rev. 2011. PMID: 22017438 Free PMC article. Review.
-
Context-dependent roles for lymphotoxin-β receptor signaling in cancer development.Biochim Biophys Acta. 2016 Apr;1865(2):204-19. doi: 10.1016/j.bbcan.2016.02.005. Epub 2016 Feb 27. Biochim Biophys Acta. 2016. PMID: 26923876 Review.
Cited by
-
LTβR overexpression promotes plasma cell accumulation.PLoS One. 2022 Aug 4;17(8):e0270907. doi: 10.1371/journal.pone.0270907. eCollection 2022. PLoS One. 2022. PMID: 35925983 Free PMC article.
-
Pogostemon cablin Acts as a Key Regulator of NF-κB Signaling and Has a Potent Therapeutic Effect on Intestinal Mucosal Inflammation.Mediators Inflamm. 2025 Apr 28;2025:9000672. doi: 10.1155/mi/9000672. eCollection 2025. Mediators Inflamm. 2025. PMID: 40331148 Free PMC article. Review.
-
Not just sugar: metabolic control of neutrophil development and effector functions.J Leukoc Biol. 2024 Sep 2;116(3):487-510. doi: 10.1093/jleuko/qiae057. J Leukoc Biol. 2024. PMID: 38450755 Free PMC article. Review.
-
Modulation of immune cell function, IDO expression and kynurenine production by the quorum sensor 2-heptyl-3-hydroxy-4-quinolone (PQS).Front Immunol. 2022 Oct 28;13:1001956. doi: 10.3389/fimmu.2022.1001956. eCollection 2022. Front Immunol. 2022. PMID: 36389710 Free PMC article.
-
Tumor Necrosis Factor Superfamily 14 (LIGHT) Restricts Neovascularization by Decreasing Circulating Endothelial Progenitor Cells and Function.Int J Mol Sci. 2023 Apr 10;24(8):6997. doi: 10.3390/ijms24086997. Int J Mol Sci. 2023. PMID: 37108160 Free PMC article.
References
Publication types
MeSH terms
Substances
Grants and funding
- S10 RR027366/RR/NCRR NIH HHS/United States
- F32 AI140581/AI/NIAID NIH HHS/United States
- R01 AI061516/AI/NIAID NIH HHS/United States
- J 4308/FWF_/Austrian Science Fund FWF/Austria
- 210842/Z/18/Z/WT_/Wellcome Trust/United Kingdom
- T32 AI125179/AI/NIAID NIH HHS/United States
- R21 AI135574/AI/NIAID NIH HHS/United States
- S10 OD021831/OD/NIH HHS/United States
- P01 DK046763/DK/NIDDK NIH HHS/United States
- 210842_Z_18_Z/WT_/Wellcome Trust/United Kingdom
- U01 AI125955/AI/NIAID NIH HHS/United States
- R01 AI105215/AI/NIAID NIH HHS/United States
LinkOut - more resources
Full Text Sources
Other Literature Sources
Molecular Biology Databases
