. 2021 Feb;590(7846):457-462.
doi: 10.1038/s41586-021-03201-2. Epub 2021 Feb 10.

In situ mapping identifies distinct vascular niches for myelopoiesis

Affiliations

In situ mapping identifies distinct vascular niches for myelopoiesis

Jizhou Zhang et al. Nature. 2021 Feb.

Abstract

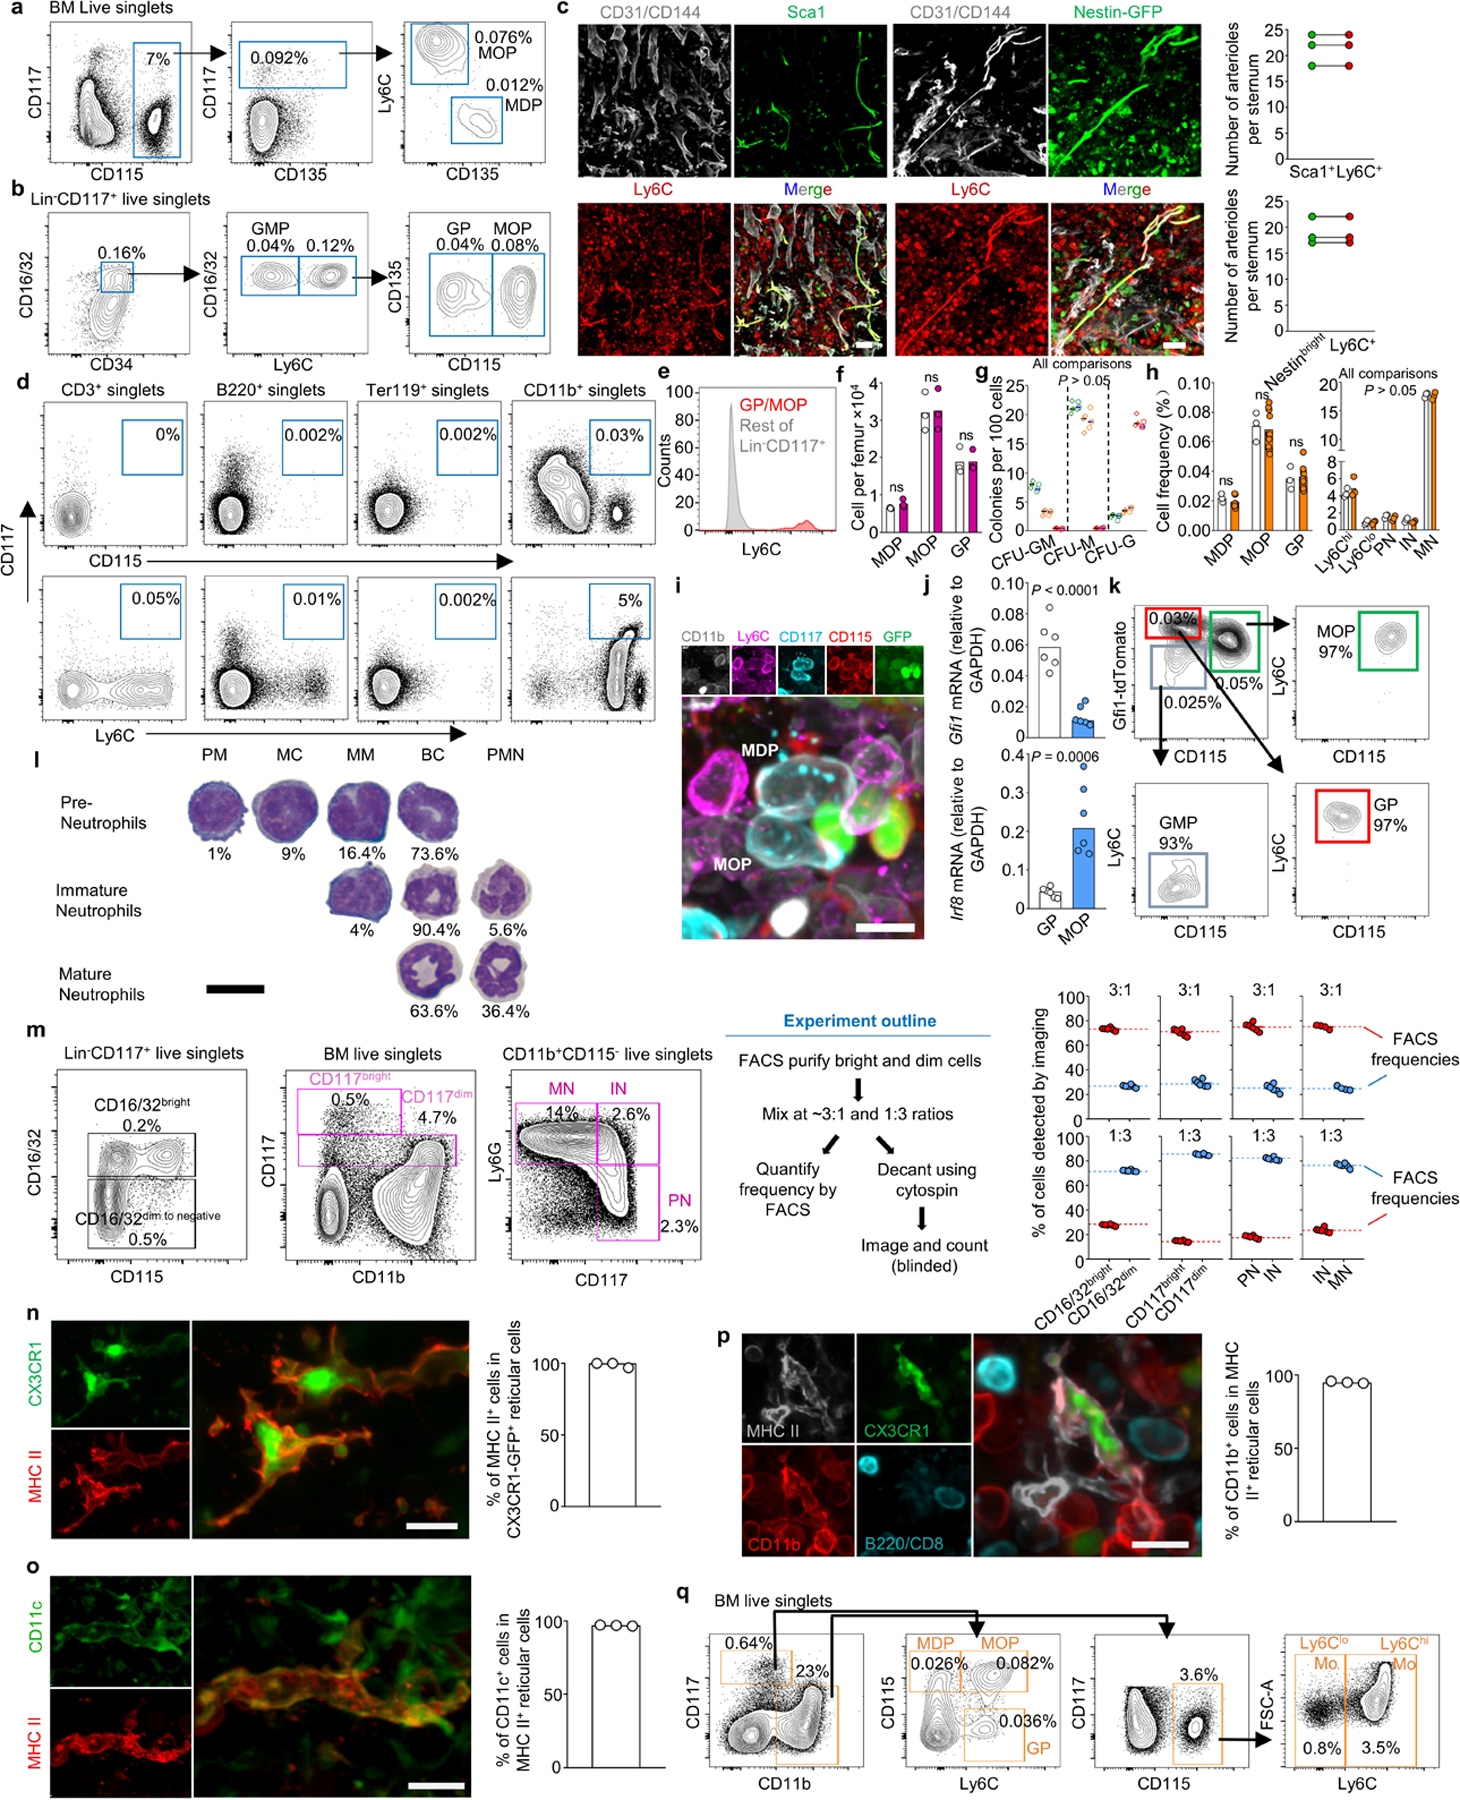
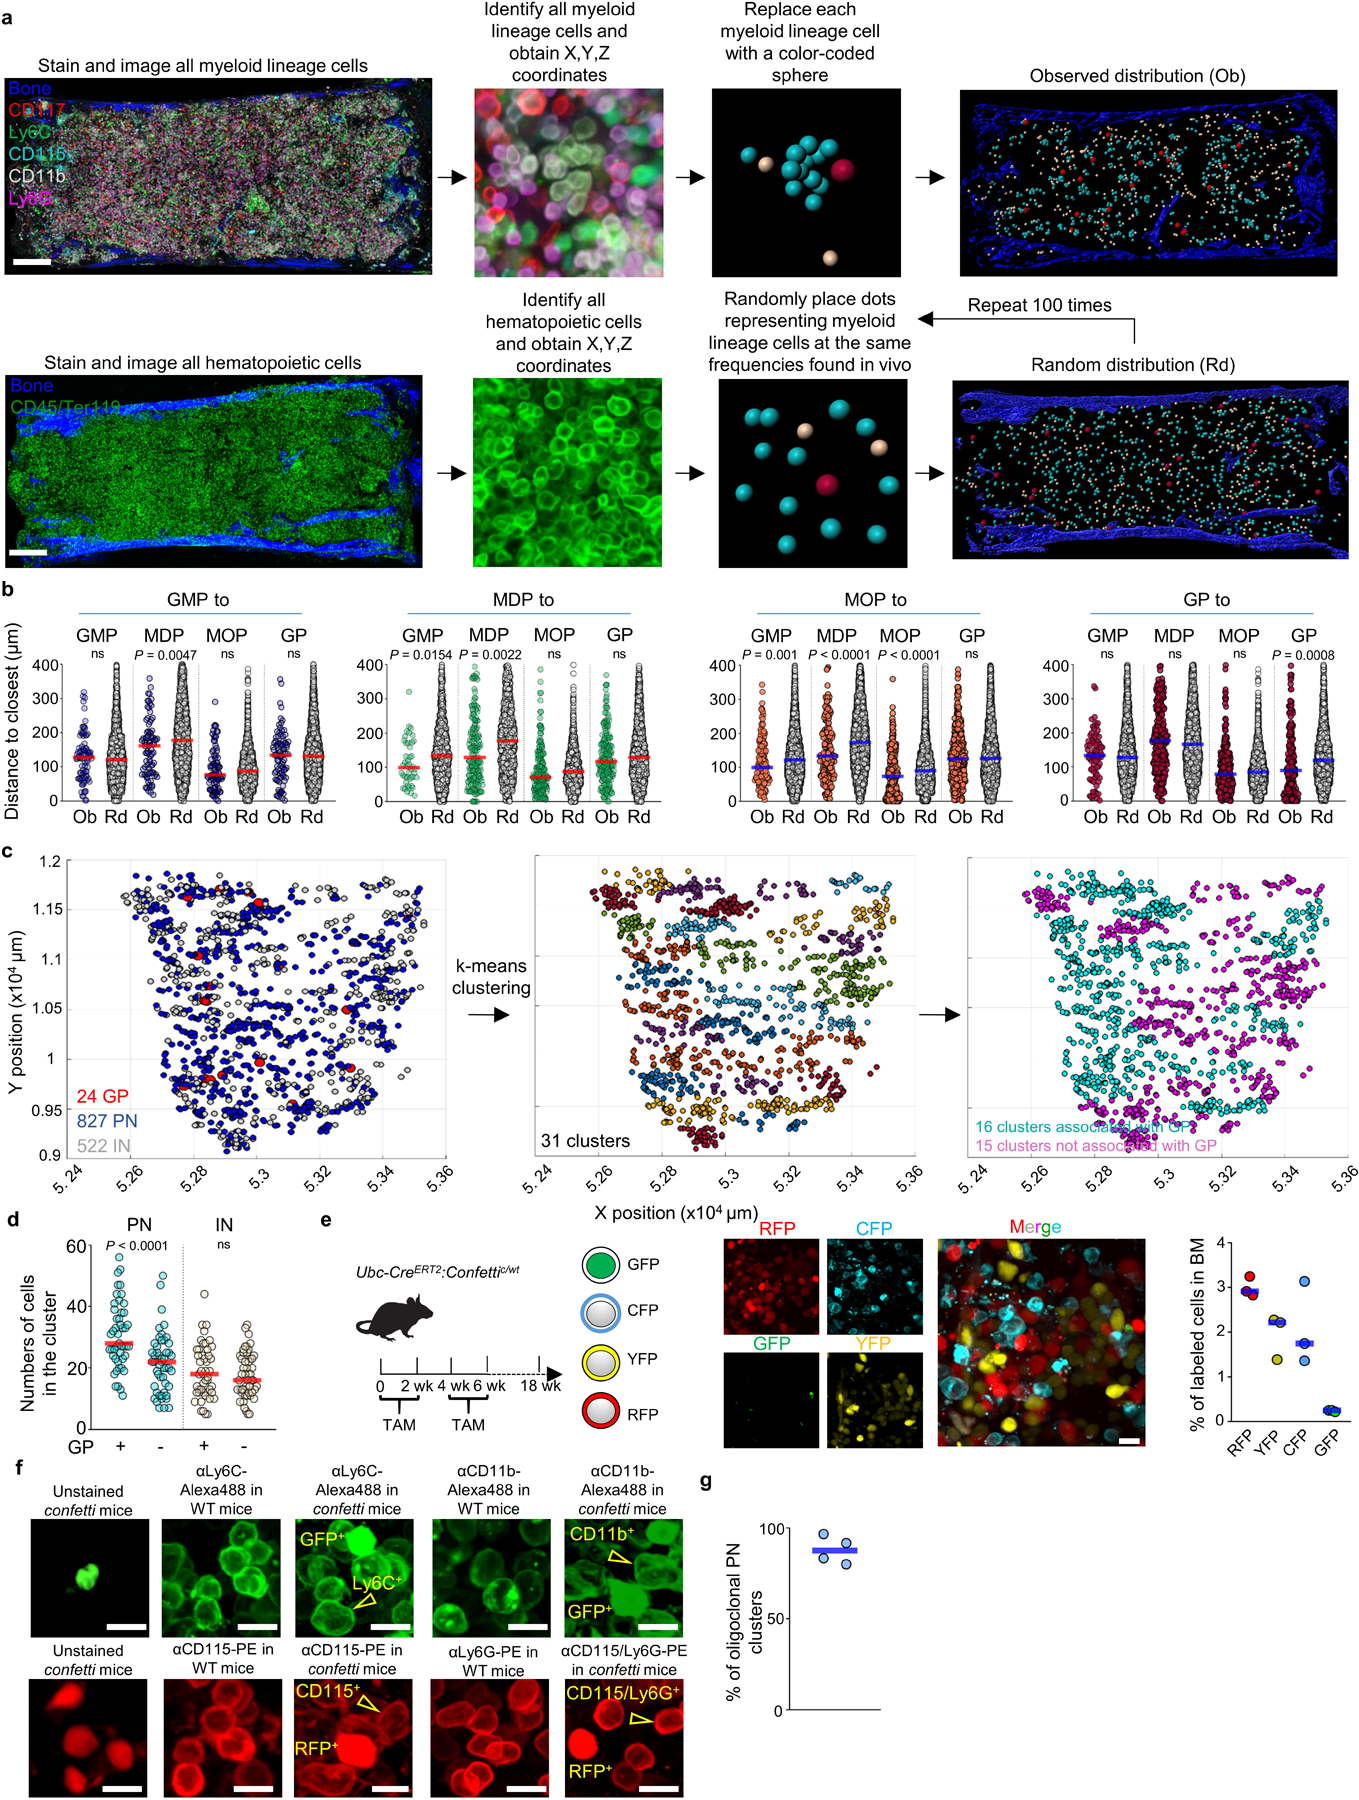
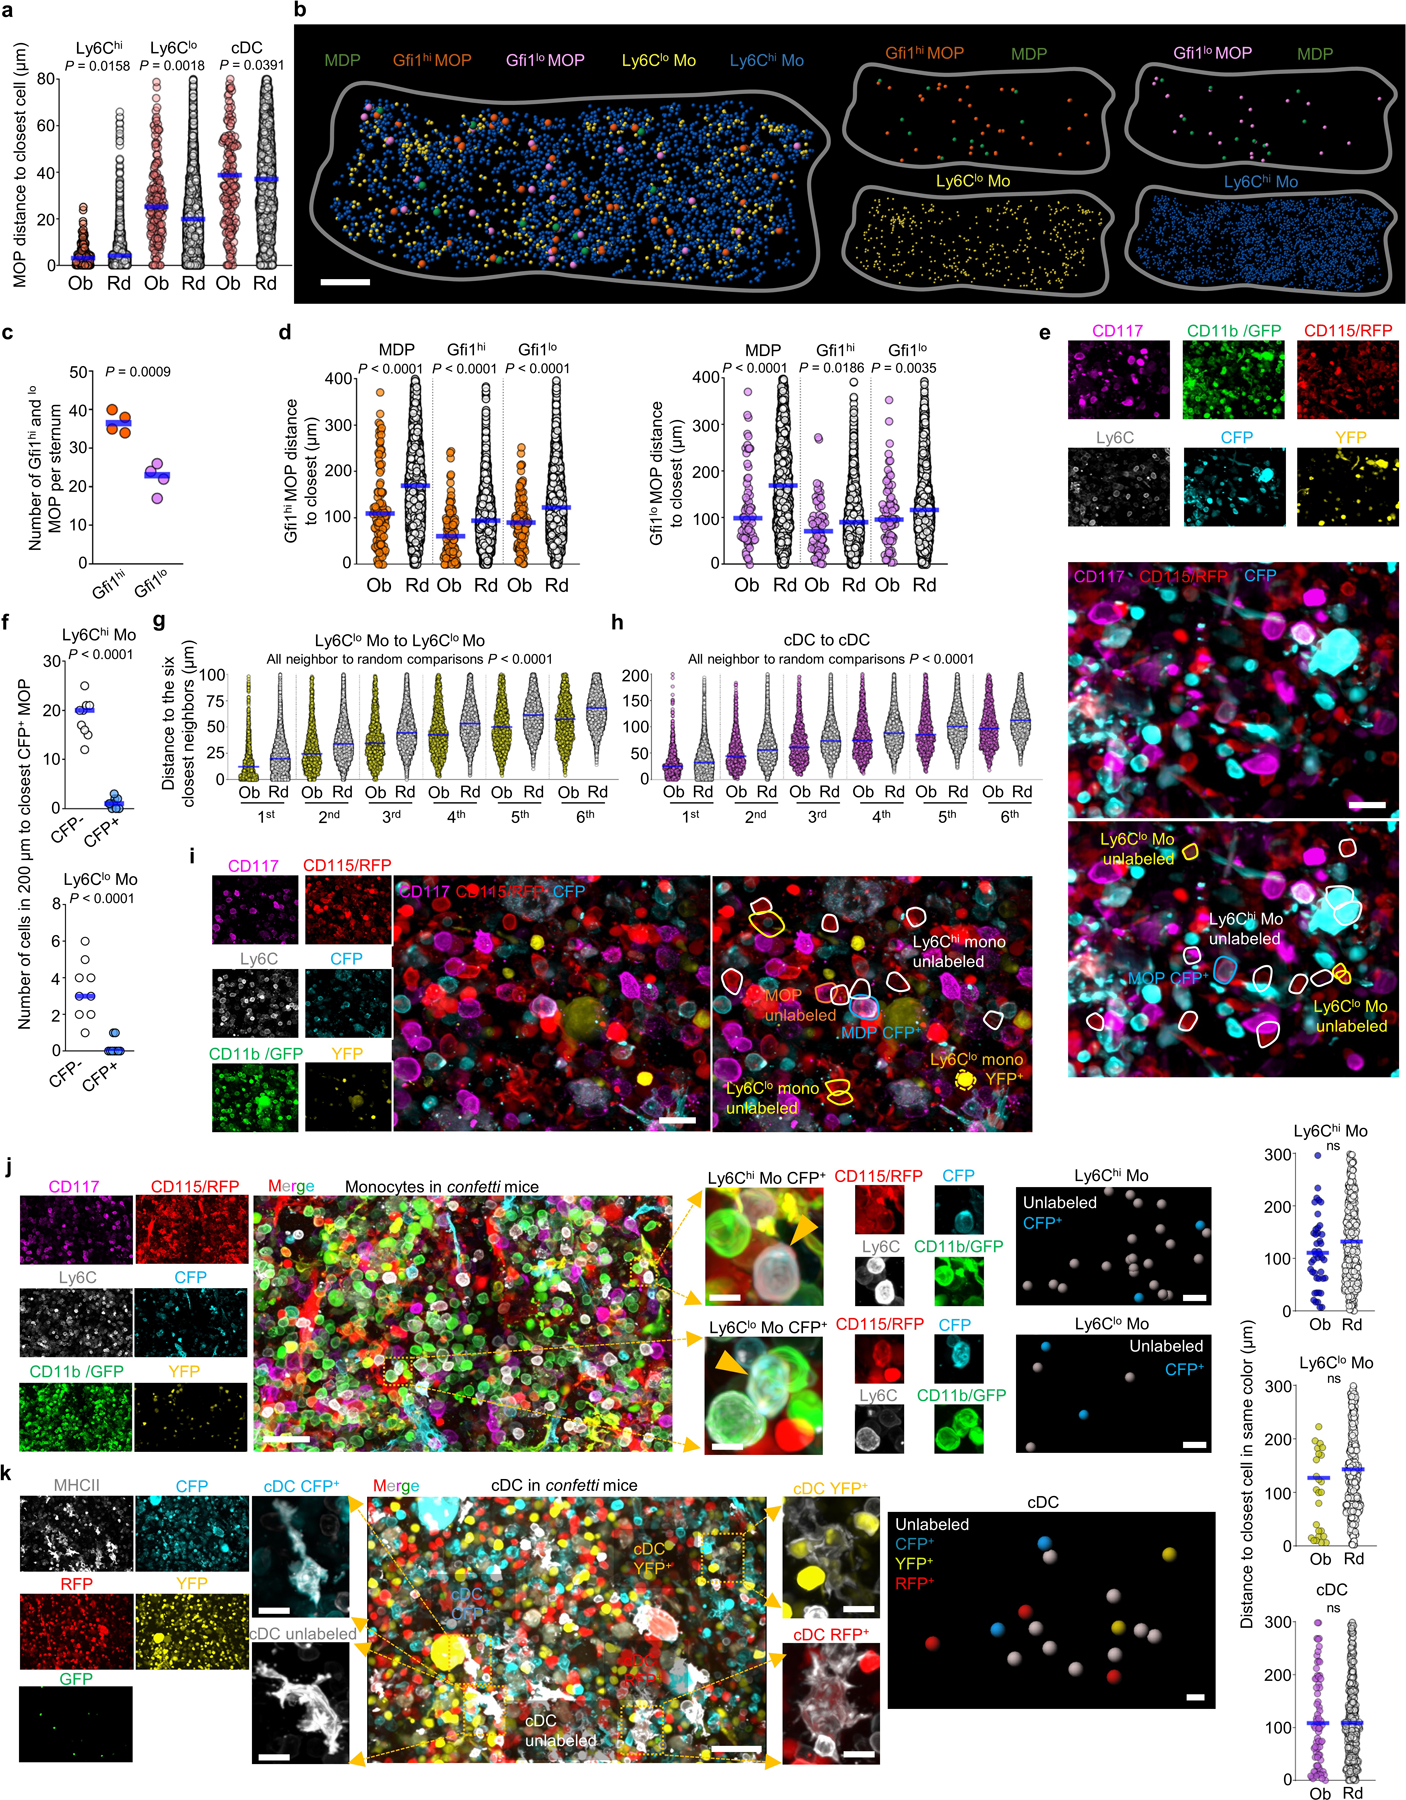
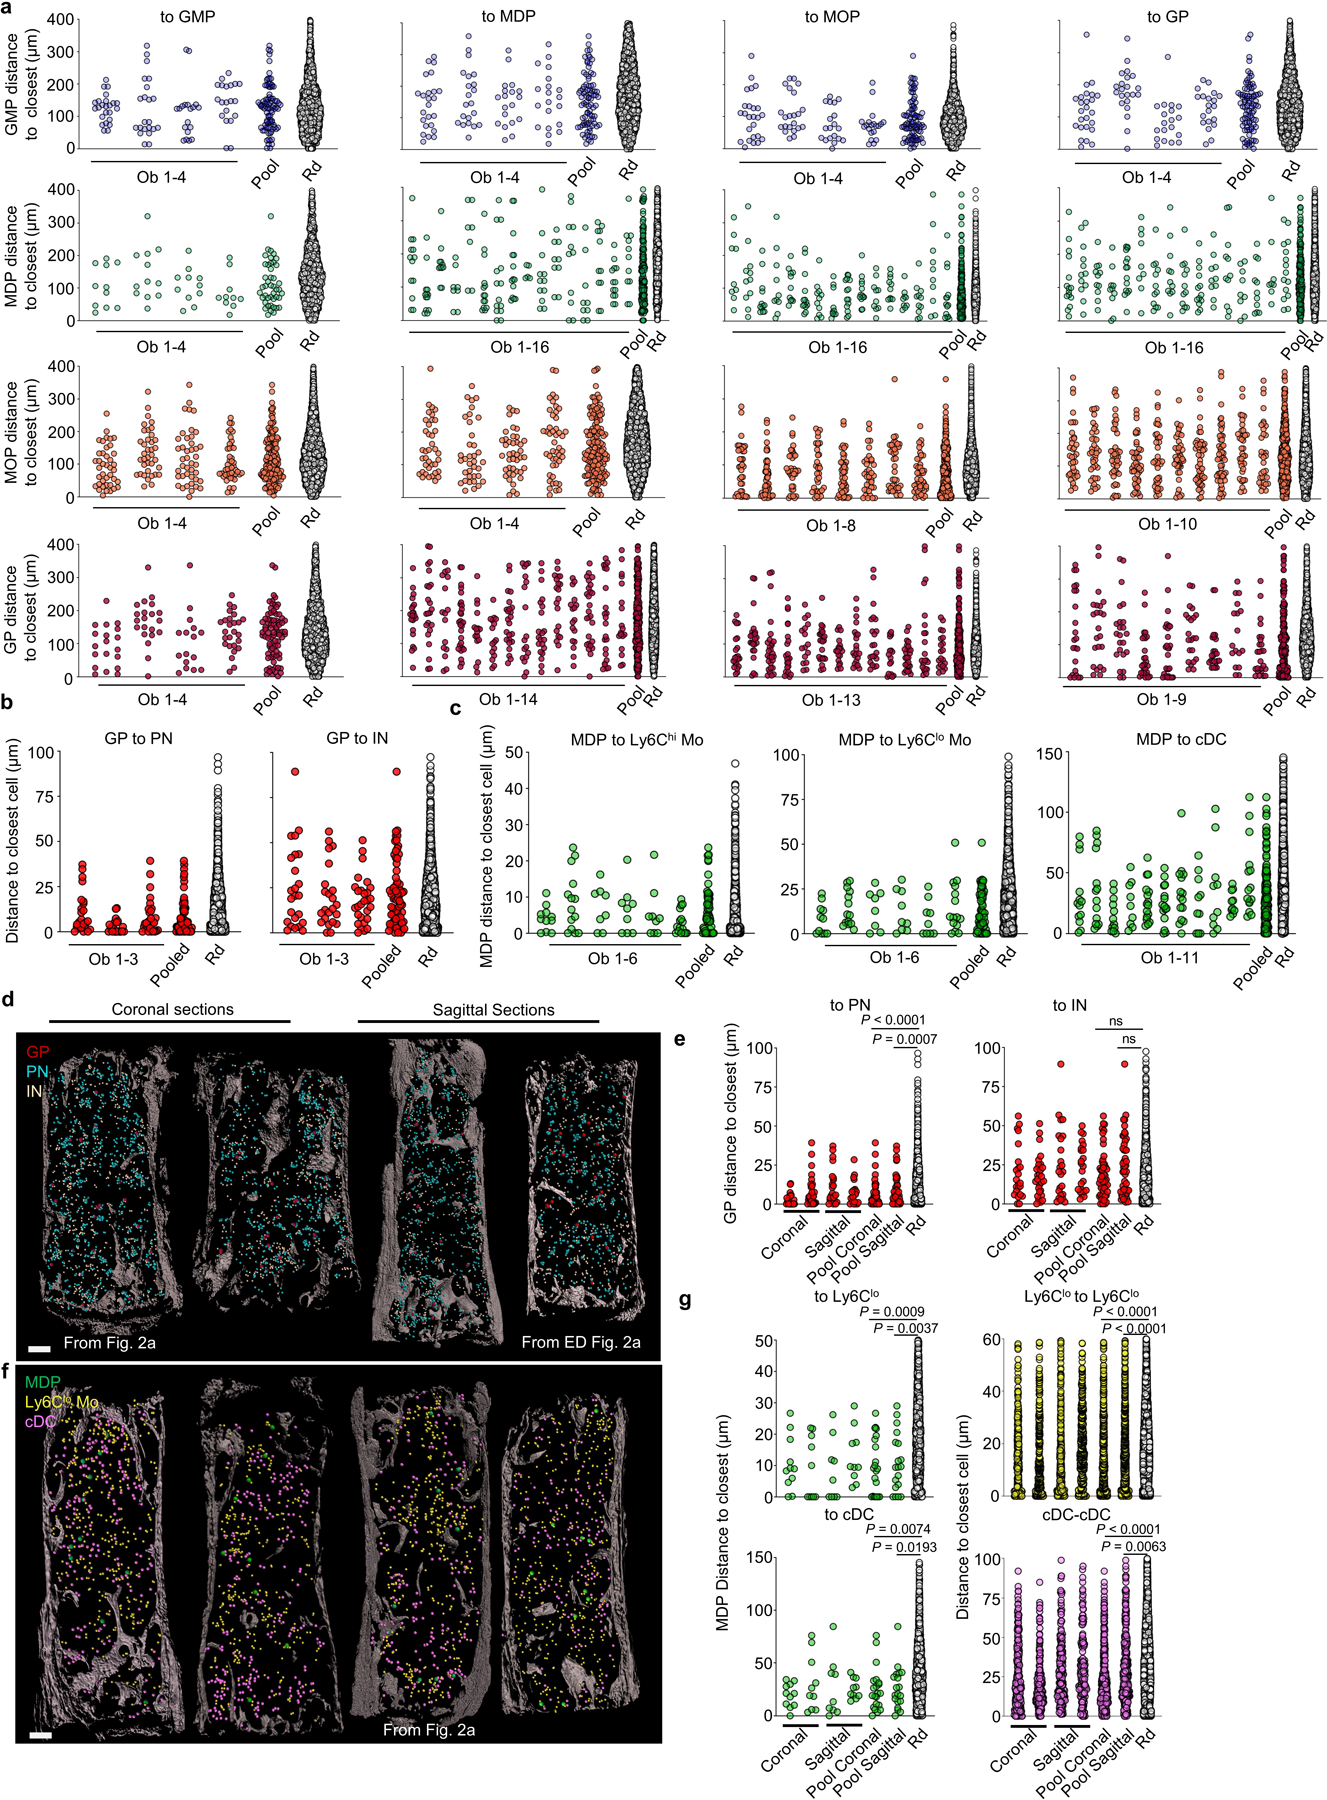
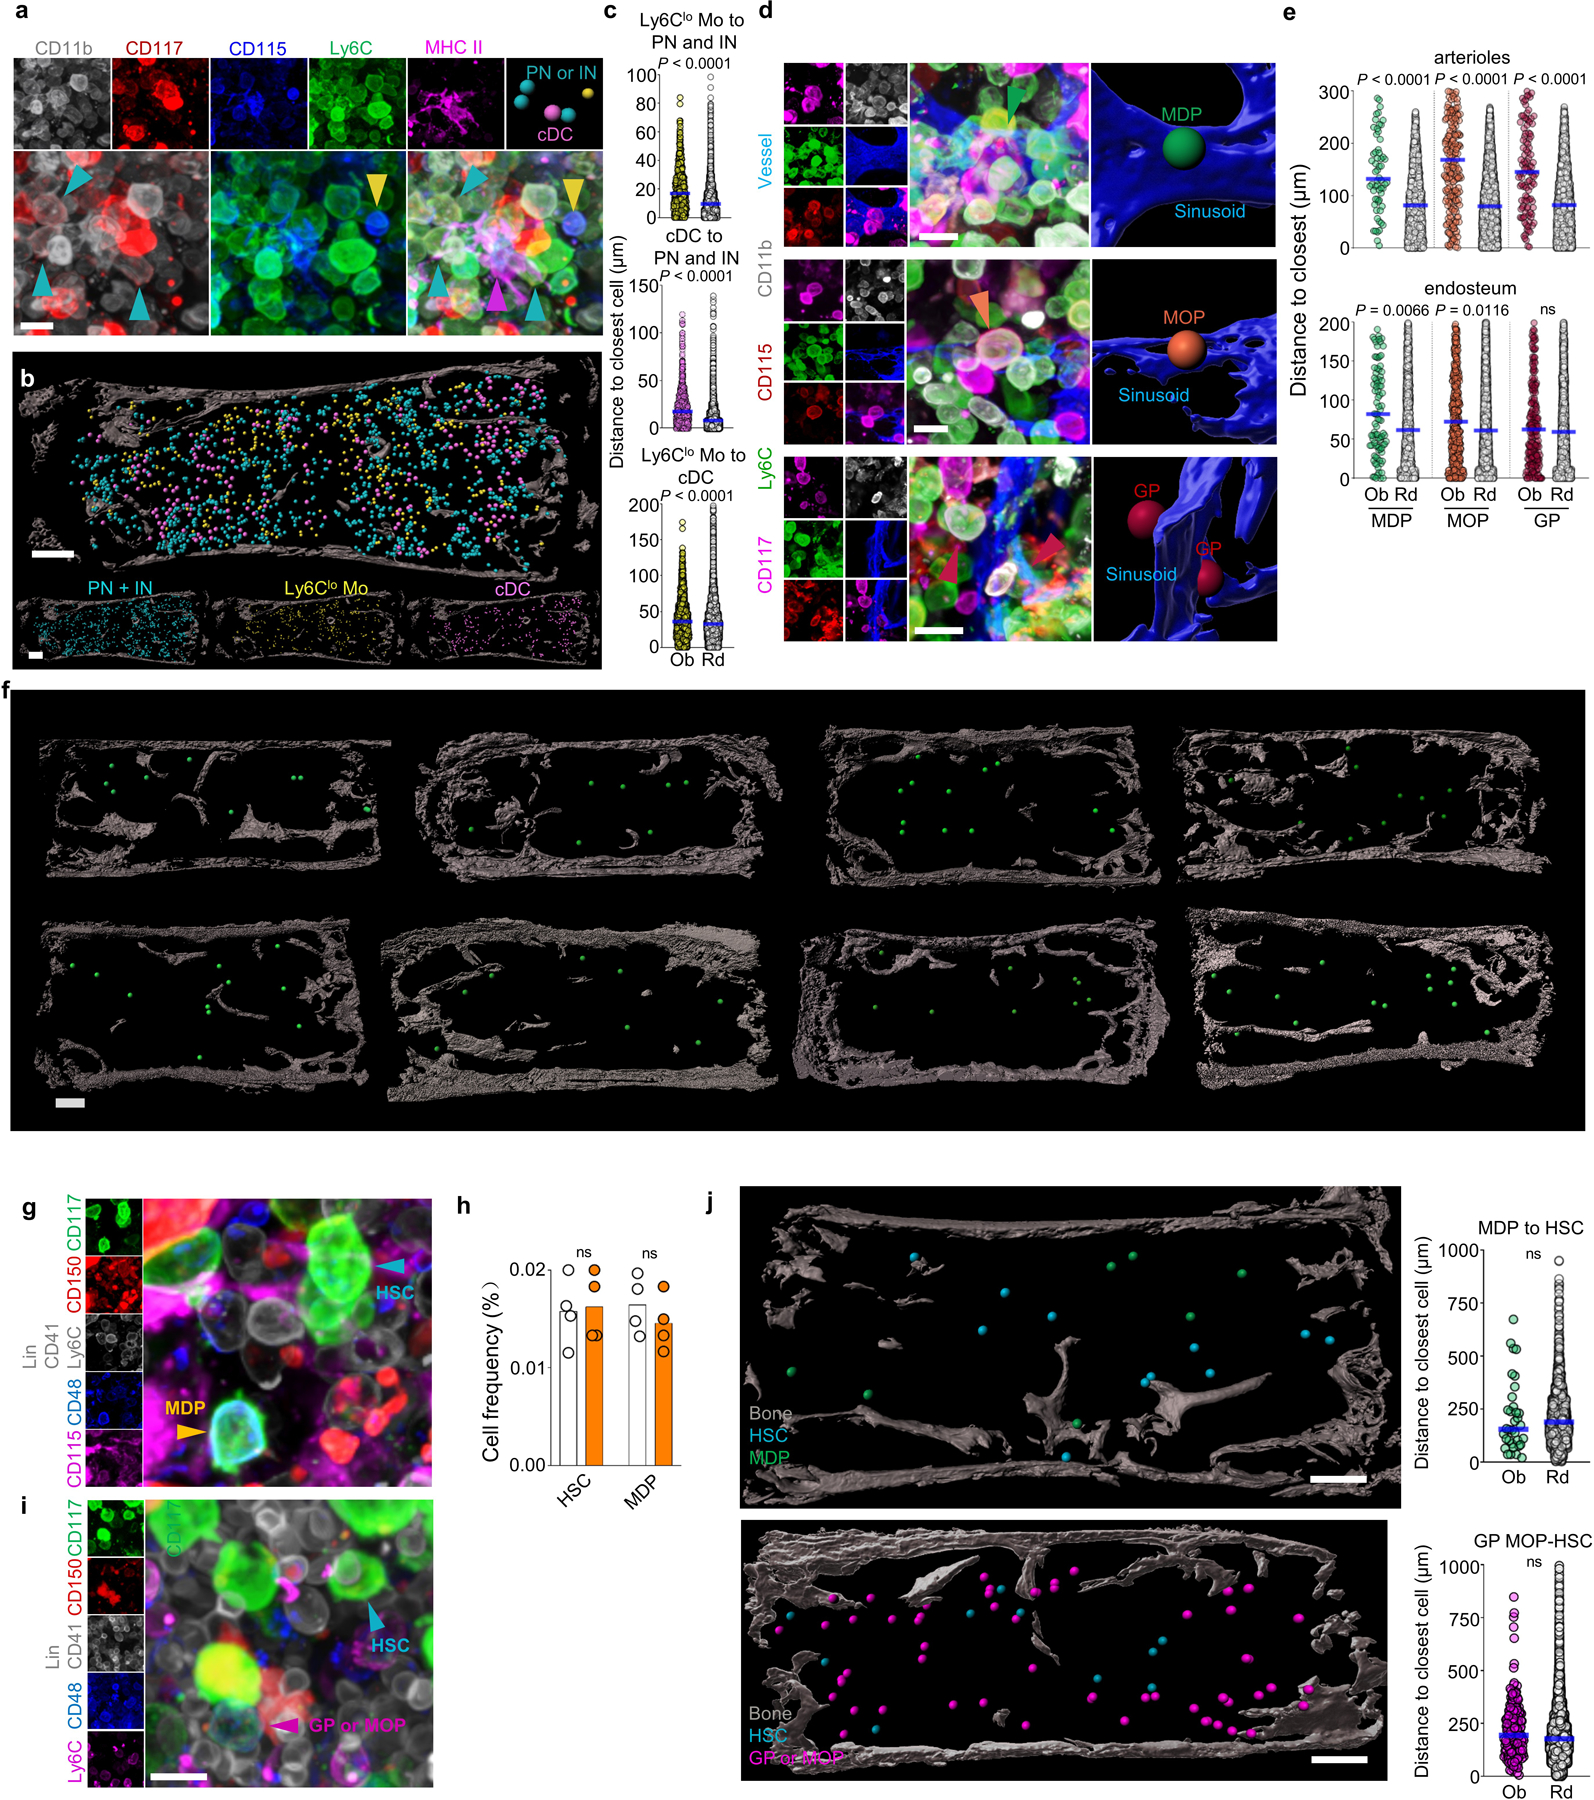
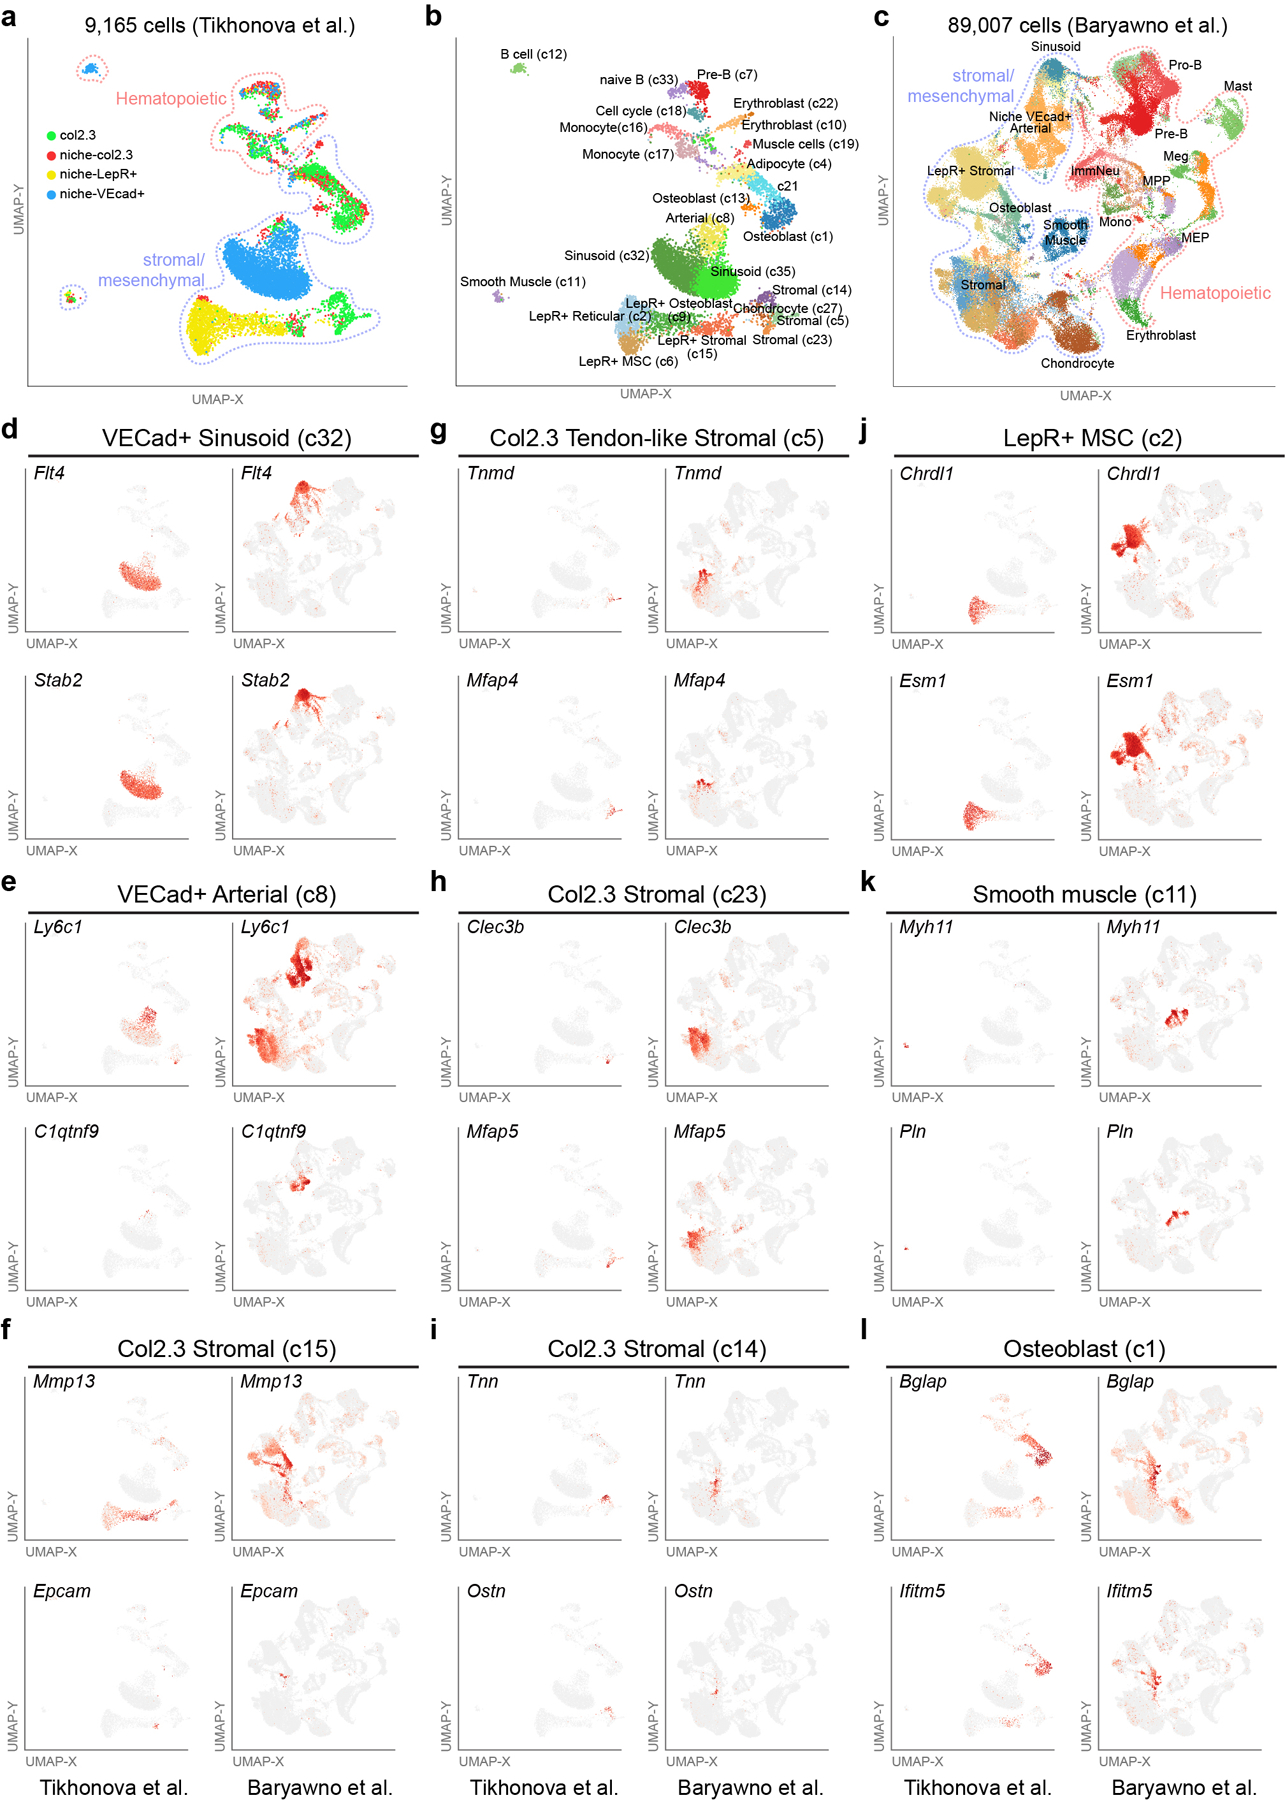
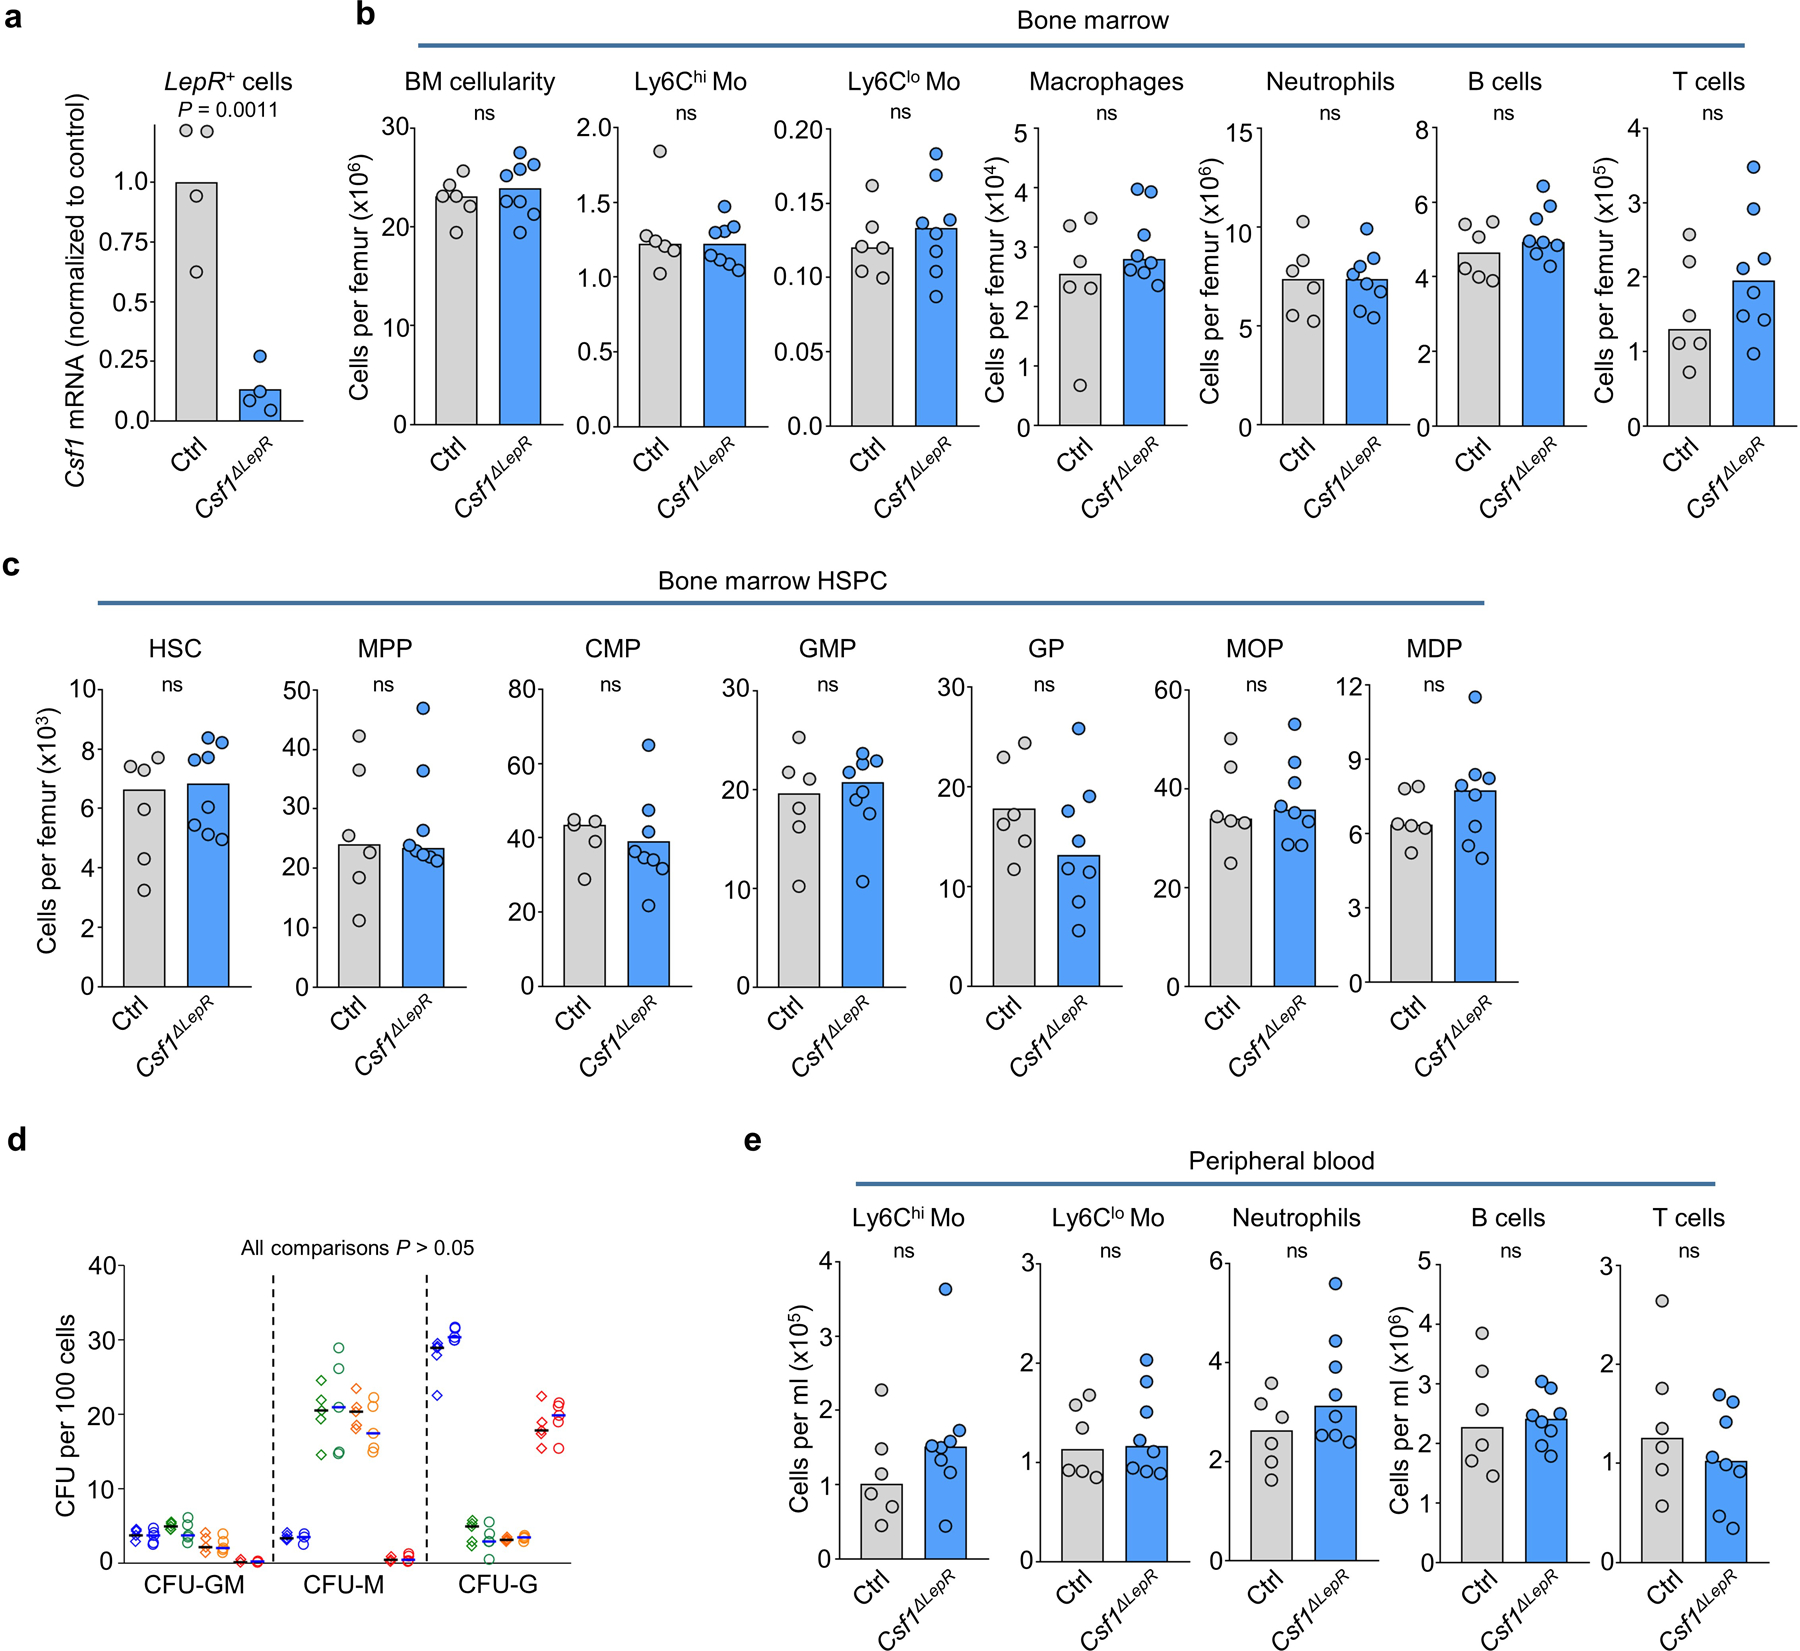
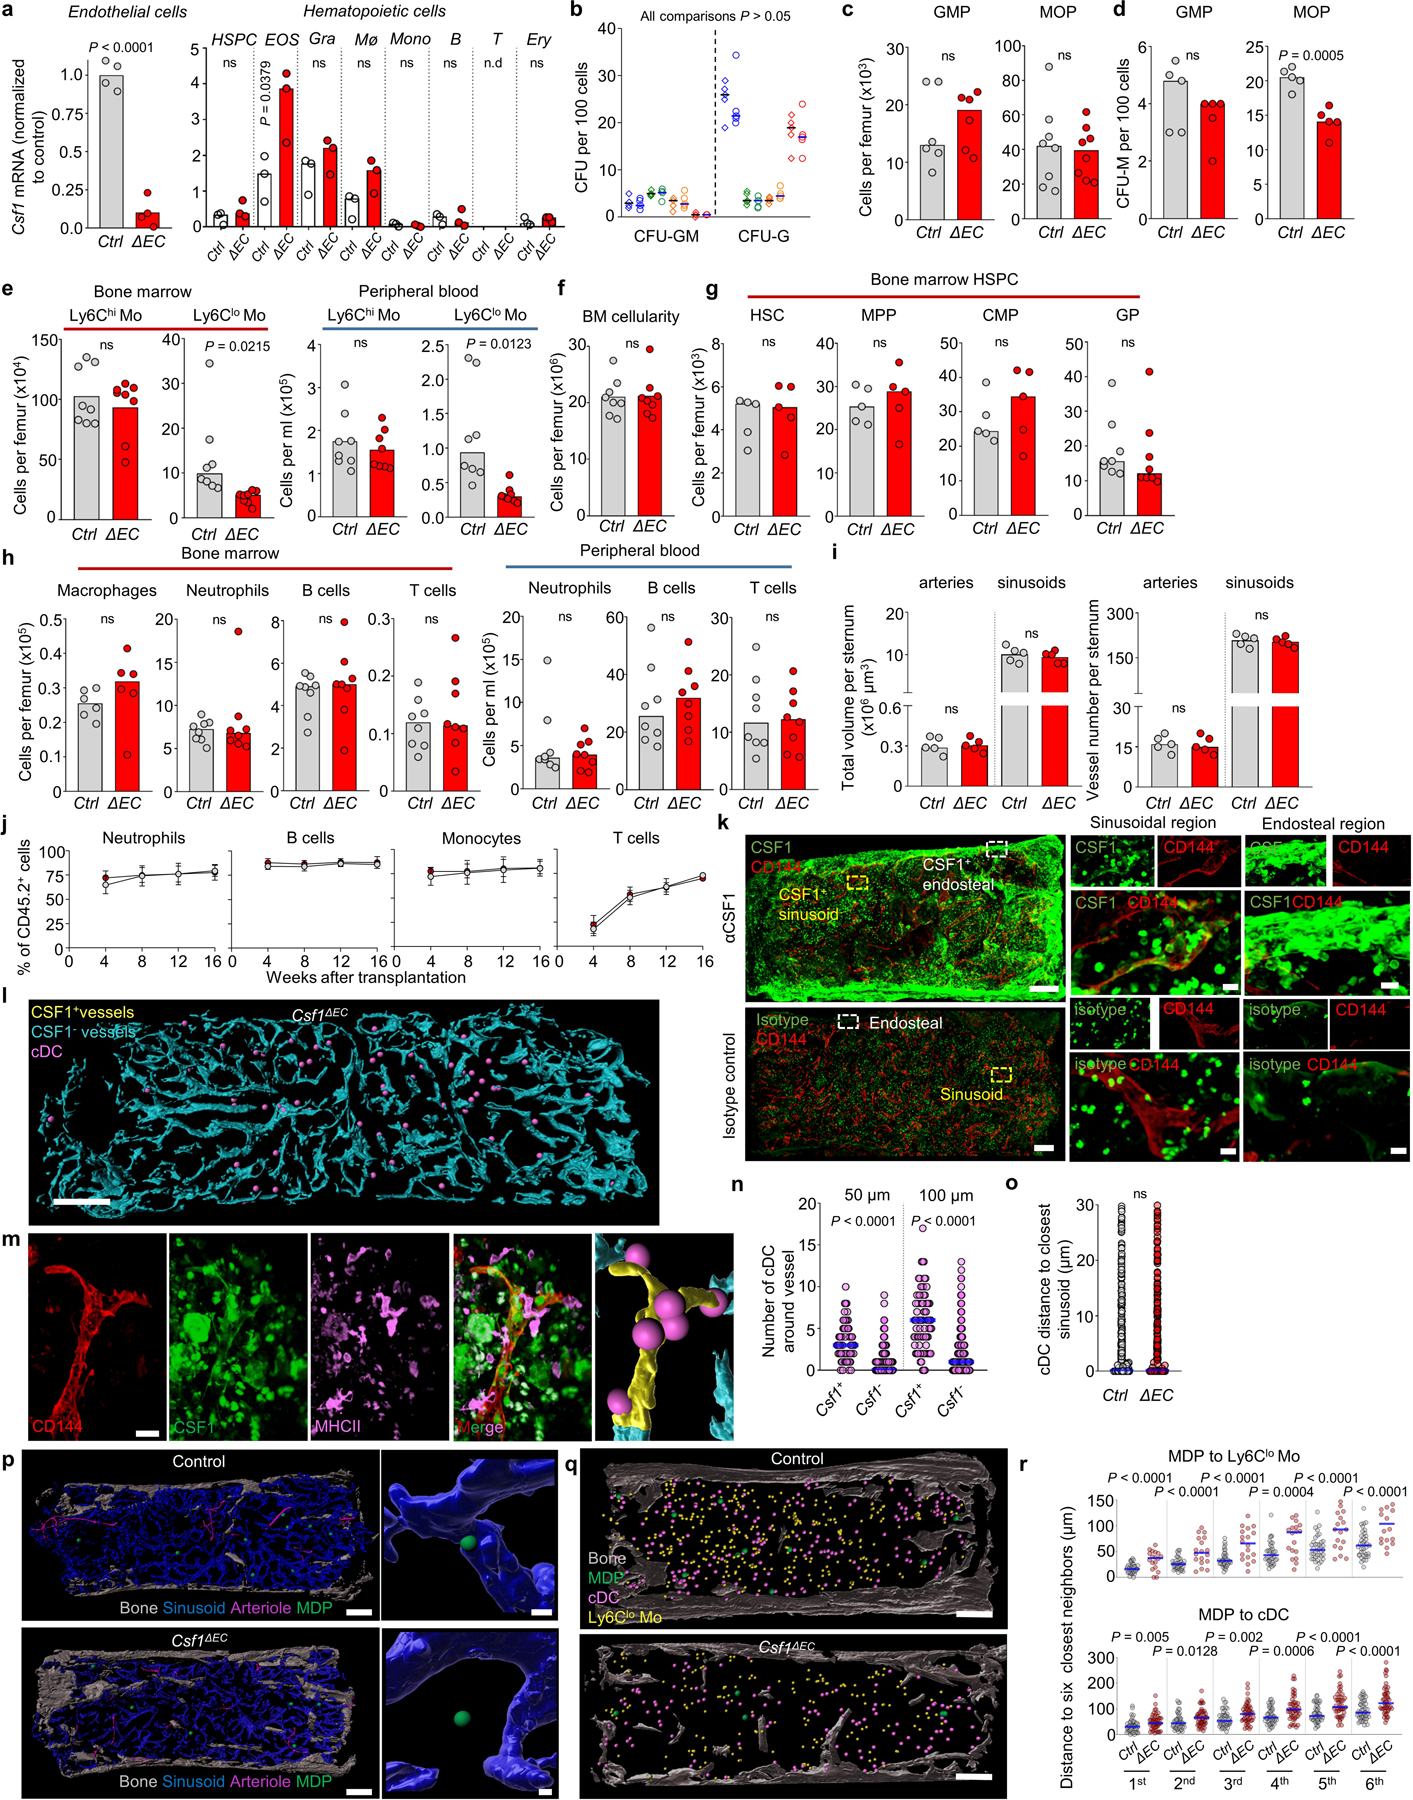
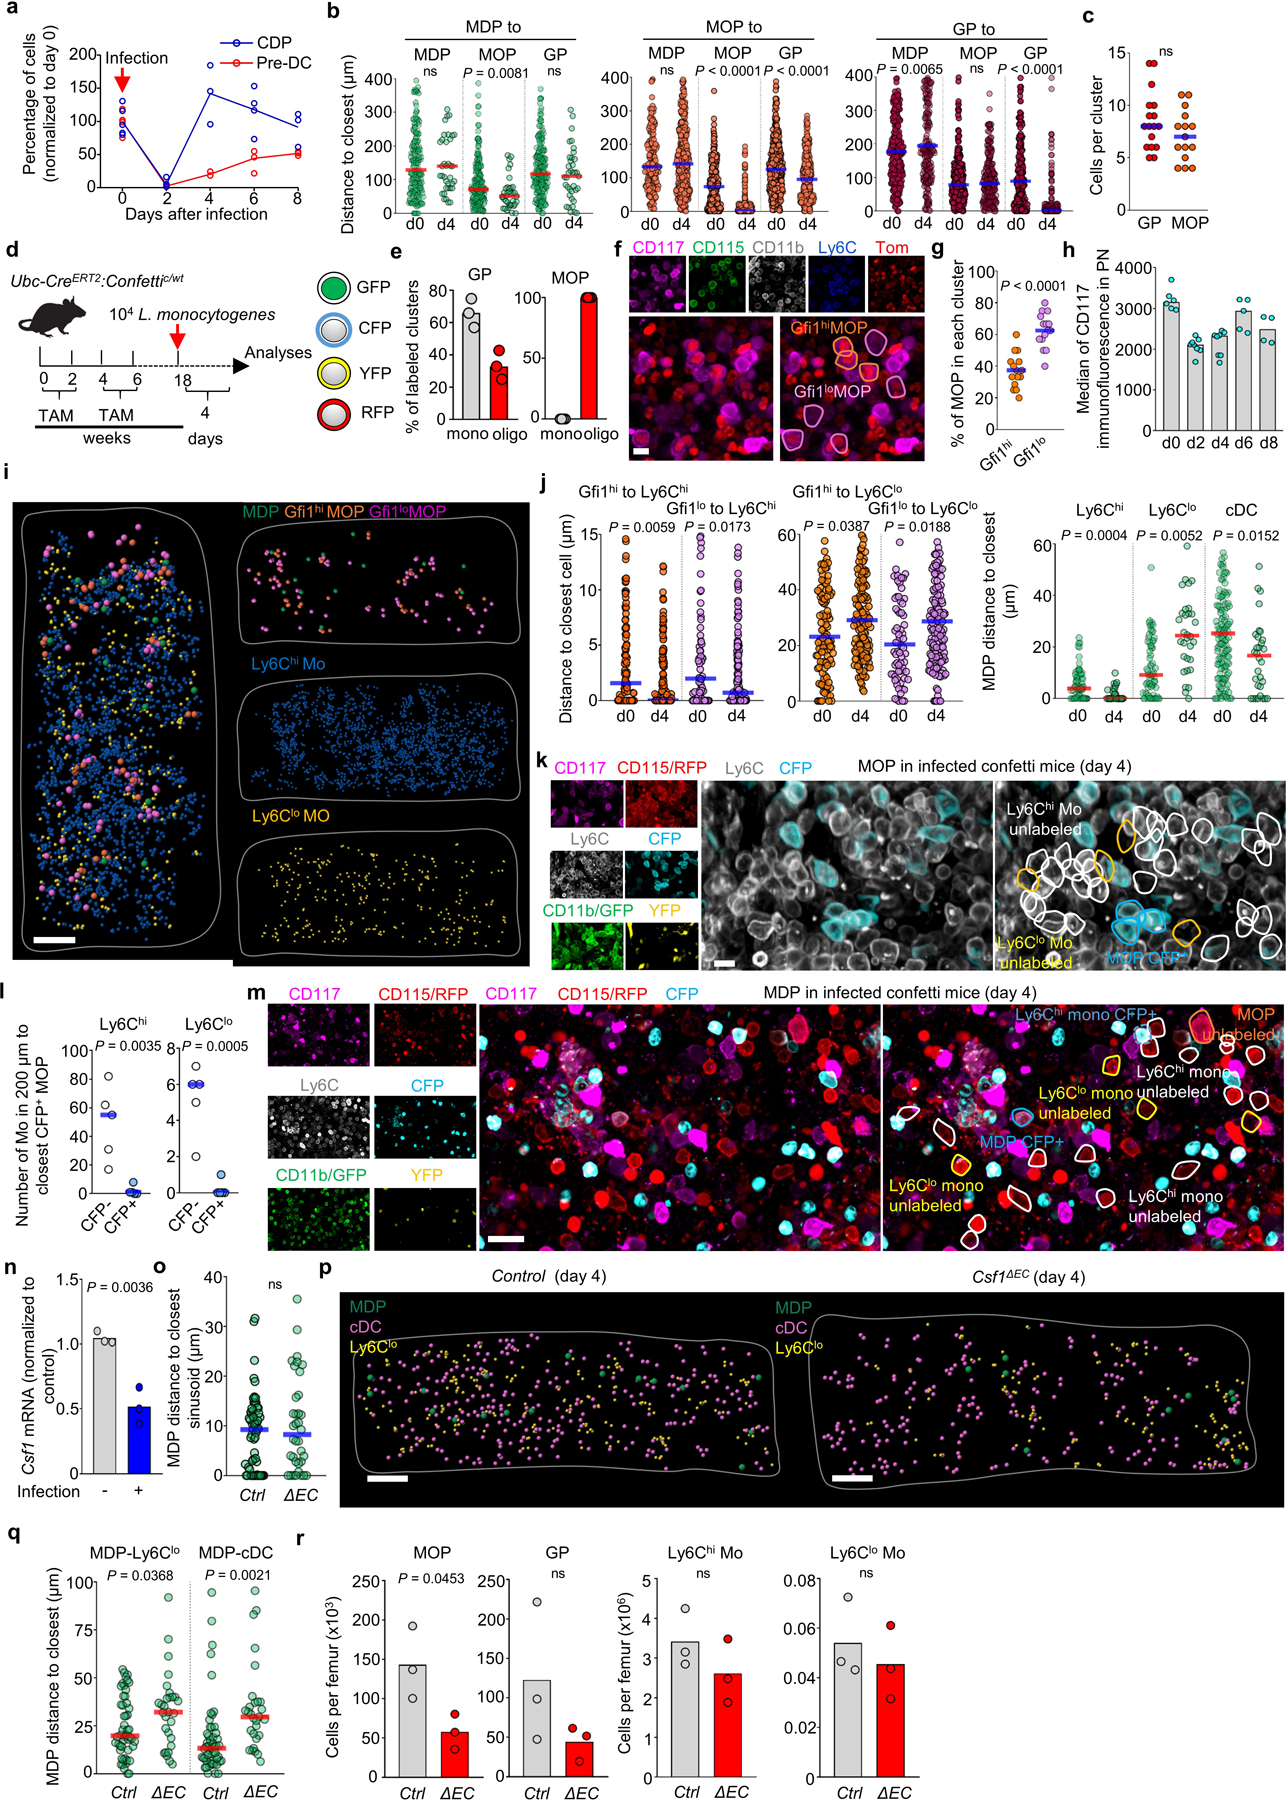
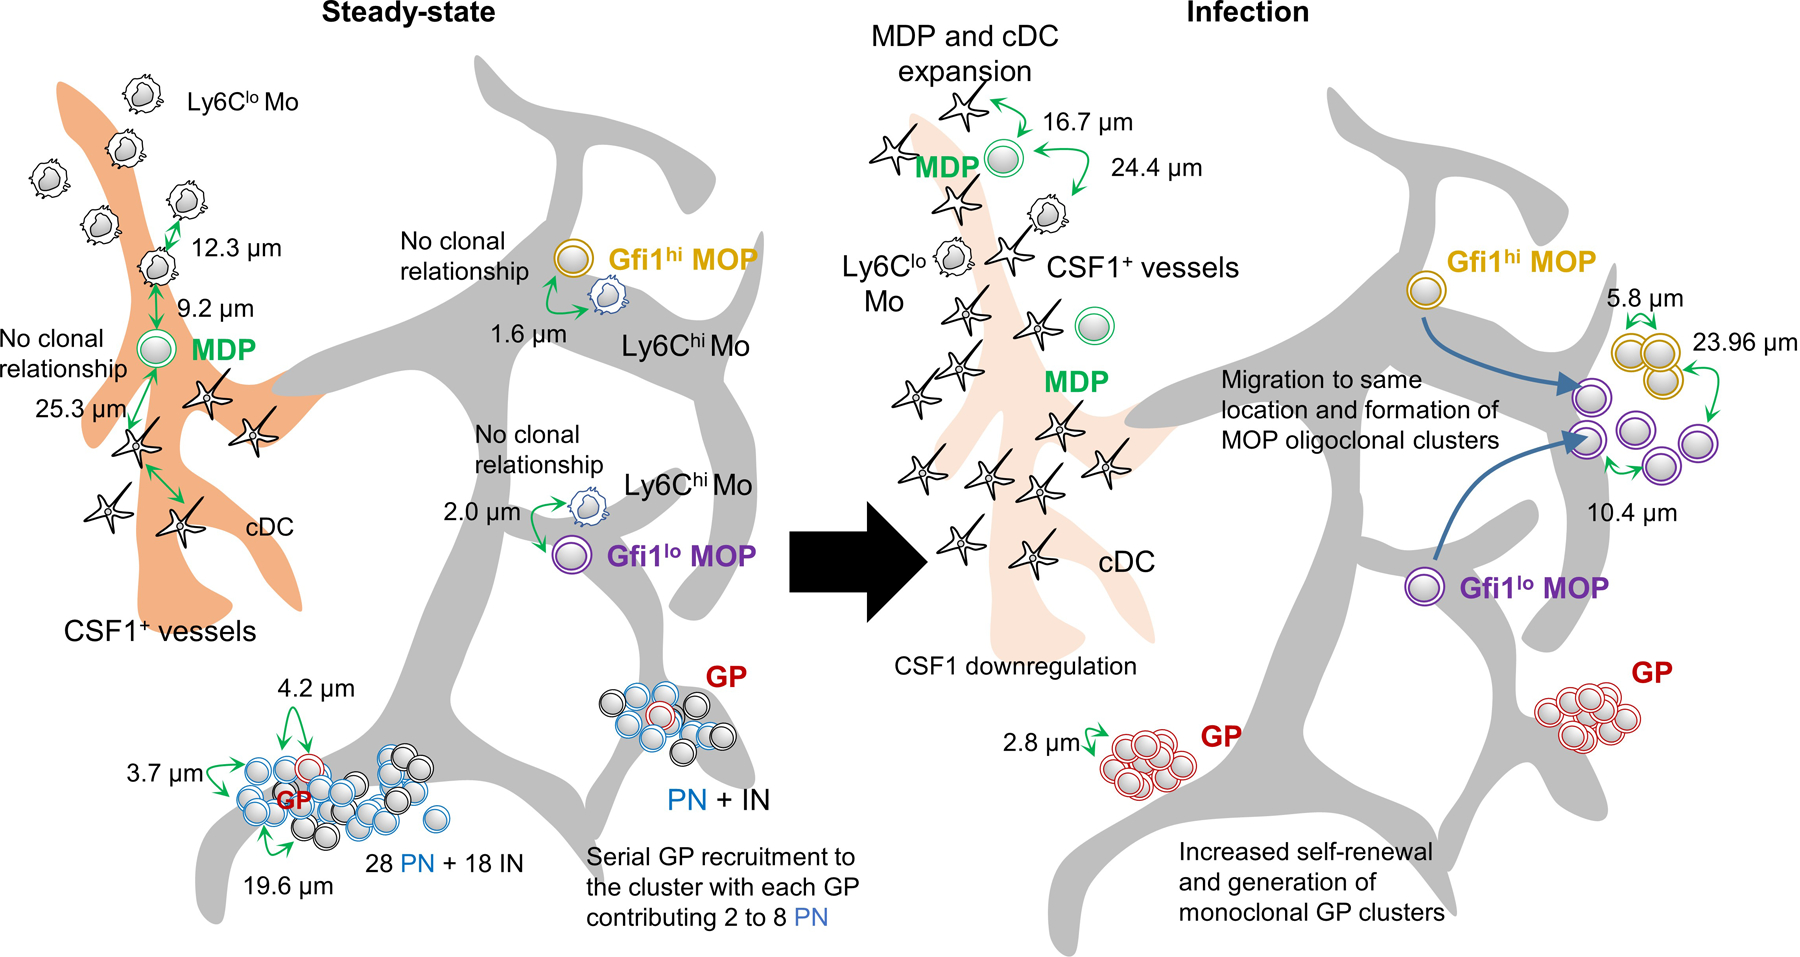
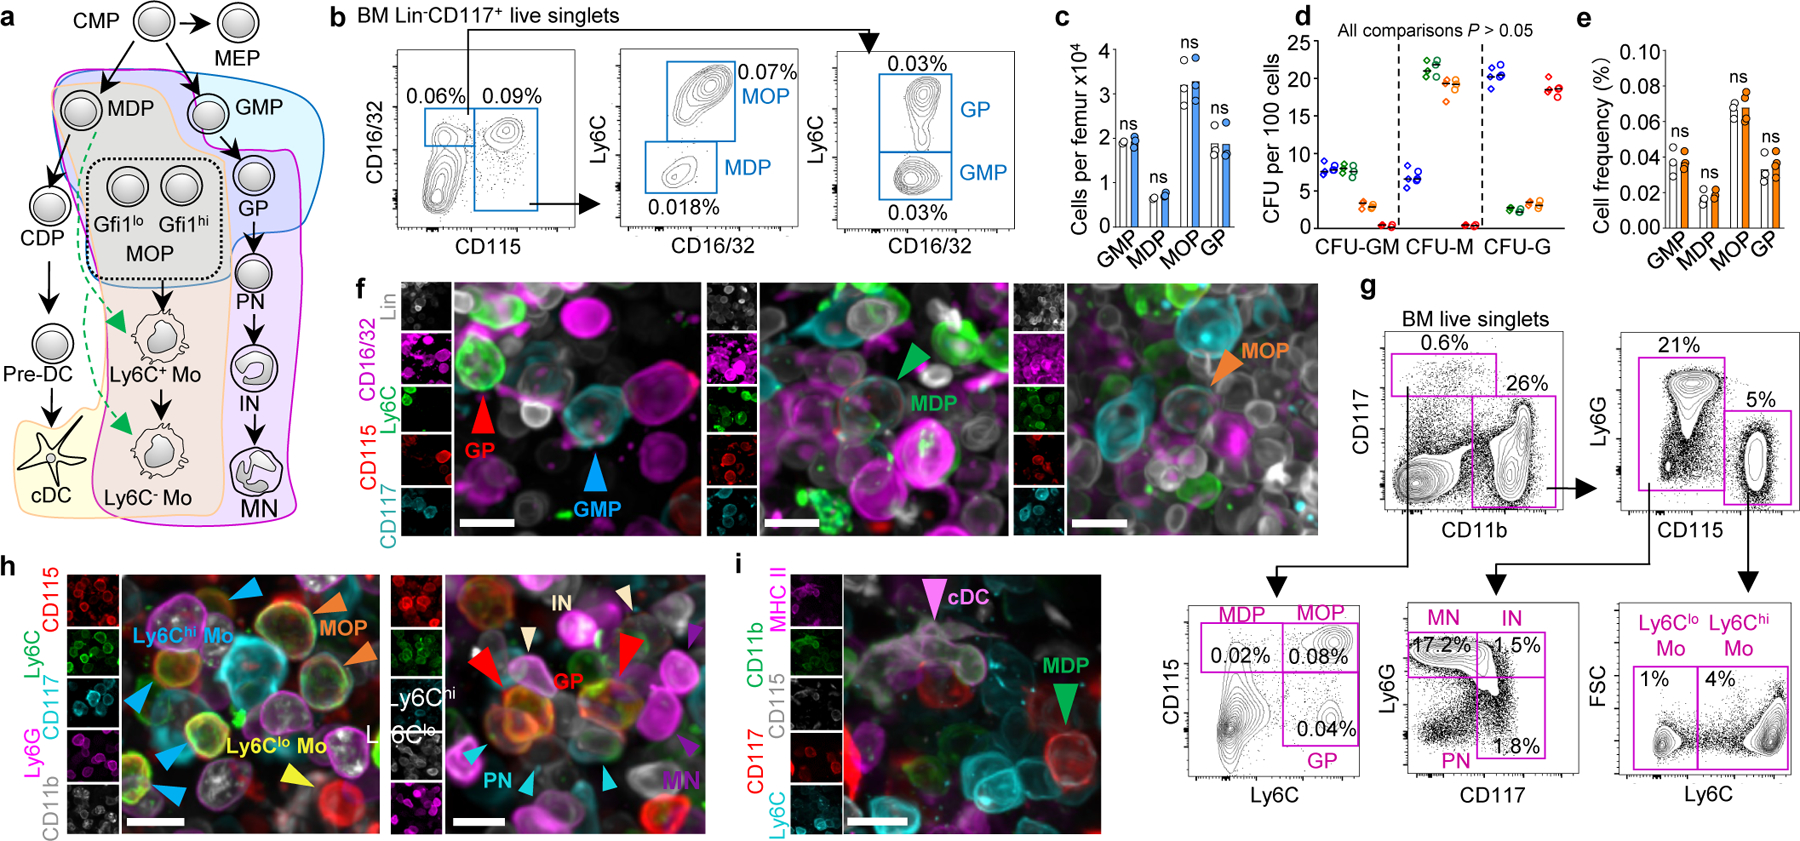
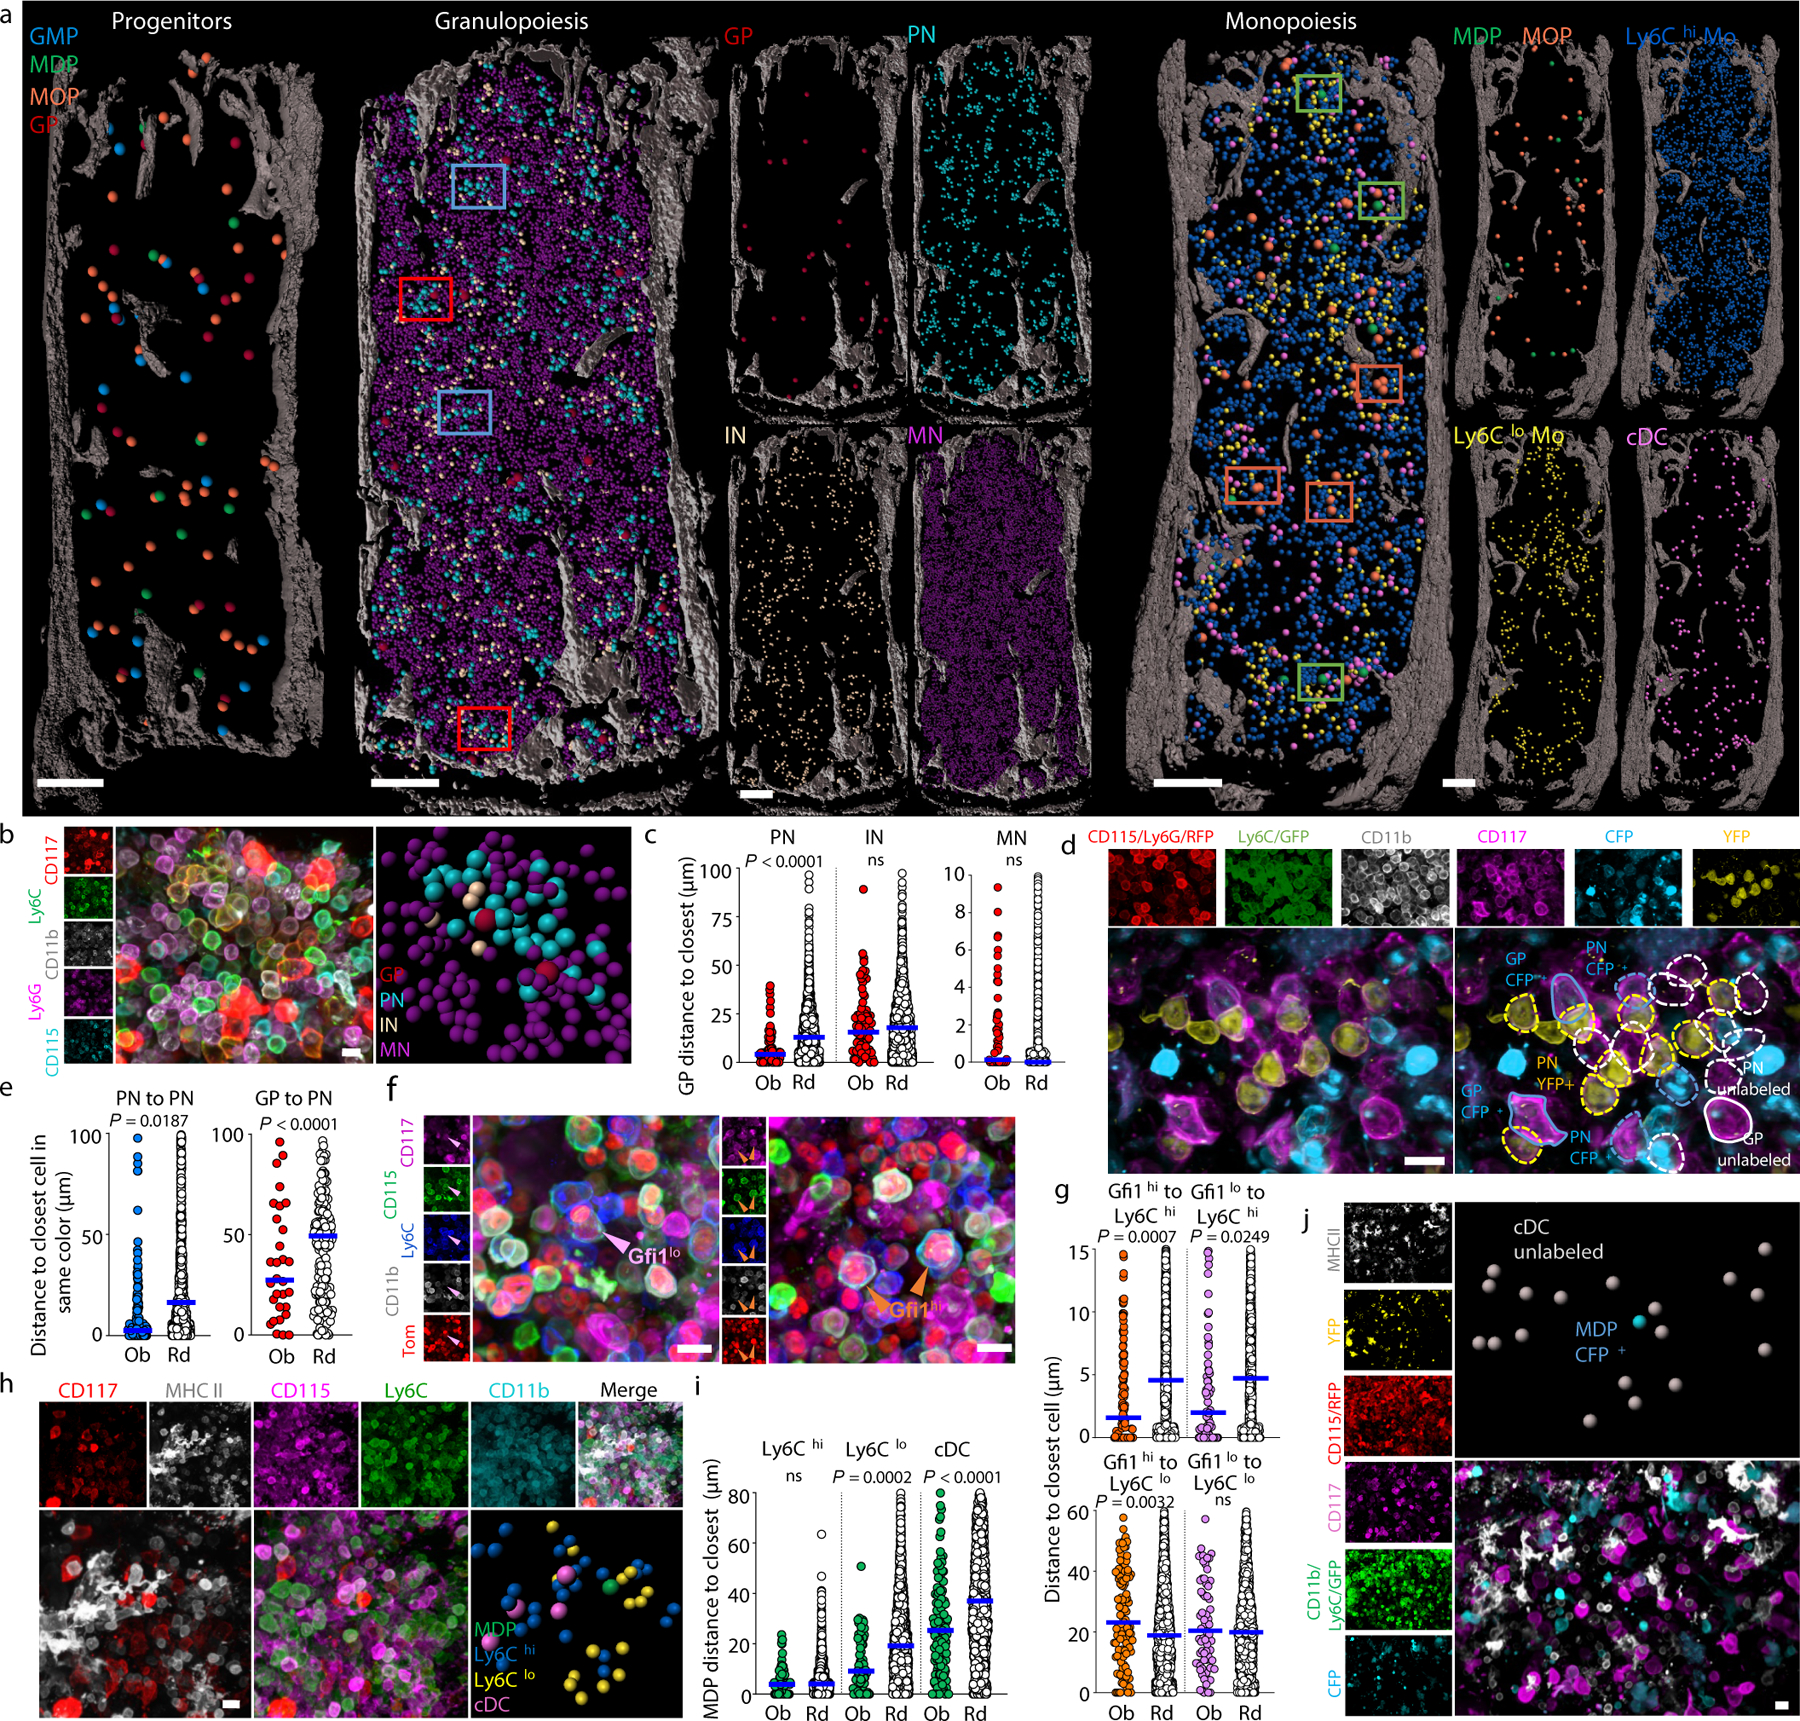
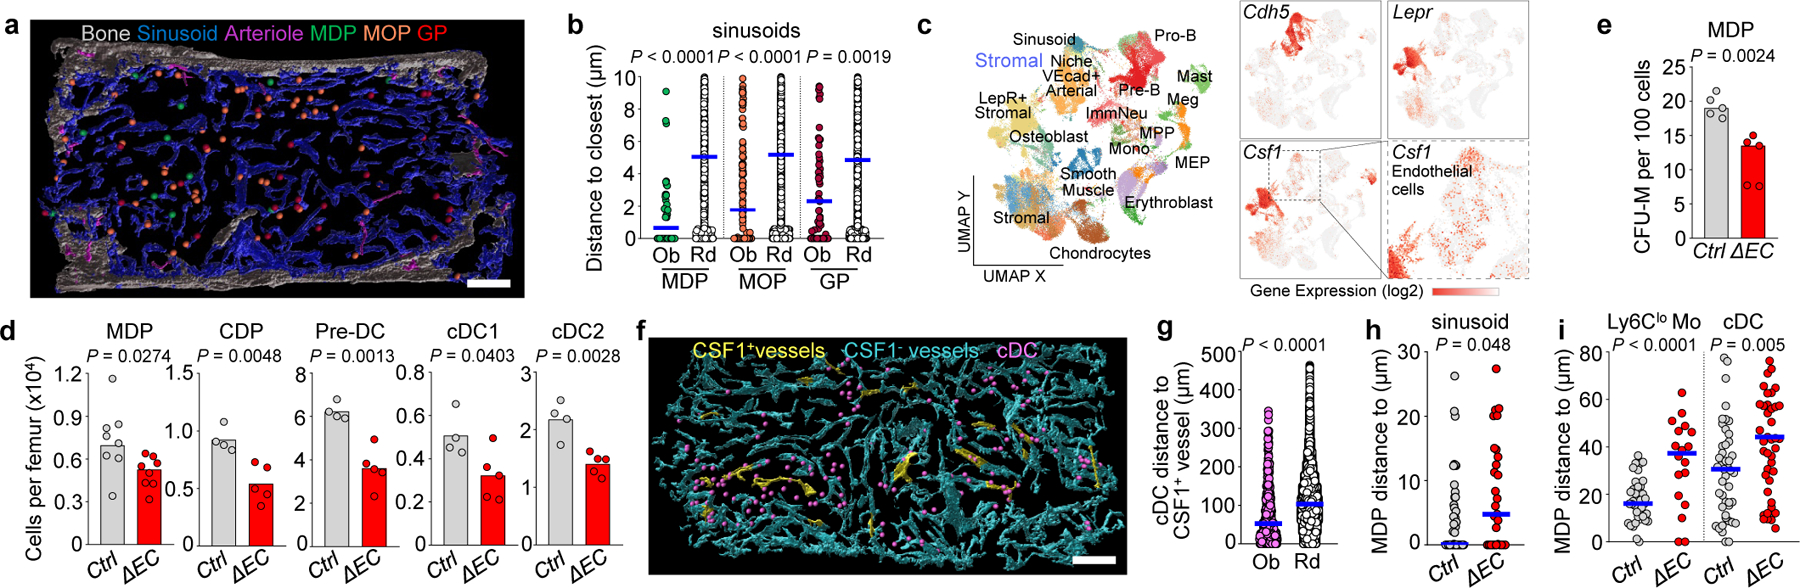
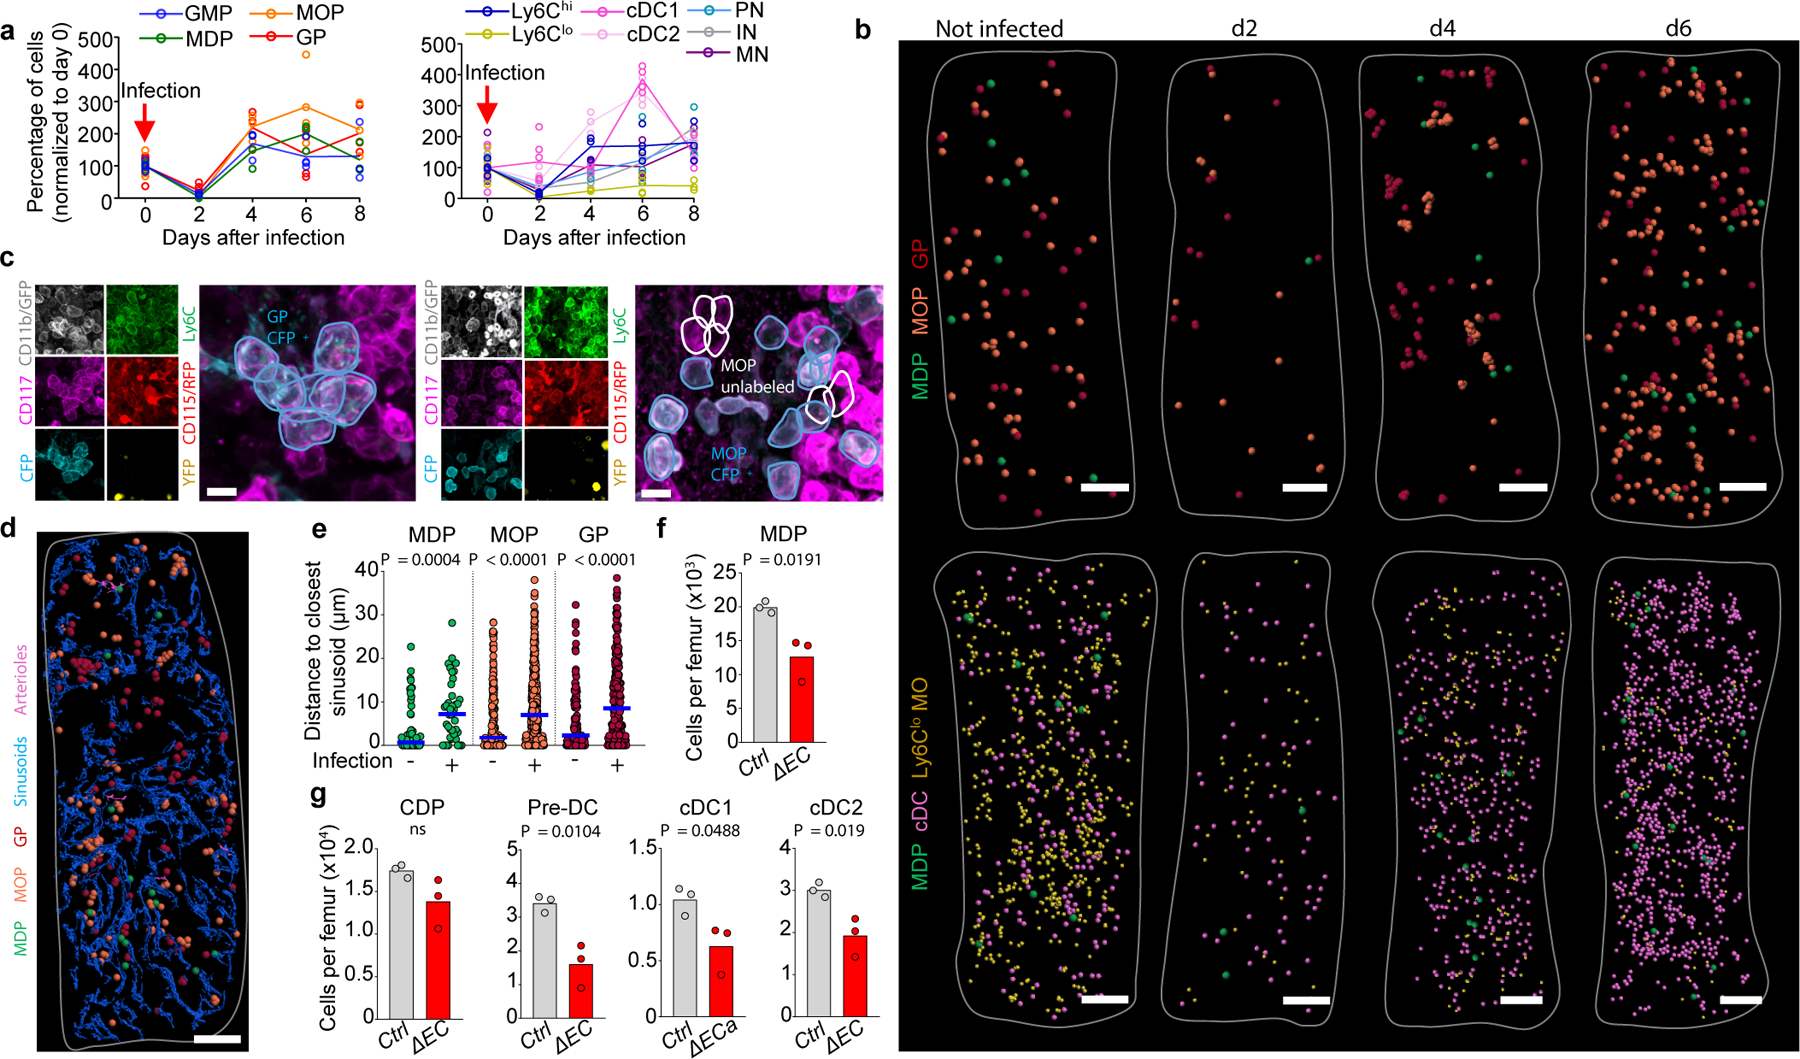
In contrast to nearly all other tissues, the anatomy of cell differentiation in the bone marrow remains unknown. This is owing to a lack of strategies for examining myelopoiesis-the differentiation of myeloid progenitors into a large variety of innate immune cells-in situ in the bone marrow. Such strategies are required to understand differentiation and lineage-commitment decisions, and to define how spatial organizing cues inform tissue function. Here we develop approaches for imaging myelopoiesis in mice, and generate atlases showing the differentiation of granulocytes, monocytes and dendritic cells. The generation of granulocytes and dendritic cells-monocytes localizes to different blood-vessel structures known as sinusoids, and displays lineage-specific spatial and clonal architectures. Acute systemic infection with Listeria monocytogenes induces lineage-specific progenitor clusters to undergo increased self-renewal of progenitors, but the different lineages remain spatially separated. Monocyte-dendritic cell progenitors (MDPs) map with nonclassical monocytes and conventional dendritic cells; these localize to a subset of blood vessels expressing a major regulator of myelopoiesis, colony-stimulating factor 1 (CSF1, also known as M-CSF)1. Specific deletion of Csf1 in endothelium disrupts the architecture around MDPs and their localization to sinusoids. Subsequently, there are fewer MDPs and their ability to differentiate is reduced, leading to a loss of nonclassical monocytes and dendritic cells during both homeostasis and infection. These data indicate that local cues produced by distinct blood vessels are responsible for the spatial organization of definitive blood cell differentiation.


Conflict of interest statement

Declaration of Interest

The authors declare no competing interests.

Figures

Extended Data Figure 1.
Extended Data Figure 1.. Validation of stains to detect myeloid cells.
a, FACS plots showing the gating strategy to identify MDP and MOP (as described in reference). b, Gating strategy to identify GMP, GP, and MOP (as described in reference). The Lineage panel contains antibodies against Ly6G, CD11b, Ter119, B220 and CD3. c, Images showing that Ly6C labels arterioles detected as either CD31+CD144+Sca1bright in wild-type mice or CD31+CD144+Nestinbright structures in Nestin-GFP mice; the histograms show quantifications demonstrating that all Sca1+ arterioles or Nestin-GFPbright arterioles are also Ly6C+. Scale bars = 50 μm. d, e, FACS plots (d) showing that only the CD11b+ gate contains CD117+CD115+ or CD117+Ly6C+ cells and histogram (e) showing that GP and MOP are the only Ly6C+ cells in the Lin-CD117+ gate. Together these data indicate that CD11b alone can be used to replace the Lineage panel to exclude contamination of mature cells when detecting MDP, MOP and GP. f, g, Cell numbers per femur (f) and colony forming activity (g, green: MDP, orange: MOP, red: GP; n = total 3 mice in two experiments) of the indicated progenitors using previously described strategies, (diamonds) or the one described in Fig1.g (circles). h, Frequency of total BM cells for each of the indicated populations in sternum when detected by FACS (white) or imaging (orange). i. Representative image showing that CD11b-CD117+CD115+Ly6C- MDP and CD11b-CD117+CD115+Ly6C+ MOP are GFP+ in Cx3cr1-gfp mice. Scale bar = 10 μm. j, qPCR showing Gfi1 and Irf8 expression (relative to Gapdh) in FACS-purified GP or MOP; n = total 6 mice in three experiments. k, FACS analyses in Gfi1-tdTomato mice showing differential tdTomato expression in GP and MOP in Gfi1-Tdtomato mice. l, Quantification of promyelocytes (PM), myelocytes (MC), metamyelocytes (MM), banded cells (BC) and polymorphonucleated neutrophils (PMN) in cytospin preparations of FACS-purified Pre-Neutrophils, Immature Neutrophils and Mature Neutrophils. n = total 2 mice. Scale bar = 10 μm. m, The stains require discrimination of CD16/32, CD117, and Ly6G bright and dim cells. The panels show the gating strategy, experimental design, and quantification of frequencies of decanted CD16/32 and CD117 bright and dim cells or IN, PN, and MN when compared to frequencies obtained by FACS prior cytospin. Each dot represents one image field from two experiments. n, o, Dendritic cells can be imaged as reticulated CX3CR1-GFP+ or CX3CR1-GFP+MHCII+ cells in Cx3cr1-gfp reporter mice,. The images and histograms show that all reticulated GFP+ cells were also MHCII+ and CD11c+ indicating that MHCII and cell shape are sufficient to unambiguously identify DC and distinguish them from macrophages that are CXCR1-GFP-CD11c- cells; n = total 3 mice. Scale bar = 10 μm. p, Image and histogram showing that CX3CR1-GFP+MHCII+ dendritic cells are conventional dendritic cells as they are CD11b+ but do not express B220 or CD8. Scale bar = 10 μm. n = total 3 mice q, FACS gating strategy for isolation and imaging of the indicated cells. Dendritic cells are detected as MHCII+ reticulated cells in imaging analyses. In all bar graphs one dot corresponds to one mouse. Statistical differences were calculated using two-tailed Student’s T tests and p values are shown. ns = not significant.
Extended Data Figure 2.
Extended Data Figure 2.. Strategies to map myelopoiesis in whole mounted sternum.
a, Scheme showing the experimental pipeline to identify, obtain the X, Y and Z coordinates, and replace each myeloid cell with a color-coded sphere centered in the cell to better visualize differentiation and to generate random distributions. Scale bar = 200 μm. b, Histograms showing the observed distribution of distances from each GMP (blue), MDP (green), MOP (orange) and GP (red) or random cells (white) to the closest indicated cell (n = 86 GMP from 4 sternum sections of 4 mice, n = 243 MDP from total 23 sternum sections of 15 mice, n = 458 MOP from total 11 sternum sections of 11 mice, n = 338 GP from total 15 sternum sections of 12 mice). c, xy graphs showing the location of GP, PN, and IN in mouse sternum sections (left); the different color coded PN/IN clusters identified using the K-means algorithm (center); and PN/IN clusters containing (pink) or not containing (blue) GP within the cluster. d, Number of PN and IN in each type of cluster. n = 1443 PN from total 3 sternum sections of 3 mice in cluster with GP, n = 1050 PN from total 3 sternum sections of 3 mice in cluster without GP. n = 880 IN from total 3 sternum sections of 3 mice in cluster with GP, n = 866 PN from total 3 sternum sections of 3 mice in cluster without GP. e, Experimental design, representative image, and histogram showing the percentage of CFP, GFP, RFP and YFP positive cells in fate mapping experiments using Ubc-creERT2:confetti mice. Scale bar = 10 μm. Each dot represents one sternum segment from total 3 confetti mice. f, In the confetti model GFP is detected in the nucleus whereas RFP is expressed in the cytoplasm. The images show that by using antibodies conjugated to fluorochromes (Alexa Flour488 and Phycoerythrin, PE) that spectrally overlap with GFP or RFP but that stain only the membrane we could distinguish CD11b-Alexa488+GFP-, Ly6C-Alexa488+GFP- cells from GFP+ cells and CD115-PE+RFP-, and Ly6C-PE+RFP- from RFP+ cells. This allowed us to examine the relationships between YFP- or CFP-labeled cells. Since we could not distinguish the membrane signal from the nuclear/cytoplasmic signal in GFP+ or RFP+ cells these were discarded from the analyses. Scale bar = 10 μm. g, Percentage of PN clusters with at least 1 confetti-labeled PN that are oligoclonal (containing cells with at least two different origins: CFP+, YFP+, or no confetti label). Each dot represents one sternum segment from total 3 confetti mice. Statistical differences were calculated using two-tailed Student’s T tests and p values are shown. ns = not significant.
Extended Data Figure 3.
Extended Data Figure 3.. Confetti analyses of mono/DCpoiesis.
a, Histograms showing the observed (color) and random (white) distribution of distances from each MOP to the closest indicated cells (MOP-Ly6Chi monocyte, n = 137 MOP from 3 total sternum sections of 3 mice; MOP-Ly6Clo monocyte, n = 171 MOP from total 4 sternum sections of 4 mice; MOP-cDC, n = 200 MOP from total 5 sternum sections of 4 mice). b, Maps showing the location of Gfi1hi and Gfi1lo MOP, MDP, Ly6Chi, and Ly6Clo monocytes in a sternum segment from Gfi1-tomato mice. Scale bar = 200 μm. c, Number of Gfi1hi and Gfi1lo MOP per sternum segment. Each dot represents one sternum segment from 3 Gfi1-tomato mice in two experiments. d, Histograms showing the observed (color) and random (white) distribution of distances from each Gfi1hi MOP (orange) and Gfi1loMOP (purple) to the closest indicated cells. n = 113 Gfi1hi MOP and n = 72 Gfi1lo MOP from total 3 sternum segments from 3 mice. e, Representative image showing lack of contribution of a confetti-labeled MOP to surrounding monocytes. Tracked cells are YFP+, CFP+ or unlabeled CD117+CD115+CD11b-Ly6C+MOP, CD117-CD115+CD11b+Ly6Chi monocytes and CD117-CD115+CD11b+Ly6Clo monocytes. Scale bar = 20 μm. f, Quantification of cell numbers for CFP- (white) and CFP+ (blue) Ly6Chi monocytes (up) or Ly6Clo monocytes (down) found within the indicated distances to the closest CFP+ MOP cell. Each dot represents one CFP+ MOP (n = 9 MOP from total 6 sternum segments from 4 confetti mice). g, h, Histograms showing the observed (color) and random (white) distribution of distances from each Ly6Clo Mo (yellow) and cDC (pink) to the six closest indicated neighbor cells. n = 1603 Ly6Clo monocytes from total 3 sternum segments of 3 mice; n = 1228 cDC from total 6 sternum segments of 6 mice. i. Image showing lack of contribution of a CFP+ MDP to surrounding Ly6Clo monocytes. Tracked cells are YFP+, CFP+ or unlabeled CD117+CD115+CD11b-Ly6C-MDP, CD117+CD115+CD11b-Ly6C+ MOP, CD117-CD115+CD11b+Ly6Chi monocytes and CD117-CD115+CD11b+Ly6Clomonocytes. Scale bar = 20 μm. j, Image showing lack of association between confetti-labeled Ly6Chi and Ly6Clo monocytes. Tracked cells are YFP+, CFP+ or unlabeled CD11b+CD115+CD117-Ly6Chi monocytes and CD11b+CD115+CD117-Ly6Clo monocytes. Scale bar = 40 μm or 10 μm for zoomed in image. The histograms show the observed (color) and random (white) distribution of distances from each confetti-labeled Ly6Chi (blue) or Ly6Clo monocytes (yellow) to the closest Ly6Chi or Ly6Clo monocyte in the same color. n = 48 confetti-labeled Ly6Chi monocytes, and n=32 confetti-labeled Ly6Clo monocytes from total 3 sternum sections of 3 mice. k, Image showing lack of association between confetti labeled cDC. Tracked cells are RFP+, GFP+, YFP+, CFP+ or unlabeled MCHII+ reticulated cDC. Scale bar = 40 μm or 10 μm for zoomed in image. The histogram shows the observed (color) and random (white) distribution of distances from each confetti-labeled cDC (pink) to the closest cDC in the same color. n = 80 confetti-labeled cDC from total 3 sternum sections of 3 mice. Unless otherwise indicated for all graphs one dot corresponds to one cell. Horizontal blue bars indicate the median distance. Statistical differences were calculated using two-tailed Student’s T tests and p values are shown. ns = not significant.
Extended Data Figure 4.
Extended Data Figure 4.. The architecture of myelopoiesis is similar in different sternum sections.
a, Observed distributions of distances for individual sternum sections (Ob), the pooled values, or random (Rd) simulations for the data shown in Extended Data Fig. 2b. For distance to GMP, n = 25, 22, 19, 20 GMP per sternum section from total 4 sternum sections in 4 mice; n = 11, 12, 11, 10 MDP per sternum section from total 4 sternum sections in 4 mice; n = 40, 37, 42, 46 MOP per sternum section from total 4 sternum sections in 4 mice; n = 19, 21, 17, 26 GP per sternum section from total 4 sternum sections in 4 mice. For distance to MDP, n = 25, 22, 19, 20 GMP per sternum section from total 4 sternum sections in 4 mice; n = 13, 14, 11, 9, 7, 14, 14, 14, 9, 11, 12, 10, 10, 11, 13, 11 MDP per sternum section from total 16 sternum sections in 16 mice; n = 40, 37, 42, 46 MOP per sternum section from total 4 sternum sections in 4 mice; n = 22, 24, 23, 28, 23, 16, 24, 18, 22, 21, 17, 26, 25, 20 GP per sternum section from total 14 sternum sections in 14 mice; For distance to MOP, n = 25, 22, 19, 20 GMP per sternum section from total 4 sternum sections in 4 mice; n = 9, 11, 12, 10, 11, 13, 11, 10, 14, 11, 13, 10, 9, 11, 10, 14 MDP per sternum section from total 16 sternum sections in 16 mice; n = 39, 49, 38, 33, 44, 36, 37, 44 MOP per sternum section from total 8 sternum sections in 8 mice; n = 22, 24, 28, 23, 16, 24, 18, 22, 21, 17, 26, 25, 20 GP per sternum section from total 13 sternum sections in 13 mice; For distance to GP, n = 25, 22, 19, 20 GMP per sternum section from total 4 sternum sections in 4 mice; n = 15, 12, 11, 10, 15, 9, 12, 11, 12, 11, 13, 10, 9, 11, 10, 15 MDP per sternum section from total 16 sternum sections in 16 mice; n = 40, 37, 42, 46, 39, 39, 49, 53, 38, 34 MOP per sternum section from total 10 sternum sections in 10 mice; n = 24, 23, 23, 28, 29, 22, 26, 17, 26 GP per sternum section from total 9 sternum sections in 9 mice. b, c, As “a” but corresponding to the data shown in Fig. 2c and Fig. 2i. n = 24, 23, 28 GP per sternum section from total 3 sternum sections in 3 mice; For MDP to Ly6Chi and lo Mo, n = 11, 14, 8, 9, 9, 16 MDP per sternum section from total 6 sternum sections in 4 mice. For MDP to cDC, n = 13, 14, 12, 9, 16, 15, 15, 10, 10, 10, 15 MDP per sternum section from total 11 sternum sections in 6 mice. d, e, Through the manuscript we have indistinctly used coronal and sagittal sternum sections. The maps show granulopoiesis in coronal and sagittal sternum sections shown or analyzed in Fig. 2a or Extended Data Fig. 2a (d) and observed and random distributions of distances for the indicated cells in each section or the pooled data for each type of section (e). n = 23 and 28 GP in coronal sections and 24 and 23 GP in sagittal sections. Scale bar = 200 μm. f, g, Representative maps of mono/DCpoiesis comparing coronal and sagittal sternum sections with those shown or analyzed in Fig. 2a (f) and observed and random distributions of distances for the indicated cells in coronal or sagittal sections (g). n = 11 or 10 MDP, 390 or 334 Ly6Clo Monocyte, and 218 or 258 cDC in coronal sections; n = 9 or 10 MDP, 419 or 380 Ly6Clo Monocyte and 183 or 159 cDC in sagittal sections. Scale bar = 200 μm. Statistical differences were calculated using two-tailed Student’s T tests and p values are shown. ns = not significant.
Extended Data Figure 5.
Extended Data Figure 5.. Myeloid progenitor interaction with the microenvironment and HSC.
a, Representative image showing simultaneous detection of Pre- and Immature neutrophils, Ly6Clo monocytes and cDC. Scale bar = 10 μm. b, Map showing the location of the indicated cells in the bone marrow. Each dot corresponds to one cell. Note that the radius of each dot is 2x the average radius of the cell. Scale bar = 200 μm. c, Histograms showing the distance from each Ly6Clo Mo (yellow dots) or cDC (pink dots) and their random simulation (white dots) to the closest indicated cell (Ly6Clo to PN/IN, n = 500 Ly6Clo; cDC to PN/IN, n = 727 cDC; Ly6Clo to cDC, n = 1322 Ly6Clo Mo; from total 3 sternum sections of 3 mice). d, High-power images showing the relative positions of MDP, MOP, GP and sinusoids. Scale bar = 10 μm. e, Histograms showing the distance from each MDP (green dots), MOP (orange dots), GP (red dots) or random distribution (white dots) to the closest indicated structure (for distances to arterioles: n = 62 MDP from total 6 sternum sections of 6 mice; n = 218 MOP, and n = 114 GP from total 5 sternum sections of 5 mice; for distances to endosteal surface n = 98 MDP, n = 410 MOP, n = 217 GP, from total 9 sterna of 6 mice). f, Representative images of multiple sternum segments showing that MDP are evenly distributed through the bone marrow, consistent with their sinusoidal location. Scale bar = 200 μm. g, Representative image showing detection of HSC and MDP in a single stain. Scale bar = 10 μm. h, Quantification of MDP and Lin- CD117+CD48-CD41dimCD150+ HSC in femurs by FACS (white) or imaging (orange) analyses. Each dot corresponds to one mouse femur or sternum image. n = 4. i, Representative image showing detection of HSC and a population containing CD117+Ly6C+ GP and MOP in a single stain. Scale bar = 10 μm. j, Maps and histograms showing the relationships between HSC and MDP or GP/MOP in the bone marrow. In the map the dot radius is three times the average cell radius. Scale bar = 200 μm. (n = 35 MDP from total 4 sternum sections of 3 mice and n = 191 GP and MOP from total 3 sternum sections of 3 mice). Unless otherwise indicated for all graphs one dot corresponds to one cell. Horizontal blue bars indicate the median distance. Statistical differences were calculated using two-tailed Student’s T tests and p values are shown. ns = not significant.
Extended Data Figure 6.
Extended Data Figure 6.. Broad comparison of stromal bone marrow compartments by single-cell RNA-Seq.
Comparative analyses of two previously described scRNA-Seq datasets profiling stromal and hematopoietic cell population in bone marrow (9,165 cells from Tikhonova et al. and 89,007 cells Baryawno et al.). a-c, Cell population predictions displayed on a UMAP plot from an unsupervised analysis of the two separate scRNA-Seq datasets (ICGS version 2). Distinct captures are denoted by the gating strategy (col2.3, niche col2.3, niche-LepR+, niche VEcad+). Populations are denoted as hematopoietic or stromal/mesenchymal based on prior-defined scRNA-Seq cell population marker gene signatures (ICGS – see cluster labels). d-l, Relative expression of ICGS2 cell-population marker genes (identified in both datasets) projected on to the two UMAP plots to verify cell identity, relative to capture strategy. Supplementary Table 2 shows the different ICGS2 marker genes and Cell barcode assignments for the difference cell clusters identified.
Extended Data Figure 7.
Extended Data Figure 7.. CSF1 from LepR+ cells is dispensable for myelopoiesis.
a. qPCR analyses showing Csf1 mRNA levels (relative to Gapdh) in Nestin-GFPdim perivascular cells (which largely overlap with LepR+ perivascular cells). n = total 4 control mice and n = total 4 Csf1ΔLepR mice in four experiments. b, c, Number of BM cells or the indicated populations in the femur of control or Csf1ΔLepR mice. n = total 6 control and n = total 8 Csf1ΔLepR mice in six experiments. d, Colony forming activity (blue: GMP, green: MDP, orange: MOP, red: GP) of the indicated progenitors FACS-purified from control (diamonds, n = 5) or Csf1ΔLepR (circles, n = 5) total mice in four experiments. e, Number of the indicated populations in the blood of control or Csf1ΔLepR mice. For all panels one dot equals one mouse. n = total 6 control and n= total 8 Csf1ΔLepR mice in six experiments. Statistical differences were calculated using two-tailed Student’s T tests and p values are shown. ns = not significant.
Extended Data Figure 8.
Extended Data Figure 8.. CSF1 from a subset of endothelial cells is necessary for DCpoiesis.
a, qPCR analyses showing Csf1 mRNA levels (normalized to endothelial Control) in FACS-purified endothelial cells and the indicated hematopoietic cells in control or Csf1ΔEC mice; n = total 4 control and n = total 4 Csf1ΔEC mice in four experiments. Note that although Cdh5-cre also recombines in subsets of hematopoietic cells it does not affect Csf1 expression in these cells. (n.d = none detected); n = total 3 control and n = total 3 Csf1ΔEC mice in three experiments. b, Colony forming activity (blue: GMP, green: MDP, orange: MOP, red: GP) of the indicated progenitors FACS-purified from control (diamonds, n = 5) or Csf1ΔEC (circles, n = 5) total mice in four experiments. c, d, Number (c) and CFU-M activity (d) of GMP or MOP from control or Csf1ΔEC mice. n = total 6 control and n = total 6 Csf1ΔEC mice in five experiments. e, Number of Ly6Chi and Ly6Clo monocytes in the bone marrow and peripheral blood of control or Csf1ΔEC mice. n = total 8 control and n = total 8 Csf1ΔEC mice in six experiments. f-h, Number of BM cells for the indicated populations in the femur or blood of control or Csf1ΔEC mice. n = total 8 control and n = total 8 Csf1ΔEC mice in six experiments. i, Volume and number of vessels in sternum sections of control or Csf1ΔEC mice. Each dot represents one sternum segment from n = 3 control and n = 3 Csf1ΔEC mice. j, The panels show the percentage of the indicated CD45.2+ cells in the blood of lethally irradiated CD45.1+ recipients after transplant of 106 BM cells purified from Ctrl ( white dots) or Csf1ΔEC mice (red dots) - both CD45.2+- together with 106 CD45.1+ competitor cells at the indicated time points after transplantation. The dots show the mean of 12 mice per group and the error bars show standard deviation. k, Representative images showing anti-CSF1 or isotype control stain in the BM of wild-type mice. Scale bars = 200 μm and 10 μm. l, Map of CSF1+ and CSF1- vessels and cDC in Csf1ΔEC mice. Scale bar = 200 μm. m, high-power image showing a CSF1+ vessel and cDC (pink dots) in Ctrl mice. The radius of the dot is 2x the average cDC radius. Scale bar = 20 μm. n, Number of cDC found within the indicated distances of CSF1+ and CSF1- vessels in wild-type (n = 76 CSF1+ vessels and n = 520 CSF1- vessels in total 4 sternum sections of 3 wild-type mice). o, Histograms showing the distance from each cDC to the closest sinusoid in control or Csf1ΔEC mice (n = 451 cDC in total 2 sternum sections of 2 control mice, n = 343 cDC in total 3 sternum sections of 3 Csf1ΔEC mice). p, Maps showing the relocation of MDP away from sinusoids in Csf1ΔEC mice. Scale bars = 200 μm and 10 μm. The radius of the dots is 3x (left map) or 1x (right images) the average radius of the MDP. q, Maps showing the distribution of MDP, Ly6Clo Mo, and cDC in the sternum of control or Csf1ΔEC mice. Scale bar = 200 μm. The radius of the dot is 3x (MDP) or 2x (all other cells) the average radius of the replaced cell. r, Histograms showing the distribution of distances from each MDP to the six closest Ly6Clo Mo or cDC in control or Csf1ΔEC mice (For MDP-Ly6Clo monocyte, n = 37 MDP from total 4 sternum sections of 3 Control mice, n = 18 MDP from total 4 sternum sections of 3 Csf1ΔEC mice. For MDP-cDC, n = 47 MDP from total 6 sternum sections of 3 Control mice, n = 47 MDP from total 9 sternum sections of 3 Csf1ΔEC mice). Unless otherwise indicated for panels a-i each dot corresponds to one mouse; for panels l-r each dot corresponds to one cell. Statistical differences were calculated using two-tailed Student’s T tests and p values are shown. ns= not significant.
Extended Data Figure 9.
Extended Data Figure 9.. Changes in progenitor localization after infection.
a, Average percentage of the indicated cells per femur (normalized to day 0) at the indicated time points after L. monocytogenes infection of wild-type mice. (n = 6 mice for day 0 and day 2, n = 3 mice for day 4, n = 4 mice for day 6 and n = 3 mice for day 8). b, Histograms showing the distribution of distances from each MDP (green, n = 188 MDP from total 16 sternum sections of 6 uninfected wild-type mice and n = 37 MDP from total 3 sternum sections of 3 wild-type mice four days after L. monocytogenes infection), MOP (orange, n = 165 MOP from total 4 sternum sections of 3 uninfected wild-type mice and n = 377 MOP from total 3 sternum sections of 3 wild-type mice four days after L. monocytogenes infection) or GP (red, n = 308 GP from total 14 sternum sections of 6 uninfected wild-type mice and n = 218 GP from total 3 sternum sections of 3 wild-type mice four days after L. monocytogenes infection) to the indicated progenitors four days after L. monocytogenes infection of wild-type mice. c, number of GP or MOP per cluster for the sternum sections analyzed in b. Each dot represents a cluster; n = 16 GP clusters and n = 15 MOP clusters from total 3 wild-type mice four days after L. monocytogenes infection. d, Experimental design for in vivo fate mapping using Ubc-creERT2:confetti mice. e, Percentage of GP or MOP clusters with at least 1 confetti labeled GP or MOP that are monoclonal (all cells in the cluster are labeled in the same confetti color) or oligoclonal (containing cells with at least two different origins: CFP+, YFP+, or no confetti label). Each dot represents a GP or MOP cluster from total 3 sternum segments from 2 confetti mice in two experiments four days after L. monocytogenes infection. f, Representative image showing a cluster composed of MDP-derived Gfi1lo and GMP-derived Gfi1hi MOP in Gfi1-tomato mice four days after L. monocytogenes infection. Scale bar = 10 μm. g, Percentage of GMP-derived Gfi1hi MOP (orange dots) or MDP-derived Gfi1lo MOP (purple dots) per cluster (each dot = 1 cluster, n = 15 clusters in total 3 sternum sections from 2 Gfi1-tomato mice four days after L. monocytogenes infection). h, Quantification of CD117 expression in PN of wild type mice at the indicated time points after infection. (n = 6 mice for day 0, n = 8 mice for day 2 and day 4, n = 5 mice for day 6 and n = 4 mice for day 8). i, Map showing the location of Gfi1hi and Gfi1lo MOP, MDP, Ly6Chi, and Ly6Clo monocytes in a sternum segment from Gfi1-tomato mice four days after infection. Scale bar = 200 μm. j, Histograms showing the distribution of distances from each Gfi1hi (orange) and Gfi1lo (purple) MOP and MDP (green) to the indicated cells in uninfected wild-type mice or four days after L. monocytogenes infection. Note that the d0 values are the same as shown in Fig. 2g,i. (n = 113 Gfi1hi MOP and n = 72 Gfi1lo MOP from total 3 sternum sections of 3 uninfected Gfi1-tomato mice; n = 155 Gfi1hi MOP and n = 144 Gfi1lo MOP from total 3 sternum sections of 2 Gfi1-tomato mice four days after L. monocytogenes infection; MDP-Ly6Chi monocyte, n = 67 MDP from total 6 sternum sections of 4 mice; MDP-Ly6Clo monocyte, n = 67 MDP from total 6 sternum sections of 4 wild-type uninfected mice; MDP-cDC, n = 139 MDP from total 11 sternum sections of 6 wild-type uninfected mice; and n = 32 MDP from total 3 sternum sections of 3 wild-type mice four days after L. monocytogenes infection). k, Representative image showing lack of contribution of a confetti-labeled MOP. Tracked cells are YFP+, CFP+ or unlabeled CD117+CD115+CD11b-Ly6C+ MOP, CD117-CD115+CD11b+Ly6Chi monocytes and CD117-CD115+CD11b+Ly6Clo monocytes. Scale bar = 10 μm. l, Quantification of cell numbers for CFP- (white) and CFP+ (blue) Ly6Chi monocytes (left) or Ly6Clo monocytes (right) found within the indicated distances to the closest CFP+ MOP cell in the confetti mice four days after L. monocytogenes infection. Each dot represents one CFP+ MOP from total 8 sternum segment of 2 confetti mice in two experiments four days after L. monocytogenes infection. m, Representative image showing lack of contribution of a confetti-labeled MDP to surrounding monocytes. Tracked cells are YFP+, CFP+ or unlabeled CD117+CD115+CD11b-Ly6C- MDP, CD117+CD115+CD11b-Ly6C+ MOP, CD117-CD115+CD11b+Ly6Chi monocytes and CD117-CD115+CD11b+Ly6Clo monocytes. Scale bar = 20 μm. n, qPCR analyses showing Csf1 mRNA levels (normalized to not infected) in BM endothelial cells FACS-purified from wild-type mice in the steady-state or 4 days after infection. n = total 3 uninfected mice and n = total 3 infected mice in two experiments. o, Histogram showing the distance from each MDP to the closest sinusoid in control (pool of Cre:Csf1+/−, Csf1+/−, and Csf1fl/-) or Csf1ΔEC mice 4 days after infection. n = 58 MDP from total 4 sternum sections of 3 control mice and n = 36 MDP from total 4 sternum sections of 3 Csf1ΔEC mice. p, q, Maps (p) showing the location of the indicated cells; and histogram (q) showing the distance from each MDP to the closest Ly6Clo monocyte and cDC in control or Csf1ΔEC mice 4 days after infection. n = 51 MDP from total 3 sternum sections of 3 control mice and n = 29 MDP from total 3 sternum sections of 3 Csf1ΔEC mice. r. Number of the indicated cells per femur in control or Csf1ΔEC mice 4 days after infection. Each dot indicates one mouse. n = 3 control and n = 3 Csf1ΔEC mice. Unless otherwise indicated for all panels one dot = one cell. Statistical differences were calculated using two-tailed Student’s T tests and p values are shown. ns = not significant.
Extended Data Figure 10.
Extended Data Figure 10.. Architecture of myelopoiesis in the steady-state and after infection.
The models show the spatial distribution and average distances between the indicated cells in the steady-state and four days after infection with Listeria monocytogenes.
Figure 1.
Figure 1.. Stain development.
a, Schematic representation of myelopoiesis. b, FACS gates for isolation and imaging of the indicated progenitors. c, d, Cells per femur (c) and colonies produced (d) blue: GMP; green: MDP, orange: MOP, red: GP; n = total 3 mice in two experiments) for progenitors isolated as published, (diamonds) or as shown in b (circles). e, Frequencies for the indicated populations in sternum by FACS (white) or imaging (orange). n = total 3 mice in three experiments. f, Images of the different progenitors. g, FACS gates for isolation and imaging of the indicated progenitors. h, i, Images showing the different myeloid cells. For all panels scale bar = 10 µm. Statistical differences were calculated using two-tailed Student’s T tests. ns = not significant.
Figure 2.
Figure 2.. Atlas of myelopoiesis.
a, Maps of the indicated cells in a 35 µm optical slice of the sternum. Dots are 3x (progenitors), 1.5x (MN), or 2x (all other cells) the average size of the replaced cell. Color squares highlight representative PN clusters around GP (red) or without GP (blue) or areas around MDP (green) or MOP (orange). b, Neutrophil differentiation around a GP. c, Observed and random distances from each GP to the closest indicated cell in clusters associated with GP (n = 75 GP in total 3 sections of 3 mice). d, Oligoclonal preneutrophil cluster in confetti mice. Cells are YFP+, CFP+ or unlabeled CD11b-CD115-CD117+Ly6C+Ly6G- GP and CD11b+CD115-CD117+Ly6C+Ly6G- PN. e, Distances from each confetti-labeled GP or PN to the closest PN labeled in the same color (n = 30 GP in total 9 sections of 3 mice, n = 171 PN in total 3 sections of 3 mice). f, Images showing Gfi1hi and Gfi1lo MOP in Gfi1-tomato mice. g, Distances from each MOP to the closest indicated cell. (n = 113 Gfi1hi MOP and 72 Gfi1lo MOP in total 3 sections of 3 Gfi1-tomato mice). h, Ly6Clo monocyte and cDC localization near MDP. i, Distances from each MDP to the closest indicated cell (MDP-Ly6Chi or MDP-Ly6Clo monocyte, n = 67 MDP from total 6 sections of 4 mice; MDP-cDC, n = 139 MDP from total 11 sections of 6 mice). j, Image showing lack of contribution of a CFP+ MDP to surrounding cDC. In graphs one dot = one cell. Horizontal blue bars indicate the median distance. Unless indicated in all images each dot represents the size of the replaced cell. Statistical differences were calculated using two-tailed Student’s T tests and p values are shown. ns = not significant. For maps and images scale bars are 200 and 10 µm, respectively.
Figure 3.
Figure 3.. CSF1+ vessels organize myelopoiesis.
a, Map showing localization of MDP, MOP and GP to sinusoids. b, Progenitor distance to the closest sinusoid, n = 62 MDP, 218 MOP and 114 GP in total 6, 5 and 5 sections from 6 or 5 mice. c, UMAP of BM cells. Color coded clusters are reanalyses of published data. Right panels: Cdh5, Lepr, and Csf1 expression. d, e, Cells per femur (d) or MDP-derived CFU-M (e) in control (pool of Cre:Csf1+/−, Csf1+/−, and Csf1fl/-) or Csf1ΔEC mice; 1 dot = 1 mouse. f, Map of CSF1+ and CSF1- vessels and cDC in Ctrl mice. g, cDC distance to the closest CSF1+ vessel (n = 442 cDC from total 4 sections of 3 WT mice). h, MDP distance to the closest vessel (n = 44 MDP from total 5 sections of 3 control mice; n = 29 MDP from total 5 sections of 3 Csf1ΔEC mice). i, MDP distance to closest Ly6Clo monocyte or cDC. For MDP-Ly6Clo monocyte, n = 37 MDP from total 4 sections of 3 control mice, n = 18 MDP from total 4 sections of 3 Csf1ΔEC mice. For MDP-cDC, n = 47 MDP from total 6 sections of 3 control mice, n = 47 MDP from total 9 sections of 3 Csf1ΔEC mice). Unless indicated 1 dot = 1 cell. Progenitor dots are thrice – and cDC dots twice- the size of the replaced cell. Scale bars = 200 μm. Statistical differences were calculated using two-tailed Student’s T tests and p values are shown. ns = not significant.
Figure 4.
Figure 4.. Atlas of stress myelopoiesis.
a, Average percentage of cells per femur (normalized to day 0) after L. monocytogenes infection (n = total 6, 6, 3, 4 and 3 mice for days 0, 2, 4, 6 and 8). b, Maps of myelopoiesis in infected mice. c, Image showing a monoclonal GP cluster (left) or oligoclonal MOP cluster (right) in confetti mice four days after L. monocytogenes infection. GP were tracked as YFP+, CFP+ or unlabeled CD11b-CD115-CD117+Ly6C+ cells. MOP were tracked as YFP+, CFP+, or unlabeled CD11b-CD115+CD117+Ly6C+ cells. d, e, Map (d) showing myeloid progenitors, sinusoids, and arterioles; and distances from each progenitor to the closest sinusoid (e) in WT mice uninfected (same as Fig. 3b) or four days after infection. n = 62 MDP from total 6 sternum sections of 6 uninfected wild-type mice and n = 41 MDP from total 3 sternum sections of 3 wild-type mice four days after infection; n = 218 MOP and n = 114 GP from total 5 sternum sections of 5 mice in wild-type mice; n = 463 MOP and n = 241 GP from total 3 sternum sections of 3 wild-type mice four days after infection (1 dot = 1 cell). Horizontal blue bars indicate the median. f, g, Number of the indicated cells per femur in control or Csf1ΔEC mice four days after infection (1 dot = 1 mouse in two independent experiments). For maps Scale bar = 200 μm, for images Scale bar = 10 μm. Statistical differences were calculated using two-tailed Student’s T tests and p values are shown. ns = not significant.

References

    1. Stanley ER & Chitu V CSF-1 receptor signaling in myeloid cells. Cold Spring Harb Perspect Biol 6, doi: 10.1101/cshperspect.a021857 (2014). - DOI - PMC - PubMed
    1. Olsson A et al. Single-cell analysis of mixed-lineage states leading to a binary cell fate choice. Nature 537, 698–702, doi: 10.1038/nature19348 (2016). - DOI - PMC - PubMed
    1. Nestorowa S et al. A single-cell resolution map of mouse hematopoietic stem and progenitor cell differentiation. Blood 128, e20–31, doi: 10.1182/blood-2016-05-716480 (2016). - DOI - PMC - PubMed
    1. Tusi BK et al. Population snapshots predict early haematopoietic and erythroid hierarchies. Nature 555, 54–60, doi: 10.1038/nature25741 (2018). - DOI - PMC - PubMed
    1. Sun J et al. Clonal dynamics of native haematopoiesis. Nature 514, 322–327, doi: 10.1038/nature13824 (2014). - DOI - PMC - PubMed

Additional References

    1. Harris SE et al. Meox2Cre-mediated disruption of CSF-1 leads to osteopetrosis and osteocyte defects. Bone 50, 42–53, doi: 10.1016/j.bone.2011.09.038 (2012). - DOI - PMC - PubMed
    1. Thambyrajah R et al. GFI1 proteins orchestrate the emergence of haematopoietic stem cells through recruitment of LSD1. Nat Cell Biol 18, 21–32, doi: 10.1038/ncb3276 (2016). - DOI - PubMed
    1. Liu Z et al. Fate Mapping via Ms4a3-Expression History Traces Monocyte-Derived Cells. Cell 178, 1509–1525 e1519, doi: 10.1016/j.cell.2019.08.009 (2019). - DOI - PubMed
    1. Bowers E et al. Granulocyte-derived TNFalpha promotes vascular and hematopoietic regeneration in the bone marrow. Nat Med 24, 95–102, doi: 10.1038/nm.4448 (2018). - DOI - PMC - PubMed
    1. Schlitzer A et al. Identification of cDC1- and cDC2-committed DC progenitors reveals early lineage priming at the common DC progenitor stage in the bone marrow. Nat Immunol 16, 718–728, doi: 10.1038/ni.3200 (2015). - DOI - PubMed

Publication types

MeSH terms

Substances