. 2021 Feb;590(7845):290-299.
doi: 10.1038/s41586-021-03205-y. Epub 2021 Feb 10.

Sequencing of 53,831 diverse genomes from the NHLBI TOPMed Program

Daniel Taliun #  1   2 Daniel N Harris #  3   4   5 Michael D Kessler #  3   4   5 Jedidiah Carlson #  6   7 Zachary A Szpiech #  8   9 Raul Torres #  10 Sarah A Gagliano Taliun #  1   2 André Corvelo #  11 Stephanie M Gogarten  12 Hyun Min Kang  1   2 Achilleas N Pitsillides  13 Jonathon LeFaive  1   2 Seung-Been Lee  7 Xiaowen Tian  12 Brian L Browning  14 Sayantan Das  1   2 Anne-Katrin Emde  11 Wayne E Clarke  11 Douglas P Loesch  3   4   5 Amol C Shetty  3   4   5 Thomas W Blackwell  1   2 Albert V Smith  1   2 Quenna Wong  12 Xiaoming Liu  15 Matthew P Conomos  12 Dean M Bobo  16 François Aguet  17 Christine Albert  18 Alvaro Alonso  19 Kristin G Ardlie  17 Dan E Arking  20 Stella Aslibekyan  21 Paul L Auer  22 John Barnard  23 R Graham Barr  24   25 Lucas Barwick  26 Lewis C Becker  27 Rebecca L Beer  28 Emelia J Benjamin  29   30   31 Lawrence F Bielak  32 John Blangero  33   34 Michael Boehnke  1   2 Donald W Bowden  35 Jennifer A Brody  36   37 Esteban G Burchard  38   39 Brian E Cade  40   41 James F Casella  42   43 Brandon Chalazan  44 Daniel I Chasman  45   46 Yii-Der Ida Chen  47 Michael H Cho  48 Seung Hoan Choi  17 Mina K Chung  49   50   51 Clary B Clish  52 Adolfo Correa  53   54   55 Joanne E Curran  33   34 Brian Custer  56   57 Dawood Darbar  58 Michelle Daya  59 Mariza de Andrade  60 Dawn L DeMeo  48 Susan K Dutcher  61   62 Patrick T Ellinor  63 Leslie S Emery  12 Celeste Eng  39 Diane Fatkin  64   65   66 Tasha Fingerlin  67 Lukas Forer  68 Myriam Fornage  69 Nora Franceschini  70 Christian Fuchsberger  1   2   68   71 Stephanie M Fullerton  72 Soren Germer  11 Mark T Gladwin  73   74   75 Daniel J Gottlieb  76   77 Xiuqing Guo  47 Michael E Hall  53 Jiang He  78   79 Nancy L Heard-Costa  31   80 Susan R Heckbert  37   81 Marguerite R Irvin  82 Jill M Johnsen  36   83 Andrew D Johnson  31   84 Robert Kaplan  85 Sharon L R Kardia  32 Tanika Kelly  78 Shannon Kelly  86   87   88 Eimear E Kenny  16 Douglas P Kiel  17   40   89   90 Robert Klemmer  1   2 Barbara A Konkle  36   83 Charles Kooperberg  91 Anna Köttgen  92   93 Leslie A Lange  94 Jessica Lasky-Su  40   41   48   95 Daniel Levy  29   31   84 Xihong Lin  96 Keng-Han Lin  1   2 Chunyu Liu  13 Ruth J F Loos  97   98 Lori Garman  99 Robert Gerszten  100 Steven A Lubitz  18 Kathryn L Lunetta  13 Angel C Y Mak  39 Ani Manichaikul  101   102 Alisa K Manning  40   103   104 Rasika A Mathias  105 David D McManus  106 Stephen T McGarvey  107   108   109 James B Meigs  110 Deborah A Meyers  111 Julie L Mikulla  28 Mollie A Minear  28 Braxton D Mitchell  4   5   112 Sanghamitra Mohanty  113   114 May E Montasser  4   5 Courtney Montgomery  99 Alanna C Morrison  115 Joanne M Murabito  29 Andrea Natale  113 Pradeep Natarajan  40   63   116   117 Sarah C Nelson  12 Kari E North  70 Jeffrey R O'Connell  4   5 Nicholette D Palmer  35 Nathan Pankratz  118 Gina M Peloso  13 Patricia A Peyser  32 Jacob Pleiness  1   2 Wendy S Post  119 Bruce M Psaty  36   37   81   120   121 D C Rao  122 Susan Redline  40   41 Alexander P Reiner  81   91 Dan Roden  123 Jerome I Rotter  47 Ingo Ruczinski  124 Chloé Sarnowski  13 Sebastian Schoenherr  68 David A Schwartz  125 Jeong-Sun Seo  126   127   128 Sudha Seshadri  31   129 Vivien A Sheehan  130   131 Wayne H Sheu  132 M Benjamin Shoemaker  123 Nicholas L Smith  81   121   133 Jennifer A Smith  32   134 Nona Sotoodehnia  37 Adrienne M Stilp  12 Weihong Tang  135 Kent D Taylor  47 Marilyn Telen  136 Timothy A Thornton  12 Russell P Tracy  137 David J Van Den Berg  138 Ramachandran S Vasan  29   31 Karine A Viaud-Martinez  139 Scott Vrieze  140 Daniel E Weeks  141   142 Bruce S Weir  12 Scott T Weiss  40   41   48   95 Lu-Chen Weng  18 Cristen J Willer  6   143   144 Yingze Zhang  73   74   75 Xutong Zhao  1   2 Donna K Arnett  145 Allison E Ashley-Koch  146 Kathleen C Barnes  59 Eric Boerwinkle  147   148 Stacey Gabriel  17 Richard Gibbs  148 Kenneth M Rice  12 Stephen S Rich  101   102 Edwin K Silverman  48 Pankaj Qasba  28 Weiniu Gan  28 NHLBI Trans-Omics for Precision Medicine (TOPMed) ConsortiumGeorge J Papanicolaou  28 Deborah A Nickerson  7   149   150 Sharon R Browning  12 Michael C Zody  11 Sebastian Zöllner  1   2   151 James G Wilson  152 L Adrienne Cupples  153   154 Cathy C Laurie  155 Cashell E Jaquish  156 Ryan D Hernandez  157   158   159   160   161 Timothy D O'Connor  162   163   164 Gonçalo R Abecasis  165
Collaborators, Affiliations

Sequencing of 53,831 diverse genomes from the NHLBI TOPMed Program

Daniel Taliun et al. Nature. 2021 Feb.

Abstract

The Trans-Omics for Precision Medicine (TOPMed) programme seeks to elucidate the genetic architecture and biology of heart, lung, blood and sleep disorders, with the ultimate goal of improving diagnosis, treatment and prevention of these diseases. The initial phases of the programme focused on whole-genome sequencing of individuals with rich phenotypic data and diverse backgrounds. Here we describe the TOPMed goals and design as well as the available resources and early insights obtained from the sequence data. The resources include a variant browser, a genotype imputation server, and genomic and phenotypic data that are available through dbGaP (Database of Genotypes and Phenotypes)1. In the first 53,831 TOPMed samples, we detected more than 400 million single-nucleotide and insertion or deletion variants after alignment with the reference genome. Additional previously undescribed variants were detected through assembly of unmapped reads and customized analysis in highly variable loci. Among the more than 400 million detected variants, 97% have frequencies of less than 1% and 46% are singletons that are present in only one individual (53% among unrelated individuals). These rare variants provide insights into mutational processes and recent human evolutionary history. The extensive catalogue of genetic variation in TOPMed studies provides unique opportunities for exploring the contributions of rare and noncoding sequence variants to phenotypic variation. Furthermore, combining TOPMed haplotypes with modern imputation methods improves the power and reach of genome-wide association studies to include variants down to a frequency of approximately 0.01%.


Conflict of interest statement

S.D. holds equity in 23andMe. S.A. holds equity in 23andMe. R.G.B. has received funding from NIH, the COPD Foundation and Alpha1 Foundation. J.F.C. is an inventor on a patent licensed to ImmunArray. M.H.C. has received grant support from GSK. D.L.D. has received personal fees from Novartis. P.T.E. is supported by a grant from Bayer to the Broad Institute focused on the genetics and therapeutics of cardiovascular diseases. P.T.E. has also served on advisory boards or consulted for Quest Diagnostics and Novartis. M.T.G. is a co-inventor on pending patent applications and planned patents directed to the use of recombinant neuroglobin and haeme-based molecules as antidotes for CO poisoning, which have been licensed by Globin Solutions. Globin Solutions also has an option to a potential therapeutic for CO poisoning from VCU, hydroxycobalamin. M.T.G. is a shareholder, advisor and director in Globin Solutions. M.T.G. is a co-inventor on patents directed to the use of nitrite salts in cardiovascular diseases, which were previously licensed to United Therapeutics and Hope Pharmaceuticals, and are now licensed to Globin Solutions. M.T.G. is a co-investigator in a research collaboration with Bayer Pharmaceuticals to evaluate riociguate as a treatment for patients with sickle cell disease. M.T.G. has served as a consultant for Epizyme, Actelion Clinical Research, Acceleron Pharma, Catalyst Biosciences, Modus Therapeutics, Sujana Biotech and United Therapeutics Corporation. M.T.G. is on Bayer HealthCare’s Heart and Vascular Disease Research Advisory Board. D.P.K. receives grants to his institution from Amgen and Radius Health, and serves on scientific advisory boards for Solarea Bio and Pfizer. K.H.L. holds equity in 23andMe. S.A.L. receives sponsored research support from Bristol Myers Squibb/Pfizer, Bayer, Boehringer Ingelheim and Fitbit, has consulted for Bristol Myers Squibb/Pfizer and Bayer, and participates in a research collaboration with IBM. D.D.M. receives research support from Bristol Myers Squibb, Care Evolution, Samsung, Apple Computer, Pfizer, Biotronik, Boehringer Ingelheim, Philips Research Institute, Flexcon, Fitbit and has consulted for Bristol Myers Squibb, Pfizer, Fitbit, Philips, Samsung Electronics, Rose Consulting, Boston Biomedical Associates and FlexCon. D.D.M. is also a member of the Operations Committee and Steering Committee for the GUARD-AF Study (NCT04126486) sponsored by Bristol Meyers Squibb and Pfizer. J.B.M. is an Academic Associate for Quest Diagnostics. For B.D.M.: the Amish Research Program receives partial support from Regeneron Pharmaceuticals. M.E.M. is an inventor on a patent that was published by the United States Patent and Trademark Office on 6 December 2018 under Publication Number US 2018-0346888, and an international patent application that was published on 13 December 2018 under Publication Number WO-2018/226560 regarding B4GALT1 Variants And Uses Thereof. P.N. reports grants from Amgen, Apple, Boston Scientific and Novartis, consulting income from Apple, Blackstone Life Sciences, Genentech and Novartis, and spousal employment at Vertex, all unrelated to the present work. B.M.P. serves on the DSMB of a clinical trial funded by the manufacturer (Zoll LifeCor) and on the Steering Committee of the Yale Open Data Access Project funded by Johnson & Johnson. J.-S.S. serves as the chairman of Macrogen. S.T.W. is paid royalties by UpToDate. The spouse of C.J.W. works at Regeneron Pharmaceuticals. R.A.G. is an employee of Baylor College of Medicine that receives revenue from Genetic Testing. E.K.S. in the past three years received grant support from GlaxoSmithKline and Bayer. M.C.Z. owns stock in ThermoFisher and Merck. L.A.C. spends part of her time consulting for Dyslipidemia Foundation, a non-profit company, as a statistical consultant. G.R.A. is an employee of Regeneron Pharmaceuticals, he owns stock and stock options for Regeneron Pharmaceuticals.

Figures

Fig. 1
Fig. 1. Distribution of genetic variants across the genome.
Common (allele frequency ≥ 0.5%) and rare (allele frequency < 0.5%) variant counts are shown above and below the x axis, respectively, within 1-Mb concatenated segments (see Methods). Segments are stratified by CADD functionality score, and sorted based on their number of rare variants according to the functionality category. There were 22 high CADD, 22 medium CADD and 34 low CADD coding segments, and 40 high CADD, 238 medium CADD and 2,381 low CADD noncoding segments. Noncoding regions of the genome with low CADD scores (<10, reflecting lower predicted function) have the largest levels of common and rare variation (noncoding plot region, dark and light blue, respectively), followed by low CADD coding regions (coding plot region, dark and light blue, respectively). Overall, the vast majority of human genomic variation comprises rare variation.
Fig. 2
Fig. 2. Characteristics of singleton clustering patterns.
Parameter estimates for exponential mixture models of singleton density. Each point represents one of the four components in one of the 3,000 individuals in the sample, coloured according to the genetically inferred population of that individual. The rate parameters of each component are shown across the x axis, and the lambda parameters (that is, the proportion that the component contributes to the mixture) are shown on the y axis (on a log–log scale). Histograms show the distribution of the lambda and rate parameters for each component. AFR, African ancestry; EAS, East Asian ancestry; EUR, European ancestry.
Fig. 3
Fig. 3. Retained non-reference ancestral sequences discovered from unmapped reads.
a, Length distribution of fully resolved ancestral sequences, coloured by overlap with GENCODE v.29 genic features. b, Percentage of non-reference (alternative) alleles compared with the percentage of non-reference sequence identified per individual, coloured by population group. c, Venn diagram showing the positional concordance with insertions identified using short-read data from two previous studies,. The number of sequences specific to each study and that have not been partially resolved in the other studies is given between brackets.
Fig. 4
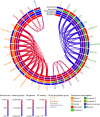
Fig. 4. Ancestry, genetic diversity and rare-variant genetic relatedness across the TOPMed studies.
Each study label is shaded based on their population group. From the outside moving in each track represents: the unrelated sample size of each study used in these calculations, average admixture values, average number of heterozygous sites in each individual’s genome, average number of singleton variants in each individual’s genome and the average within-study rare-variant (RV) sharing comparisons. The links depict the 75th percentile of between-study rare-variant sharing comparisons. All between-study rare-variant sharing comparisons can be found in Supplementary Fig. 29. The sample size, average heterozygosity, number of singletons, within-cohort rare-variant sharing and admixture values by TOPMed study and population group can be found in Supplementary Table 13. Study name abbreviations are defined in Extended Data Tables 1, 2 and Supplementary Table 20.
Fig. 5
Fig. 5. Relative increase in singletons and doubletons of the site frequency spectrum across McVicker’s B and the population size inferred from demographic inference using various sample sizes.
a, The relative increase in the singleton (left) and doubleton (right) bins of the site frequency spectrum for decreasing percentile bins of McVicker’s B compared with the highest percentile bin of B. The higher percentiles of B indicate weaker effects of selection at linked sites (SaLS). These relative increases are plotted for different sample sizes. b, Each point corresponds to the population size inferred in the last generation of an exponential growth model for Europeans. Demographic inference was conducted with different sample sizes for fourfold degenerate sites (n = 4,718,653 sites) and the highest 1% B sites (n = 10,977,437 sites). Error bars show 95% confidence intervals (see Supplementary Table 14 for parameter values). Ne, effective population size.
Extended Data Fig. 1
Extended Data Fig. 1. Principal components of the genotypic data from freeze 5 pooled across studies.
a, Three-dimensional plot of principal components (PC) 1, 2 and 3. b, Parallel coordinate plot colour-coded by categories defined according to race, ancestry and/or ethnic information provided by the study participants and/or by study investigators according to study inclusion criteria. Individuals with missing values for ancestry or ethnicity are excluded.
Extended Data Fig. 2
Extended Data Fig. 2. Distribution of genetic variants across the genome.
After filtering to focus on regions of the genome that are accessible through short-read sequencing, most contiguous 1-Mb segments show similar levels of common (5,141 ± 1,298 variants with MAF ≥ 0.5%) and rare variation (120,414 ± 19,862 variants with MAF < 0.5%). From top to bottom, panel 1 shows the levels of variation across the genome for common coding variants, panel 2 for rare coding variants, panel 3 for common noncoding variants and panel 4 for rare noncoding variants. Variation levels are represented by the Z-score (X-mean/s.d.) of the adjusted variant counts per 1-Mb contiguous segment for each variant category.
Extended Data Fig. 3
Extended Data Fig. 3. Characteristics of singleton clustering patterns.
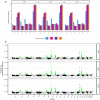
a, Mutational spectra of singletons assigned to each of the four mixture components, separated by population. b, Density of mixture component 2 singletons in 1-Mb windows across the genome. Windows with mixture component 2 singleton counts above the 95th percentile (calculated genome-wide per population subsample) are classified as hotspots and are highlighted in green.
Extended Data Fig. 4
Extended Data Fig. 4. Estimates of recent effective population size by population group.
Each line represents the estimate from a single study, considering only individuals with an annotated population group. The included studies are the same as those in Supplementary Fig. 31. The Amish and Samoan results are individually identified due to their distinct recent population size trajectories. Ne, effective population size. The overlay view is shown in Supplementary Fig. 33.

References

    1. Mailman MD, et al. The NCBI dbGaP database of genotypes and phenotypes. Nat. Genet. 2007;39:1181–1186. - PMC - PubMed
    1. Bycroft C, et al. The UK Biobank resource with deep phenotyping and genomic data. Nature. 2018;562:203–209. - PMC - PubMed
    1. Lek M, et al. Analysis of protein-coding genetic variation in 60,706 humans. Nature. 2016;536:285–291. - PMC - PubMed
    1. Karczewski, K. J. et al. The mutational constraint spectrum quantified from variation in 141,456 humans. Nature581, 431–443 (2020). - PMC - PubMed
    1. Bodea CA, et al. A method to exploit the structure of genetic ancestry space to enhance case–control studies. Am. J. Hum. Genet. 2016;98:857–868. - PMC - PubMed

Publication types

Substances

Grants and funding