The Immunobiogram, a Novel In Vitro Assay to Evaluate Treatment Resistance in Patients Receiving Immunosuppressive Therapy
- PMID: 33569062
- PMCID: PMC7868528
- DOI: 10.3389/fimmu.2020.618202
The Immunobiogram, a Novel In Vitro Assay to Evaluate Treatment Resistance in Patients Receiving Immunosuppressive Therapy
Expression of concern in
-
Expression of Concern: The immunobiogram, a novel in vitro assay to evaluate treatment resistance in patients receiving immunosuppressive therapy.Front Immunol. 2023 Aug 15;14:1272763. doi: 10.3389/fimmu.2023.1272763. eCollection 2023. Front Immunol. 2023. PMID: 37720235 Free PMC article. No abstract available.
Abstract
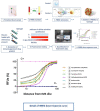
Immunosuppressive drugs are widely used to treat several autoimmune disorders and prevent rejection after organ transplantation. However, intra-individual variations in the pharmacological response to immunosuppressive therapy critically influence its efficacy, often resulting in poor treatment responses and serious side effects. Effective diagnostic tools that help clinicians to tailor immunosuppressive therapy to the needs and immunological profile of the individual patient thus constitute a major unmet clinical need. In vitro assays that measure immune cell responses to immunosuppressive drugs constitute a promising approach to individualized immunosuppressive therapy. Here, we present the Immunobiogram, a functional pharmacodynamic immune cell-based assay for simultaneous quantitative measurement of a patient's immune response to a battery of immunosuppressive drugs. Peripheral blood mononuclear cells collected from patients are immunologically stimulated to induce activation and proliferation and embedded in a hydrogel mixture in which they are exposed to a concentration gradient of the immunosuppressants of interest. Analysis of samples from kidney transplant patients using this procedure revealed an association between the sensitivity of individual patients to the immunosuppressive regimen and their immunological risk of transplant rejection. Incorporation of the Immunobiogram assay into clinical settings could greatly facilitate personalized optimization and monitoring of immunosuppressive therapy, and study of the mechanisms underlying resistance to immunosuppressants.
Keywords: cellular pharmacodynamics; immune cell assay; immunosuppressive therapy monitoring; personalized medicine; transplant rejection.
Copyright © 2021 Portoles, Jimenez, Janeiro, Lopez-Oliva, Ortega-Carrion, Blanquez, Arribas, Gomez, Diez, Pascual and Portero.
Conflict of interest statement
This research involved the use of proprietary technologies belonging to BIOHOPE and covered by European Patent: EP 17 382 399.8 “METHOD FOR PREDICTING AND MONITORING CLINICAL RESPONSE TO IMMUNOMODULATORY THERAPY”. Inventors (current or former employees at Biohope): Javier Dotor de las Herrerias, Marianna di Scala, Veronica Sanchez, Isabel Portero Sanchez. AO, TD, and IP are employees at Biohope. LA and BD were employed by Adamas Engineering Consulting. The authors declare that this study was sponsored by Biohope. Biohope was beneficiary of a full funding from a competitive grant from the European Commission to conduct the study, and coordinated the study and the assignation of the adjudicated (and by EU audited) funding to the entities (research institutions, CRO and statistical company) that took part in the study. The remaining authors declare that the research was conducted in the absence of any commercial or financial relationships that could be construed as a potential conflict of interest.
Figures


Similar articles
-
The IMBG Test for Evaluating the Pharmacodynamic Response to Immunosuppressive Therapy in Kidney Transplant Patients: Current Evidence and Future Applications.Int J Mol Sci. 2023 Mar 8;24(6):5201. doi: 10.3390/ijms24065201. Int J Mol Sci. 2023. PMID: 36982276 Free PMC article.
-
The Immunobiogram, a novel in vitro diagnostic test to measure the pharmacodynamic response to immunosuppressive therapy in kidney transplant patients.Transpl Immunol. 2022 Dec;75:101711. doi: 10.1016/j.trim.2022.101711. Epub 2022 Sep 9. Transpl Immunol. 2022. PMID: 36096417
-
Cellular pharmacodynamics of immunosuppressive drugs for individualized medicine.Int Immunopharmacol. 2007 Jan;7(1):3-22. doi: 10.1016/j.intimp.2006.09.020. Epub 2006 Oct 23. Int Immunopharmacol. 2007. PMID: 17161812 Review.
-
Comparative study of the cellular pharmacodynamics of tacrolimus in renal transplant recipients treated with and without basiliximab.Cell Transplant. 2012;21(2-3):565-70. doi: 10.3727/096368911X605493. Cell Transplant. 2012. PMID: 22793066
-
Biomarkers of the immunomodulatory effect of immunosuppressive drugs in transplant recipients.Transplant Rev (Orlando). 2009 Apr;23(2):120-8. doi: 10.1016/j.trre.2009.01.006. Transplant Rev (Orlando). 2009. PMID: 19298943 Review.
Cited by
-
The IMBG Test for Evaluating the Pharmacodynamic Response to Immunosuppressive Therapy in Kidney Transplant Patients: Current Evidence and Future Applications.Int J Mol Sci. 2023 Mar 8;24(6):5201. doi: 10.3390/ijms24065201. Int J Mol Sci. 2023. PMID: 36982276 Free PMC article.
-
Immunoprotection of cellular transplants for autoimmune type 1 diabetes through local drug delivery.Adv Drug Deliv Rev. 2024 Mar;206:115179. doi: 10.1016/j.addr.2024.115179. Epub 2024 Jan 28. Adv Drug Deliv Rev. 2024. PMID: 38286164 Free PMC article. Review.
References
Publication types
MeSH terms
Substances
LinkOut - more resources
Full Text Sources
Other Literature Sources
Medical

