. 2021 Jan 25:11:562434.
doi: 10.3389/fgene.2020.562434. eCollection 2020.

Systematic Prioritization of Candidate Genes in Disease Loci Identifies TRAFD1 as a Master Regulator of IFNγ Signaling in Celiac Disease

Affiliations

Systematic Prioritization of Candidate Genes in Disease Loci Identifies TRAFD1 as a Master Regulator of IFNγ Signaling in Celiac Disease

Adriaan van der Graaf et al. Front Genet. .

Abstract

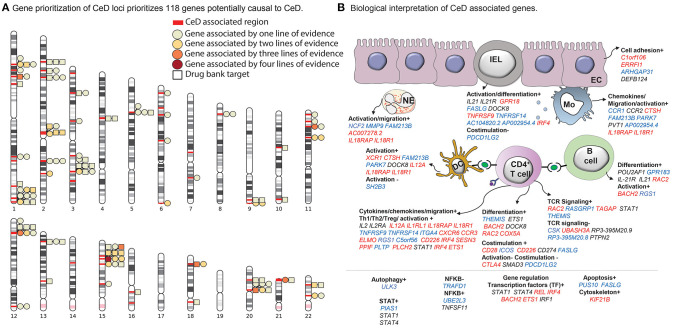
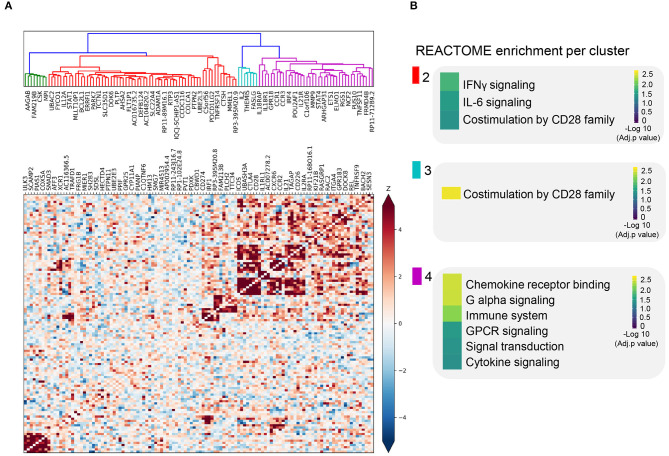
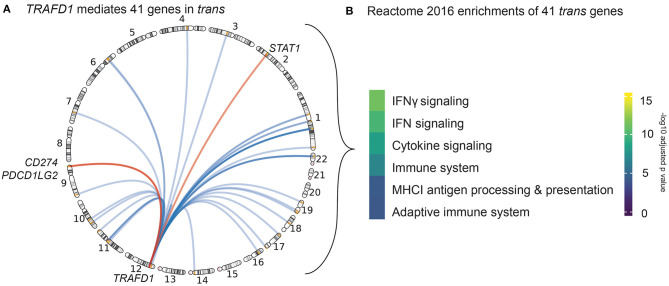
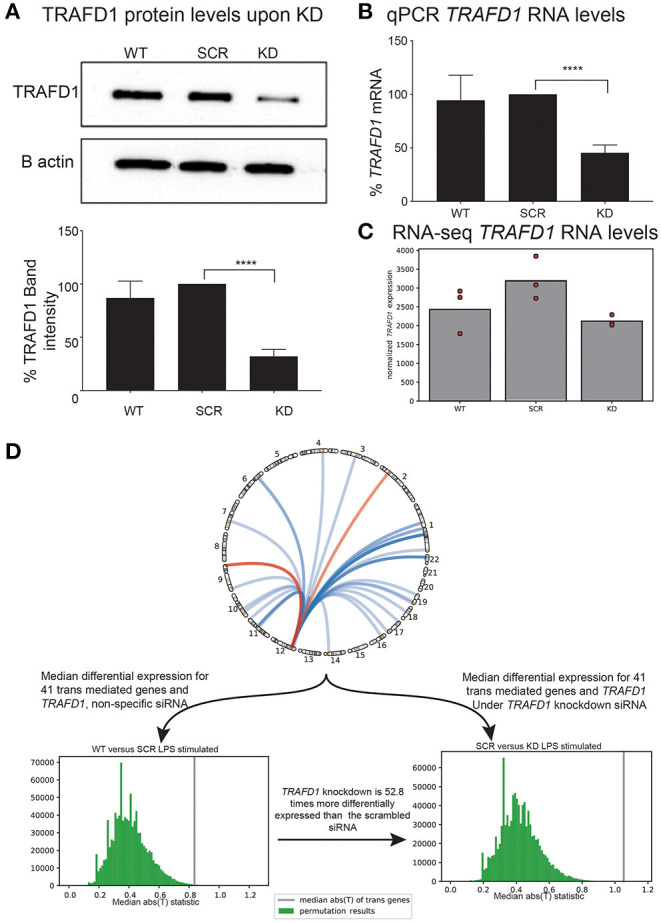
Celiac disease (CeD) is a complex T cell-mediated enteropathy induced by gluten. Although genome-wide association studies have identified numerous genomic regions associated with CeD, it is difficult to accurately pinpoint which genes in these loci are most likely to cause CeD. We used four different in silico approaches-Mendelian randomization inverse variance weighting, COLOC, LD overlap, and DEPICT-to integrate information gathered from a large transcriptomics dataset. This identified 118 prioritized genes across 50 CeD-associated regions. Co-expression and pathway analysis of these genes indicated an association with adaptive and innate cytokine signaling and T cell activation pathways. Fifty-one of these genes are targets of known drug compounds or likely druggable genes, suggesting that our methods can be used to pinpoint potential therapeutic targets. In addition, we detected 172 gene combinations that were affected by our CeD-prioritized genes in trans. Notably, 41 of these trans-mediated genes appear to be under control of one master regulator, TRAF-type zinc finger domain containing 1 (TRAFD1), and were found to be involved in interferon (IFN)γ signaling and MHC I antigen processing/presentation. Finally, we performed in vitro experiments in a human monocytic cell line that validated the role of TRAFD1 as an immune regulator acting in trans. Our strategy confirmed the role of adaptive immunity in CeD and revealed a genetic link between CeD and IFNγ signaling as well as with MHC I antigen processing, both major players of immune activation and CeD pathogenesis.

Keywords: TRAFD1; celiac disease; expression quantitative trait locus (eQTL); gene prioritization; trans regulation.


Conflict of interest statement

The authors declare that the research was conducted in the absence of any commercial or financial relationships that could be construed as a potential conflict of interest.

Figures

Figure 1
Figure 1
Celiac disease (CeD) prioritized genes and their proposed function and cell type. (A) A chromosome ideogram depicting the location of each prioritized gene identified in a CeD-associated genome-wide association study (GWAS) locus. Loci are marked with red bars. Genes depicted by a square are the target of an approved drug or a drug in development. All other genes are depicted by a circle. Each circle or square is colored according to the lines of evidence (see Methods) supporting its causal role. (B) Functions and cell types highlighted by the prioritized genes, according to our literature review (see Methods) (n = 118 genes; for 37 genes, neither a function nor a specific cell type on which the gene may operate could be specified). All genes contributing to a specific function are listed under the subheading and colored according to the change that leads to increased CeD risk: increased expression (red), decreased expression (blue), or undefined (black). The symbols + or – denote if a biological process is thought to be induced or repressed by the gene, respectively, according to literature.
Figure 2
Figure 2
Co-expression pattern of cis-eQTL prioritized genes. (A) Heatmap showing the Spearman correlations between gene expression patterns of each prioritized gene. Blue squares indicate a negative correlation. Red squares indicate a positive correlation. Both are shaded on a gradient scale according to the Z score of the correlation. A dendrogram computed with Ward distances between the correlations is shown on top of the heatmap. Branches of the dendrogram are colored differently to mark separate clusters. (B) Results of the REACTOME gene set enrichment analysis of the genes belonging to each of the clusters identified in (A). Color key denotes the significance (-log 10 multiple testing adjusted p-value) of each biological pathway.
Figure 3
Figure 3
Trans genes action and function. (A) Circle genomic plot depicting the location of the 41 genes trans-mediated by TRAFD1. The three genes also prioritized by our cis-eQTL analysis are named (red). (B) Results of the REACTOME gene set enrichment analysis of TRAFD1-mediated genes. Color code denotes the significance (-log 10 adjusted p-value) of each biological pathway.
Figure 4
Figure 4
In vitro knockdown of TRAFD1 validates trans-mediation network. THP-1 cell line based knockdown of TRAFD1 (KD) compared to non-specific siRNA (SCR) and untransfected cells (WT) (A) Western blot based protein levels of TRAFD1 compared to the B actin control. p ≤ 0.0001 (****). (B) qPCR RNA levels and (C) RNA-seq levels of TRAFD1 expression. (D) Comparative differential expression experiment of TRAFD1, comparing the 41 trans-mediated genes and TRAFD1 differential expression in the WT vs. SCR to the SRC vs. KD in the LPS stimulated condition. The WT vs. SCR is 52.8 times less differentially expressed as the SCR vs. KD, indicating that TRAFD1 KD affects these 41 genes in trans.

References

    1. Abadie V., Discepolo V., Jabri B. (2012). Intraepithelial lymphocytes in celiac disease immunopathology. Semin. Immunopathol. 34, 551–556. 10.1007/s00281-012-0316-x - DOI - PubMed
    1. Anders S., Huber W. (2010). Differential expression analysis for sequence count data. Genome Biol. 11:R106. 10.1186/gb-2010-11-10-r106 - DOI - PMC - PubMed
    1. Astle W. J., Elding H., Jiang T., Allen D., Ruklisa D., Mann A. L., et al. . (2016). The allelic landscape of human blood cell trait variation and links to common complex disease. Cell 167, 1415–1429.e19. 10.1016/j.cell.2016.10.042 - DOI - PMC - PubMed
    1. Auton A., Abecasis G. R., Altshuler D. M., Durbin R. M., Bentley D. R., Chakravarti A., et al. . (2015). A global reference for human genetic variation. Nature 526, 68–74. 10.1038/nature15393 - DOI - PMC - PubMed
    1. Baldassari L. E., Rose J. W. (2017). Daclizumab: development, clinical trials, and practical aspects of use in multiple sclerosis. Neurotherapeutics 14, 842–858. 10.1007/s13311-017-0553-8 - DOI - PMC - PubMed