

Early Warning Signals Based on Momentary Affect Dynamics can Expose Nearby Transitions in Depression: A Confirmatory Single-Subject Time-Series Study
- PMID: 33569148
- PMCID: PMC7842626
- DOI: 10.17505/jpor.2020.22042
Early Warning Signals Based on Momentary Affect Dynamics can Expose Nearby Transitions in Depression: A Confirmatory Single-Subject Time-Series Study
Abstract
Background: In complex systems early warning signals such as rising autocorrelation, variance and network connectivity are hypothesized to anticipate relevant shifts in a system. For direct evidence hereof in depression, designs are needed in which early warning signals and symptom transitions are prospectively assessed within an individual. Therefore, this study aimed to detect personalized early warning signals preceding the occurrence of a major symptom transition.
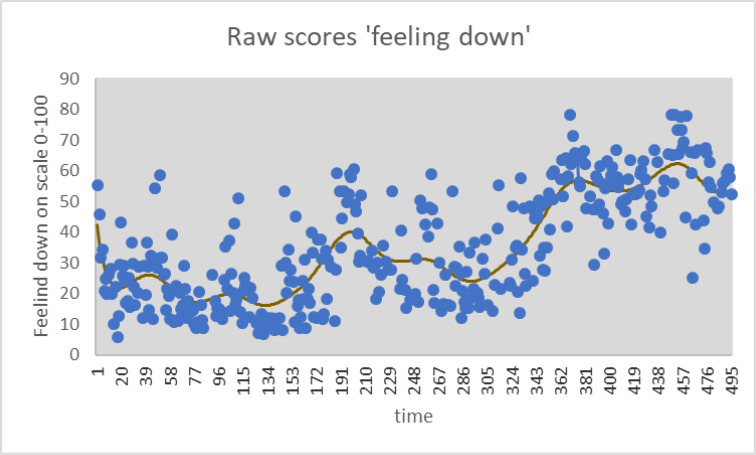
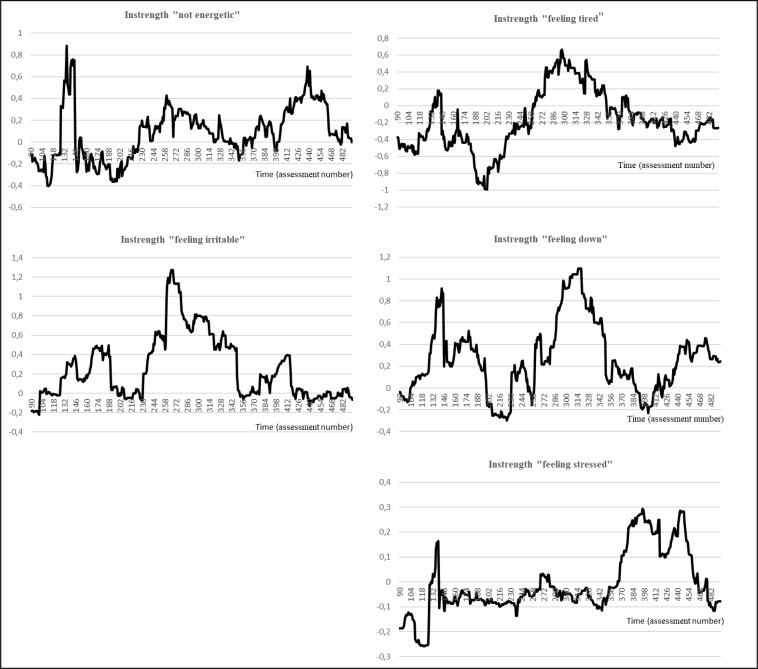
Methods: Six single-subject time-series studies were conducted, collecting frequent observations of momentary affective states during a time-period when participants were at increased risk of a symptom transition. Momentary affect states were reported three times a day over three to six months (95-183 days). Depressive symptoms were measured weekly using the Symptom CheckList-90. Presence of sudden symptom transitions was assessed using change point analysis. Early warning signals were analysed using moving window techniques.
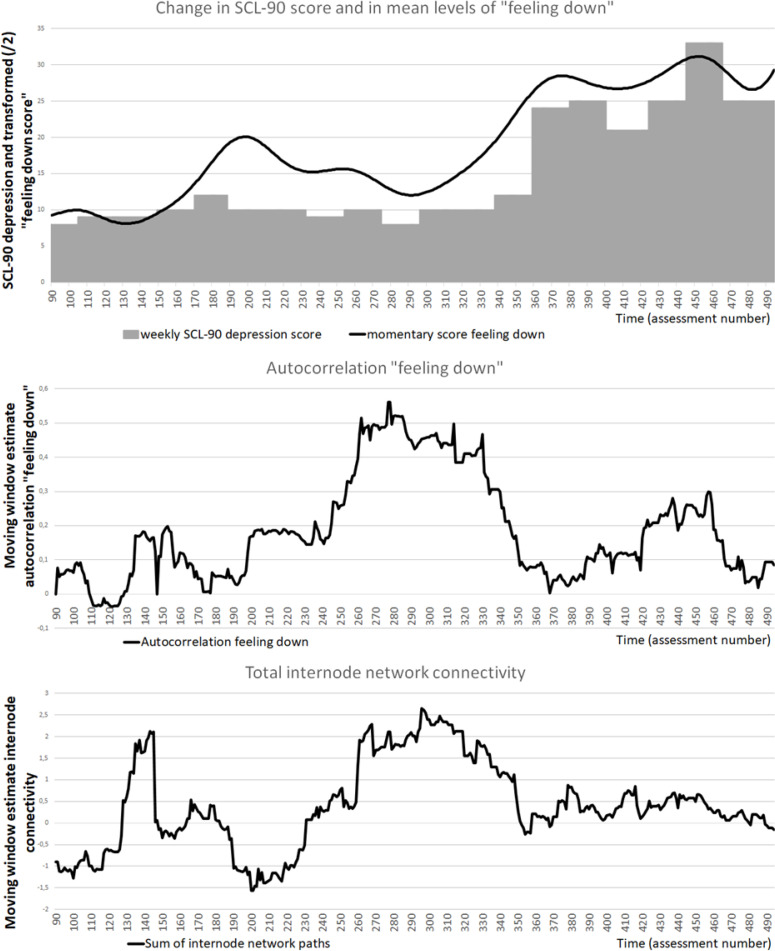
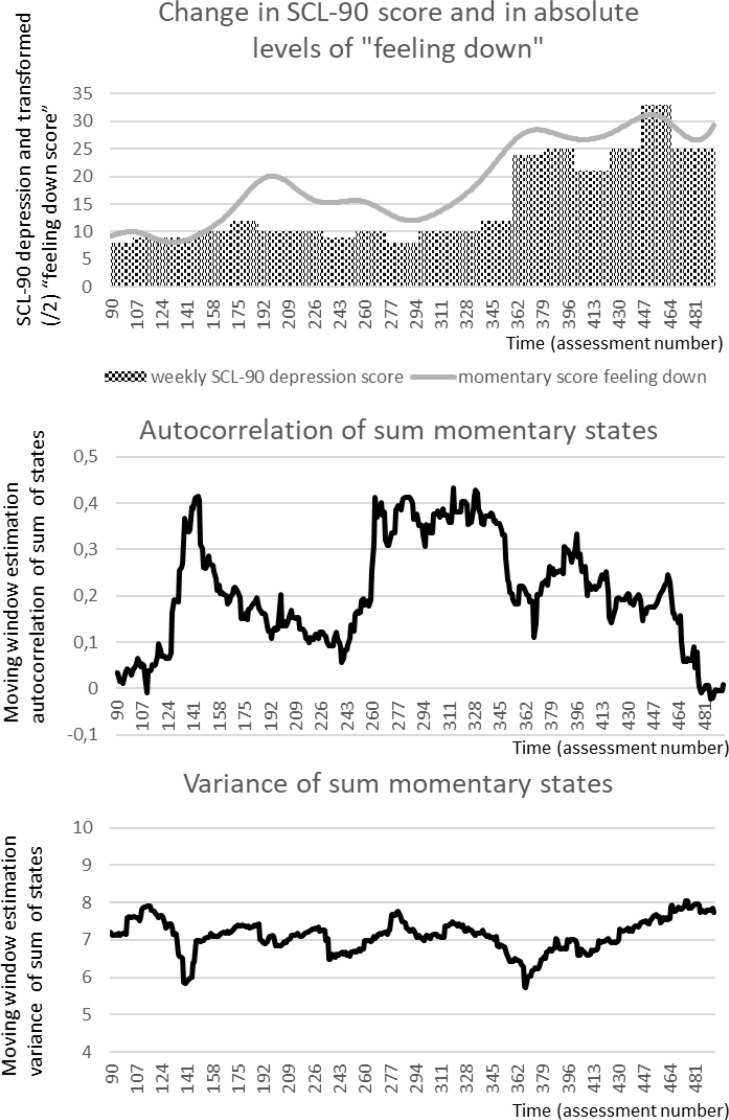
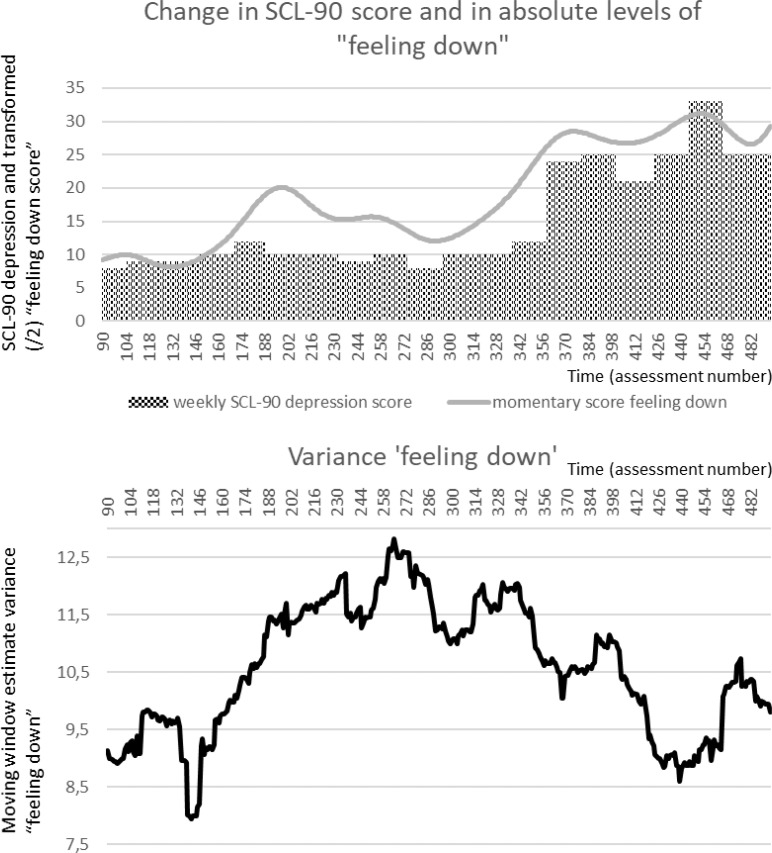
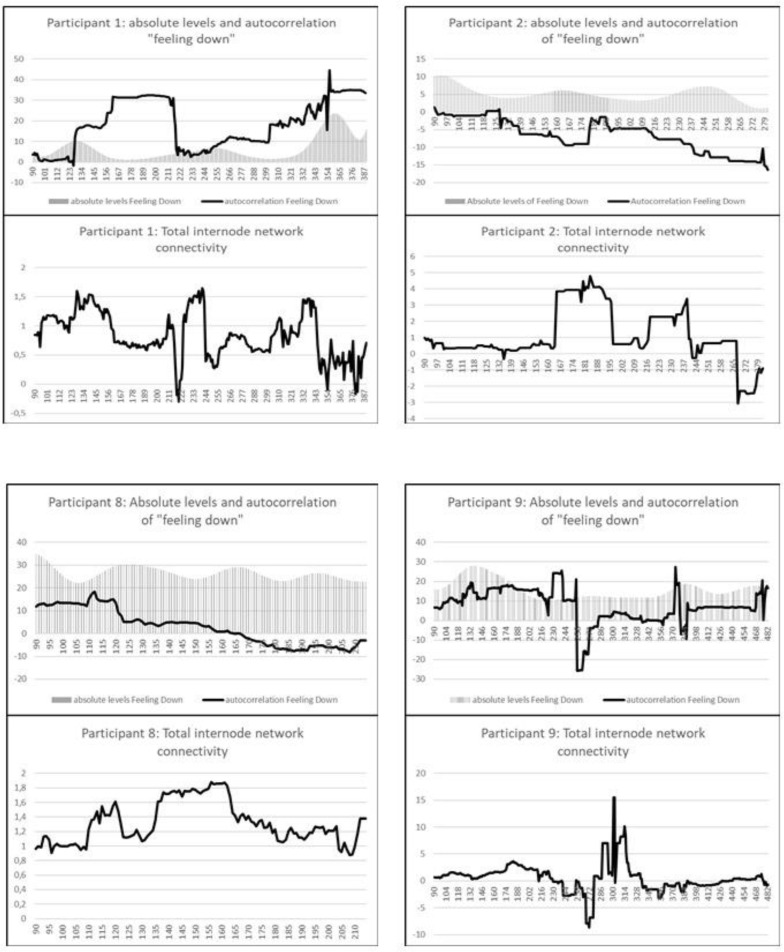
Results: As change point analysis revealed a significant and sudden symptom transition in one participant in the studied period, early warning signals were examined in this person. Autocorrelation (r=0·51; p<2.2e-16), and variance (r=0·53; p<2.2e-16) in 'feeling down', and network connectivity (r=0·42; p<2.2e-16) significantly increased a month before this transition occurred. These early warnings also preceded the rise in absolute levels of 'feeling down' and the participant's personal indication of risk for transition.
Conclusions: This study replicated the findings of a previous study and confirmed the presence of rising early warning signals a month before the symptom transition occurred. Results show the potential of early warning signals to improve personalized risk assessment in the field of psychiatry.
Keywords: complex systems; depression; early warning signals; experience sampling methodology; momentary mental states; networks; time-series analyses.
© Person-Oriented Research.
Conflict of interest statement
The authors declare that there is no conflict of interest.
Figures
Similar articles
-
Anticipating manic and depressive transitions in patients with bipolar disorder using early warning signals.Int J Bipolar Disord. 2022 Apr 9;10(1):12. doi: 10.1186/s40345-022-00258-4. Int J Bipolar Disord. 2022. PMID: 35397076 Free PMC article.
-
Early warning signals in psychopathology: what do they tell?BMC Med. 2020 Oct 14;18(1):269. doi: 10.1186/s12916-020-01742-3. BMC Med. 2020. PMID: 33050891 Free PMC article.
-
Early warning signals and critical transitions in psychopathology: challenges and recommendations.Curr Opin Psychol. 2021 Oct;41:51-58. doi: 10.1016/j.copsyc.2021.02.008. Epub 2021 Feb 23. Curr Opin Psychol. 2021. PMID: 33774486 Review.
-
Early warnings for multi-stage transitions in dynamics on networks.J R Soc Interface. 2023 Mar;20(200):20220743. doi: 10.1098/rsif.2022.0743. Epub 2023 Mar 15. J R Soc Interface. 2023. PMID: 36919417 Free PMC article.
-
Spatial early warning signals for impending regime shifts: A practical framework for application in real-world landscapes.Glob Chang Biol. 2019 Jun;25(6):1905-1921. doi: 10.1111/gcb.14591. Epub 2019 Apr 1. Glob Chang Biol. 2019. PMID: 30761695 Free PMC article. Review.
Cited by
-
An Initial Study of Practicing Psychologists' Views of the Utility of Ecological Momentary Assessment for Difficult Psychotherapy Cases.Adm Policy Ment Health. 2021 Jul;48(4):597-607. doi: 10.1007/s10488-020-01093-4. Epub 2020 Oct 12. Adm Policy Ment Health. 2021. PMID: 33047277
-
Detecting Prolonged Stress in Real Life Using Wearable Biosensors and Ecological Momentary Assessments: Naturalistic Experimental Study.J Med Internet Res. 2023 Oct 19;25:e39995. doi: 10.2196/39995. J Med Internet Res. 2023. PMID: 37856180 Free PMC article.
-
Congruency of multimodal data-driven personalization with shared decision-making for StayFine: individualized app-based relapse prevention for anxiety and depression in young people.Front Psychiatry. 2023 Sep 29;14:1229713. doi: 10.3389/fpsyt.2023.1229713. eCollection 2023. Front Psychiatry. 2023. PMID: 37840790 Free PMC article.
-
Elevated emotion network connectivity is associated with fluctuations in depression.Proc Natl Acad Sci U S A. 2023 Nov 7;120(45):e2216499120. doi: 10.1073/pnas.2216499120. Epub 2023 Oct 30. Proc Natl Acad Sci U S A. 2023. PMID: 37903279 Free PMC article.
-
Pattern breaking: a complex systems approach to psychedelic medicine.Neurosci Conscious. 2023 Jul 6;2023(1):niad017. doi: 10.1093/nc/niad017. eCollection 2023. Neurosci Conscious. 2023. PMID: 37424966 Free PMC article.
References
-
- Csikszentmihalyi M., & Larson R. (2014). Validity and Reliability of the Experience-Sampling Method. In Flow and the Foundations of Positive Psychology (pp. 35-54): Springer; Netherlands.
LinkOut - more resources
Full Text Sources
Research Materials