

Predicting blood-to-plasma concentration ratios of drugs from chemical structures and volumes of distribution in humans
- PMID: 33569705
- PMCID: PMC8342319
- DOI: 10.1007/s11030-021-10186-7
Predicting blood-to-plasma concentration ratios of drugs from chemical structures and volumes of distribution in humans
Abstract
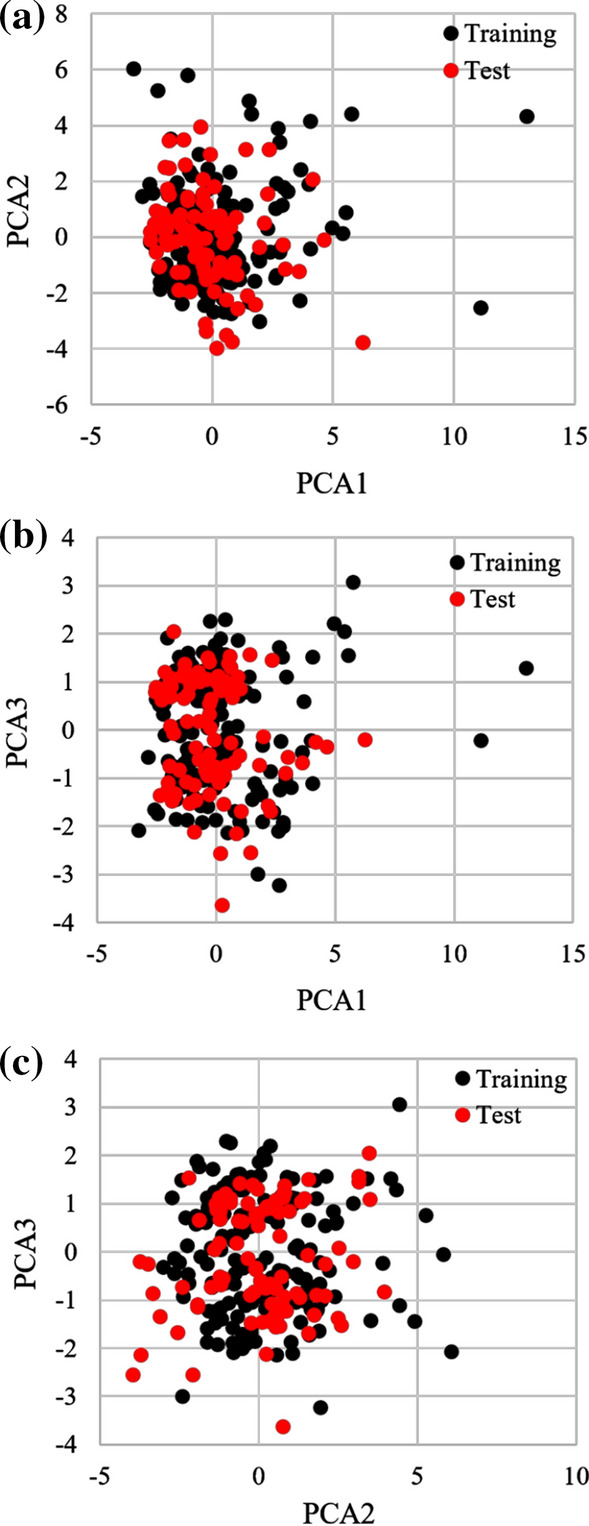
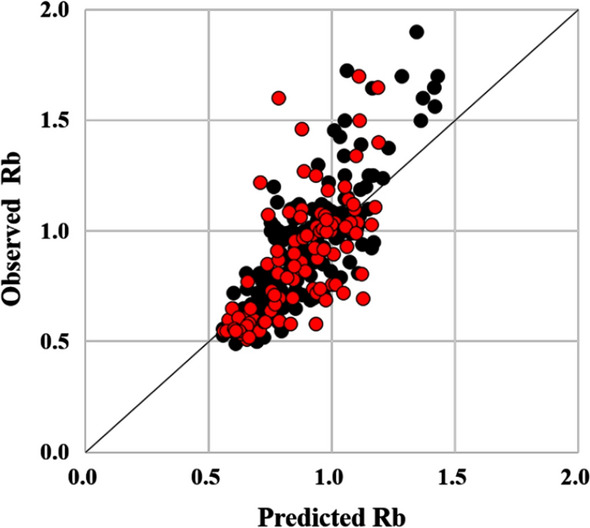
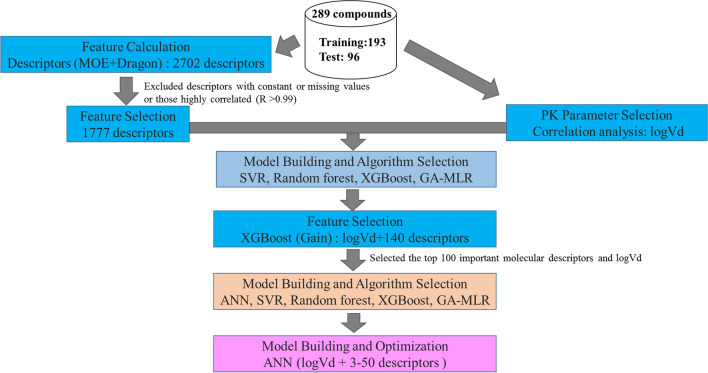
Despite their importance in determining the dosing regimen of drugs in the clinic, only a few studies have investigated methods for predicting blood-to-plasma concentration ratios (Rb). This study established an Rb prediction model incorporating typical human pharmacokinetics (PK) parameters. Experimental Rb values were compiled for 289 compounds, offering reliable predictions by expanding the applicability domain. Notably, it is the largest list of Rb values reported so far. Subsequently, human PK parameters calculated from plasma drug concentrations, including the volume of distribution (Vd), clearance, mean residence time, and plasma protein binding rate, as well as 2702 kinds of molecular descriptors, were used to construct quantitative structure-PK relationship models for Rb. Among the evaluated PK parameters, logVd correlated best with Rb (correlation coefficient of 0.47). Thus, in addition to molecular descriptors selected by XGBoost, logVd was employed to construct the prediction models. Among the analyzed algorithms, artificial neural networks gave the best results. Following optimization using six molecular descriptors and logVd, the model exhibited a correlation coefficient of 0.64 and a root-mean-square error of 0.205, which were superior to those previously reported for other Rb prediction methods. Since Vd values and chemical structures are known for most medications, the Rb prediction model described herein is expected to be valuable in clinical settings.
Keywords: Artificial neural networks; Blood-to-plasma ratio; Pharmacokinetics; Quantitative structure–pharmacokinetic relationships; Volume of distribution.
© 2021. The Author(s).
Figures
References
-
- (2008) European Medicines Agency Evaluation of Medicines for Human Use CHMP ASSESSMENT REPORT FOR Doribax. In: Eur. Med. Agency. https://www.ema.europa.eu/en/documents/assessment-report/doribax-epar-pu...
-
- Uesawa Y, Kagaya H. Volume of distribution in opioids estimated by electric charge under biological pH conditions. Jpn J Pharm Palliat Care Sci. 2014;7:55–61.
MeSH terms
Substances
LinkOut - more resources
Full Text Sources
Other Literature Sources
Medical
