. 2021 Jun;69(6):1515-1539.
doi: 10.1002/glia.23976. Epub 2021 Feb 10.

Midkine is neuroprotective and influences glial reactivity and the formation of Müller glia-derived progenitor cells in chick and mouse retinas

Affiliations

Midkine is neuroprotective and influences glial reactivity and the formation of Müller glia-derived progenitor cells in chick and mouse retinas

Warren A Campbell et al. Glia. 2021 Jun.

Abstract

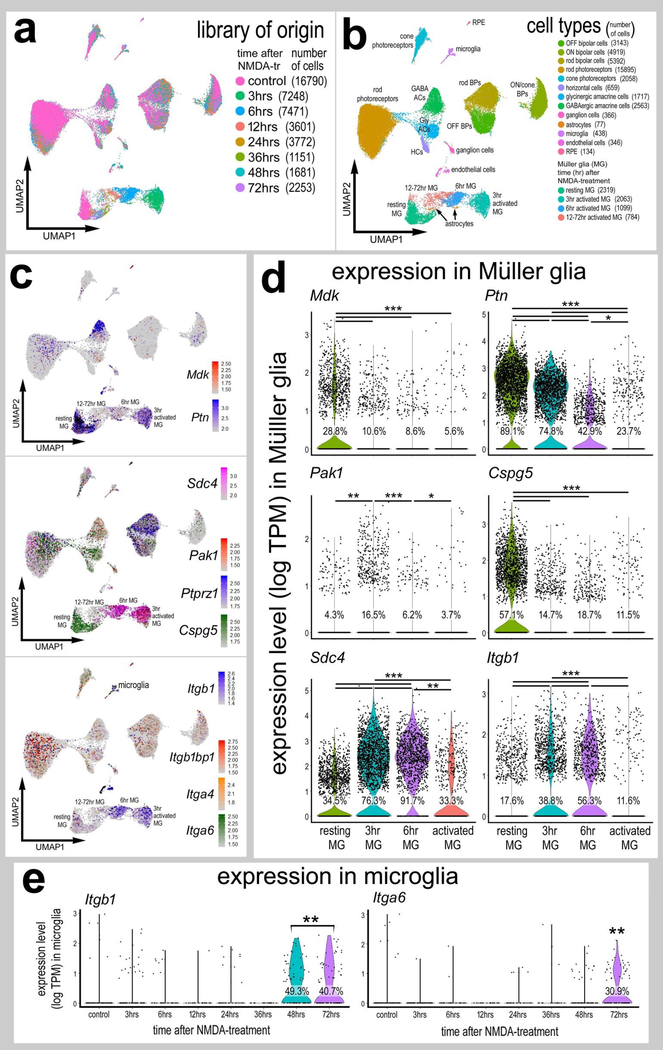
Recent studies suggest midkine (MDK) is involved in the development and regeneration of the zebrafish retina. We investigate the expression patterns of MDK and related factors, roles in neuronal survival, and influence upon the formation of Müller glia-derived progenitor cells (MGPCs) in chick and mouse model systems. By using single-cell RNA-sequencing, we find that MDK and pleiotrophin (PTN), a MDK-related cytokine, are upregulated by Müller glia (MG) during later stages of development in chick. While PTN is downregulated, MDK is dramatically upregulated in mature MG after retinal damage or FGF2 and insulin treatment. By comparison, MDK and PTN are downregulated by MG in damaged mouse retinas. In both chick and mouse retinas, exogenous MDK induces expression of cFos and pS6 in MG. In the chick, MDK significantly decreases numbers dying neurons, reactive microglia, and proliferating MGPCs, whereas PTN has no effect. Inhibition of MDK-signaling with Na3 VO4 blocks neuroprotective effects with an increase in the number of dying cells and negates the pro-proliferative effects on MGPCs in damaged retinas. Inhibitors of PP2A and Pak1, which are associated with MDK-signaling through integrin β1, suppressed the formation of MGPCs in damaged chick retinas. In mice, MDK promotes a small but significant increase in proliferating MGPCs in damaged retinas and potently decreases the number of dying cells. We conclude that MDK expression is dynamically regulated in Müller glia during embryonic maturation, following retinal injury, and during reprogramming into MGPCs. MDK mediates glial activity, neuronal survival, and the re-programming of Müller glia into proliferating MGPCs.

Keywords: Müller glia; Müller glia derived progenitor cells; Müller glia reprogramming; midkine; retinal neuroprotection; scRNA-seq.


Conflict of interest statement

Competing Interests: The authors have no competing interests to declare.

Figures

Figure 1.
Figure 1.
Maturing MG upregulate MDK, PTN, and CSPG5 in embryonic chick retina. scRNA-seq was used to identify patterns of expression of MDK, PTN and putative receptor CSPG5 among embryonic retinal cells at four stages of development (E5, E8, E12, E15). UMAP-ordered clusters of cells were identified by expression of hallmark genes (a,b). A heatmap of MDK, PTN and CSPG5 illustrates expression profiles in different developing retinal cells (c). Each dot represents one cell and black dots indicate cells with 2 or more genes expressed. The upregulation of MDK and PTN in RPCs and maturing MG is illustrated with violin plot (d). The number on each violin indicates the percentage of expressing cells. The transition from RPC to mature MG is modelled with pseudotime ordering of cells with early RPCs to the far left and maturing MG to the right of the pseudotime trajectory (e). MDK and PTN are up-regulated in MG during maturation as illustrated by the pseudotime heatmap (f) and pseudotime plot (g). Significant difference (*p<0.01, **p<0.0001, ***p<<0.0001) was determined by using a Wilcox rank sum with Bonferoni correction. RPC – retinal progenitor cell, MG – Müller glia, iMG – immature Müller glia, mMG - mature Müller glia.
Figure 2.
Figure 2.
Chick MG robustly upregulate MDK and putative receptors following acute injury. scRNA-seq was used to identify patterns of expression of MDK-related genes among acutely dissociated retinal cells with the data presented in UMAP plots (a–d, f, g, h) and violin plots (e,i). Control and treated scRNA-seq libraries were aggregated from 24hr, 48hr, and 72hr after NMDA-treatment (a). UMAP-ordered cells formed distinct clusters with MG and MGPCs forming distinct clusters (b). Expression heatmaps of MDK, PTN, and receptor genes PTPRZ1, CSPG5, and SDC4 demonstrate patterns of expression in the retina, with black dots representing cells with 2 or more genes (c,d). In addition to NMDA, retinas were treated with insulin and FGF2 and expression levels of MDK, PTN, and CSPG5 were assessed in MG and MGPCs (f–i). UMAP and violin plots illustrate relative levels of expression in MG and MGPCs treated with NMDA alone or NMDA plus insulin and FGF2 (h,i). Violin plots illustrate levels of gene expression and significant changes (*p<0.1, **p<0.0001, ***p<<0.0001) in levels were determined by using a Wilcox rank sum with Bonferroni correction. The number on each violin indicates the percentage of expressing cells. scRNA-seq was validated using fluorescent in-situ hybridization for MDK (green) and PTN (red) before and 24hrs after NMDA-treatment (j). MDK transcripts upregulated after NMDA-treatment colocalized with immunoreactivity for glutamine synthetase (k).
Figure 3.
Figure 3.
MDK activates cFOS and pS6 mediated cell-signaling in chick MG. A single intraocular injection of MDK was delivered and retinas were harvested 4 hours later. The histogram in a represents the mean percent change (±SD) in intensity sum for cFOS and pS6 immunofluorescence. Each dot represents one biological replicate retina. Significance of difference (**p<0.01, ***p<0.001) was determined by using a paired t-test. Sections of saline (control) and MDK-treated retinas were labeled with antibodies to cFOS (green; b,c), pS6 (green; d,e) and Sox2 (magenta; c,e). Arrows indicate the nuclei of MG, small double-arrows indicate the nuclei of amacrine cells, and hollow arrow-heads indicate the nuclei of presumptive NIRG cells. An identical paradigm with the addition of ITGB1 signaling inhibitors fostriecin & calyculin measured changes in pS6 signaling in MG (f) and was quantified for intensity changes (g). The calibration bar (50 μm) in panel d applies to b and d. Abbreviations: ONL – outer nuclear layer, INL – inner nuclear layer, IPL – inner plexiform layer, GCL – ganglion cell layer.
Figure 4.
Figure 4.
MDK treatment prior to NMDA reduces numbers of proliferating MGPCs, suppresses the accumulation of NIRG cells, and increases neuronal survival. Eyes were injected with MDK or saline at P6 and P7, and NMDA at P8. Some retinas were harvested at P9, whereas other eyes were injected at P10 with EdU and retinas harvested 4hrs later, 24hrs later at P11 or 10 days later at P20. Sections of the retina were labeled for EdU (red) and Sox9 (green; a), phospho-Histone H3 (pHisH3; magenta) and Sox2 (green; c), Nkx2.2 (e), CD45 (g), TUNEL (i), and AP2α (red) and Otx2 (green) or calretinin (red; k). Arrows indicate nuclei of proliferating MGPCs and hollow arrow-heads indicate TUNEL-positive cells. The histogram/scatter-plots b, d, f, j and l illustrate the mean number of labeled cells (±SD). The histogram in h represents the mean percent change (±SD) in density sum and area for CD45 immunofluorescence. Each dot represents one biological replicate. Significance of difference (*p<0.01) was determined by using a paired t-test. The calibration bars panels a, c, e, g, i and k represent 50 μm. Abbreviations: ONL – outer nuclear layer, INL – inner nuclear layer, IPL – inner plexiform layer, GCL – ganglion cell layer.
Figure 5.
Figure 5.
Sodium orthovanadate in NMDA-damaged retinas suppressed the formation of MGPCs, increases numbers of dying cells, and stimulates the accumulation of NIRG cells. Eyes were injected with NMDA and Na3VO4 tyrosine phosphatase inhibitor or vehicle at P8, inhibitor or vehicle at P9, EdU at P10, and retinas harvested at P11. Sections of the retina were labeled for EdU (red) and Sox9 (green; a, g), Nkx2.2 and Sox9 (green; c), or TUNEL (e). Arrows indicate nuclei of proliferating MGPCs (a,g) and hollow arrow-heads indicate NIRG cells (c). The histogram/scatter-plots in b, d, f, h and i illustrate the mean (±SD) number of labeled cells. Each dot represents one biological replicate. Significance of difference (*p<0.05) was determined by using a paired t-test. The calibration bars panels a, c, e and g represent 50 μm. Abbreviations: ONL – outer nuclear layer, INL – inner nuclear layer, IPL – inner plexiform layer, GCL – ganglion cell layer.
Figure 6.
Figure 6.
ITGB1 signaling inhibitors reduce the formation of chick MGPCs after NMDA damage. scRNA-seq libraries (Fig. 2) were probed for patterns of expression of integrin alpha/beta isoforms and associated signaling ITGB1 molecules p21 associated kinase-1 (PAK1), protein phosphatase 2a catalytic subunit alpha (PPP2CA), integrin linked kinase (ILK), and ARF GTPase-activating protein (GIT1). tSNE plots demonstrate patterns of expression of PAK1, ITGB1, ITGA1, ITGA2, ITGA3, ITGA6, ITGAV, CAT, CDC42, GIT1, ILK and PPP2CA (a). Violin/scatter plots indicate significant differences (*p<0.01, **p<0.001, ***p<<0.001; Wilcox rank sum with Bonferoni correction) in expression of PAK1, ITGB1, ITGA1, ITGA2, ITGA3, ITGA6, ITGAV, CAT, CDC42, GIT1, ILK and PPP2CA among MG and MGPCs (b). The number on each violin indicates the percentage of expressing cells. PAK1-specific inhibitor IPA3 was injected with and following NMDA (c,d) or before NMDA (e) and analyzed for proliferation of MGPCs. Alternatively, PP2A-specific inhibitors calyculin A or fostriecin were injected with and following NMDA (f–h). Sections of the retina were labeled for EdU (red) and Sox9 (green; c, f). Arrows indicate nuclei of proliferating MGPCs (a,g). The histogram/scatter-plots in d, e, g and h illustrate the mean (±SD) number of labeled cells. Each dot represents one biological replicate. Significance of difference (*p<0.05) was determined by using a paired t-test. Arrows indicate nuclei of proliferating MGPCs (c,f). The calibration bar panels c and f represent 50 μm. Abbreviations: ONL – outer nuclear layer, INL – inner nuclear layer, IPL – inner plexiform layer, GCL – ganglion cell layer, ns – not significant.
Figure 7.
Figure 7.
Insulin and FGF2 induce MDK and putative MDK-receptors in chick retinas. scRNA-seq was used to identify patterns of expression of MDK-related genes among cells in saline-treated retinas and in retinas after 2 and 3 consecutive doses of FGF2 and insulin (a,b). In UMAP plots, each dot represents one cell, and expressing cells indicated by colored heatmaps of gene expression for MDK, PTN, PAK1, CSPG5 and ITGB1 (c,d). Black dots indicate cells with expression of two or more genes. (e) Changes in gene expression among UMAP clusters of MG and MGPCs are illustrated with violin plots and significance of difference (*p<0.1, **p<0.0001, ***p<<0.0001) determined using a Wilcox rank sum with Bonferoni correction. The number on each violin indicates the percentage of expressing cells.
Figure 8.
Figure 8.
Various reprogramming treatments induce MDK, ITGB1, CDC4, while repressing PTN, PAK1, and CSPG5 in chick MGPCs. In UMAP and violin plots each dot represents one cell. MG were bioinformatically isolated from 2 biological replicates for control retinas and retinas treated with 2 doses of insulin and FGF2, 3 doses of insulin and FGF2, 24 hrs after NMDA, 48 hrs after NMDA, 48hrs after NMDA + insulin and FGF2, and 72 hrs after NMDA. UMAP analysis revealed distinct clusters of MG which includes control/resting MG, activated MG from retinas 24hrs after NMDA treatment, activated MG from 2 doses of insulin and FGF2, activated MG from 3 doses of insulin FGF2 and NMDA at different times after treatment, activated MG returning toward a resting phenotype from 48 and 72 hrs after NMDA-treatment, and 3 regions of MGPCs. The dot plot in c illustrates some of the pattern-distinguishing genes and relative levels across the different UMAP-clustered MG and MGPCs. UMAP plots illustrate the distinct and elevated expression of GLUL, RLBP, VIM and SLC1A3 in resting MG (d) and CDK1, TOP2A, PCNA and SPC25 in different regions of MGPCs (e). Violin plots in f illustrate relative expression levels for MDK, PTN, SDC4, PAK1, CSPG5, ITGB1, PPP2CA and CDC4 in UMAP-clustered MG and MGPCs. Significance of difference (**p<0.001, ***p<<0.001) was determined by using a Wilcox rank sum with Bonferoni correction. The number on each violin indicates the percentage of expressing cells.
Figure 9.
Figure 9.
Mouse MG dynamically express Mdk, Ptn and MDK-related genes in response to NMDA damage. Cells were obtained from control retinas and from retinas at 3, 6, 12, 24, 36, 48 and 72hrs after NMDA-treatment and clustered in UMAP plots with each dot representing an individual cell (a). UMAP plots revealed distinct clustering of different types of retinal cells; resting MG (a mix of control, 48hr and 72hr NMDA-tr), 12–72 hr NMDA-tr MG (activated MG in violin plots), 6hrs NMDA-tr MG, 3hrs NMDA-tr MG, microglia, astrocytes, RPE cells, endothelial cells, retinal ganglion cells, horizontal cells (HCs), amacrine cells (ACs), bipolar cells (BPs), rod photoreceptors, and cone photoreceptors (b). Cells were colored with a heatmap of expression of Mdk, Ptn, Sdc4, Pak1, Ptprz1, Cspg5, Itgb1bp1, Itga4 and Itgba6 gene expression (c). Black dots indicate cells with two or more markers. In MG, changes in gene expression are illustrated with violin/scatter plots of Mdk, Ptn, Pak1, Cspg5, Sdc4, and Itgb1 and quantified for significant changes (d) (*p<0.01, **p<0.0001, ***p<<0.001). Similarly, UMAP-clustered microglia were analyzed and genes Itgb1 and Itga6 were detected and quantified in violin plots for cells from each library of origin (e). The number on each violin indicates the percentage of expressing cells.
Figure 10.
Figure 10.
MDK activates cFOS and pS6 cell-signaling in MG, stimulates proliferation of MGPCs, and promote neuroprotection in the mouse retina. (a–e) A single intraocular injection of MDK was delivered and retinas were harvested 4 hours later. The histogram in a represents the mean percent change (±SD) in density sum and area for percentage change in intensity sum for cFOS and pS6 immunofluorescence. Vertical sections of saline (control) and MDK-treated retinas were labeled with antibodies to cFOS (green; b,c), pS6 (green; d,e) and Sox2 (magenta; c,e). (f–h) Treatment included intraocular injections of MDK or vehicle at P60, NMDA and MDK/vehicle at P62, MDK or vehicle at P60, EdU was applied daily by intraperitoneal (IP) injections from P62 through P66, and tissues were harvested at P67. The histogram in h represents the mean (±SD) number of EdU+/Sox9+ cells in the INL. (i–j) Treatment included intraocular injections of MDK or vehicle at P60 and P61, NMDA at P62, and tissues were harvested at P63. Sections of the retina were labeled for fragmented DNA using the TUNEL method (i). The histogram in j represents the mean (±SD) number of TUNEL+ cells in the retinal total, only in the GCL, or only in the INL (j). Each dot represents one replicate retina (a,h,j). Significance of difference (*p<0.05, **p<0.001, ***p<0.0001) was determined by using a paired two-way t-test. Arrows indicate the nuclei of MG, arrow-heads indicate EdU+/Sox9 cells (presumptive proliferating microglia), hollow arrow-heads indicate pS6+ inner retinal neurons, and small double-arrows indicate the nuclei of Sox2+ cholinergic amacrine cells. The calibration bar (50 μm) in panel d applies to b and d. Abbreviations: ONL – outer nuclear layer, INL – inner nuclear layer, IPL – inner plexiform layer, GCL – ganglion cell layer.
Figure 11.
Figure 11.
Schematic summary of MDK-signaling in normal and NMDA-damaged retinas. Patterns of expression, determined by scRNA-seq, are shown for Integrin β1, Integrin α, PTPRZ1, PAK1 and MDK in MG, NIRG cells and inner retinal neurons. Although GIT1, ILK, CDC42, and PP2A (PPP2CA) were widely expressed by nearly all retinal cells (according to scRNA-seq data; see Fig 6a), signaling through Integrins is shown only in MG because ITG’s were largely confined to MG. Putative sites of action are shown for small-molecule inhibitors, including IPA3, calyculin A, fostriecin and Na3VO4. Abbreviations: PRL – photoreceptor layer, ONL – outer nuclear layer, INL – inner nuclear layer, IPL – inner plexiform layer, GCL – ganglion cell layer, NFL – nerve fiber layer.

References

    1. Ang NB, Saera-Vila A, Walsh C, Hitchcock PF, Kahana A, Thummel R and Nagashima M (2020). Midkine-a functions as a universal regulator of proliferation during epimorphic regeneration in adult zebrafish. PLOS ONE 15, e0232308. - PMC - PubMed
    1. Bagrodia S and Cerione RA (1999). PAK to the future. Trends Cell Biol. 9, 350–355. - PubMed
    1. Bernardos RL, Barthel LK, Meyers JR and Raymond PA (2007). Late-stage neuronal progenitors in the retina are radial Muller glia that function as retinal stem cells. J Neurosci 27, 7028–40. - PMC - PubMed
    1. Butler A, Hoffman P, Smibert P, Papalexi E and Satija R (2018). Integrating single-cell transcriptomic data across different conditions, technologies, and species. Nat. Biotechnol 36, 411–420. - PMC - PubMed
    1. Calinescu A-A, Vihtelic TS, Hyde DR and Hitchcock PF (2009). The Cellular Expression of Midkine-a and Midkine-b During Retinal Development and Photoreceptor Regeneration in Zebrafish. J. Comp. Neurol 514, 1–10. - PMC - PubMed

Publication types