. 2021 Jan 12;5(1):26-38.
doi: 10.1182/bloodadvances.2020003458.

Polarized mitochondria as guardians of NK cell fitness

Affiliations

Polarized mitochondria as guardians of NK cell fitness

Laura Surace et al. Blood Adv. .

Abstract

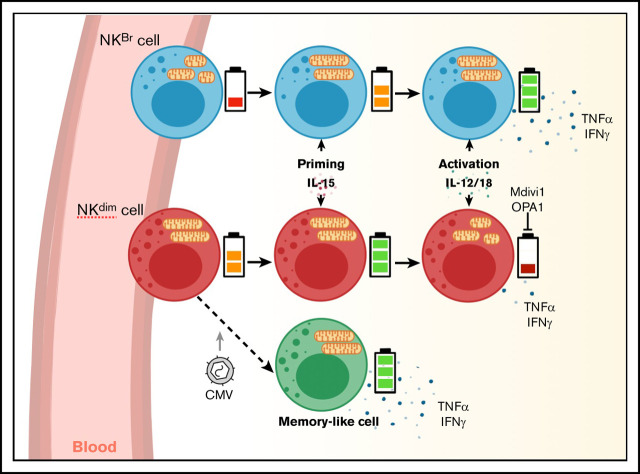
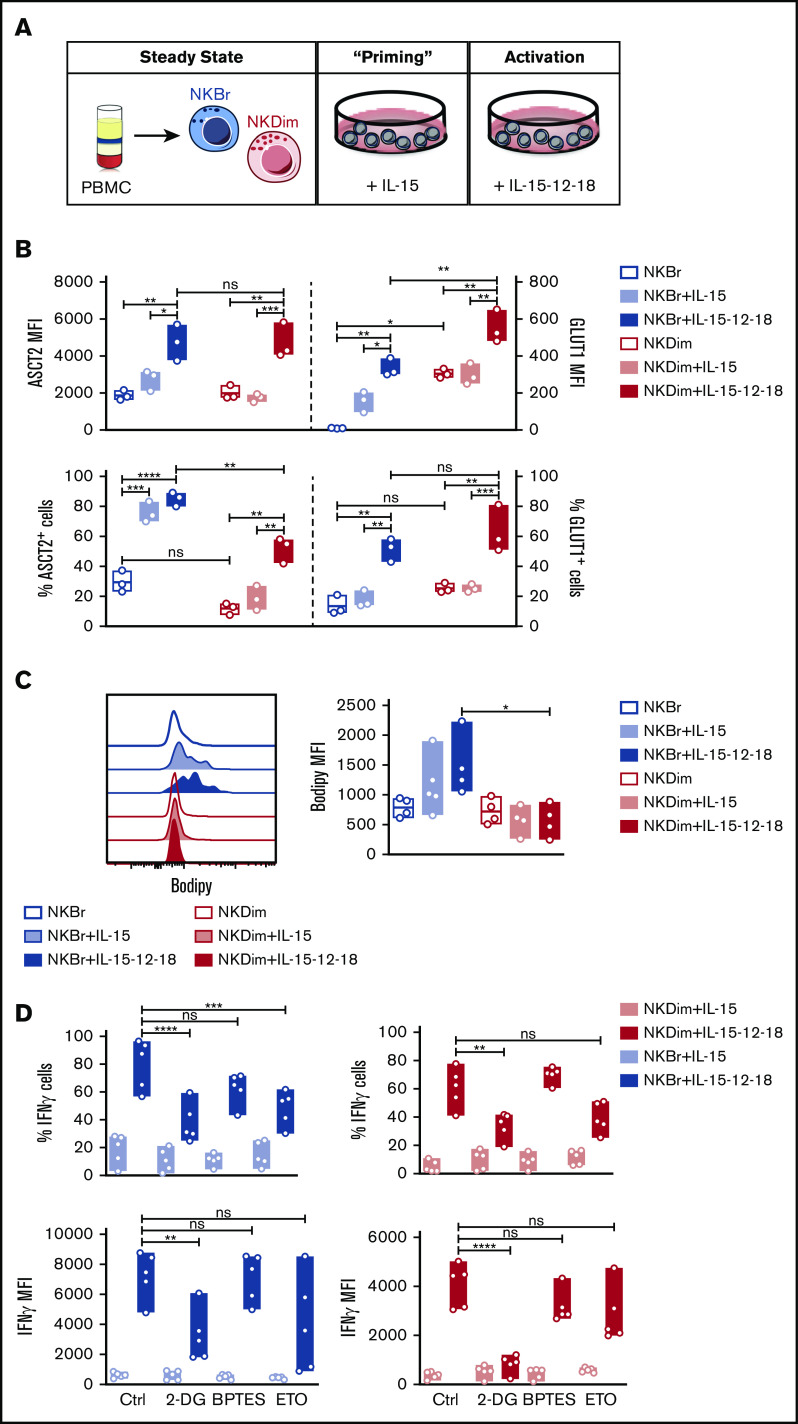
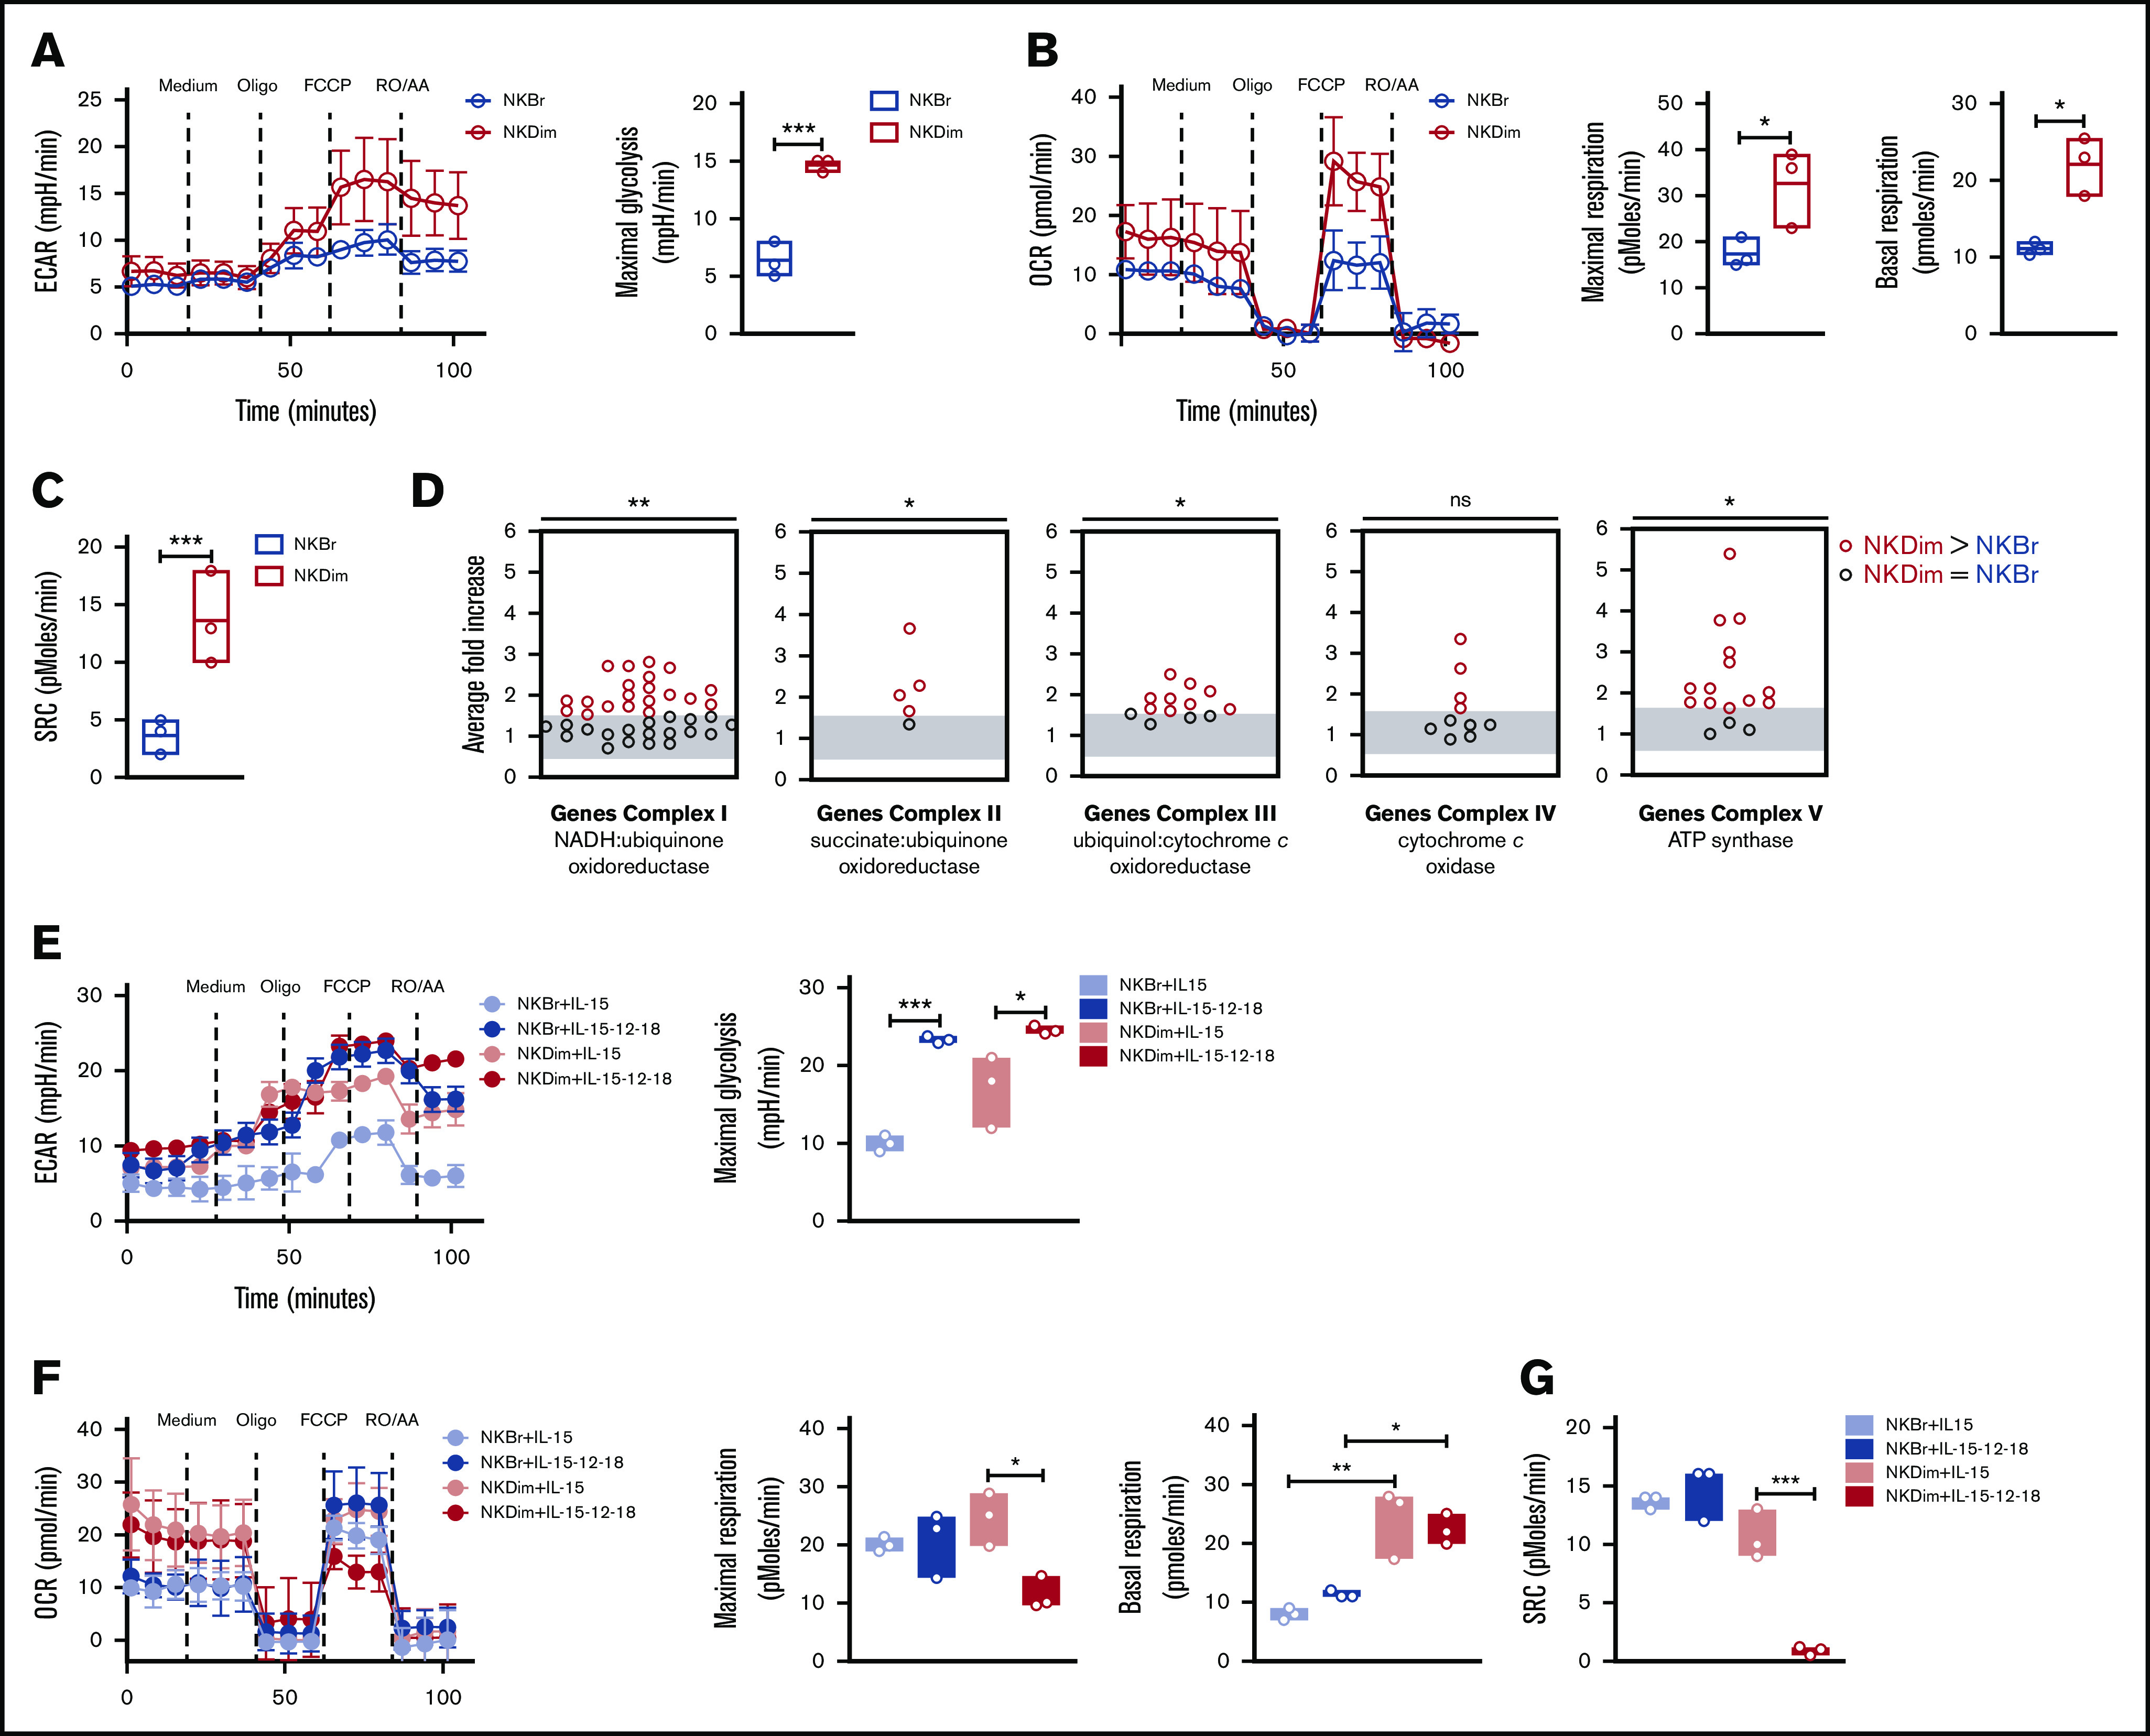
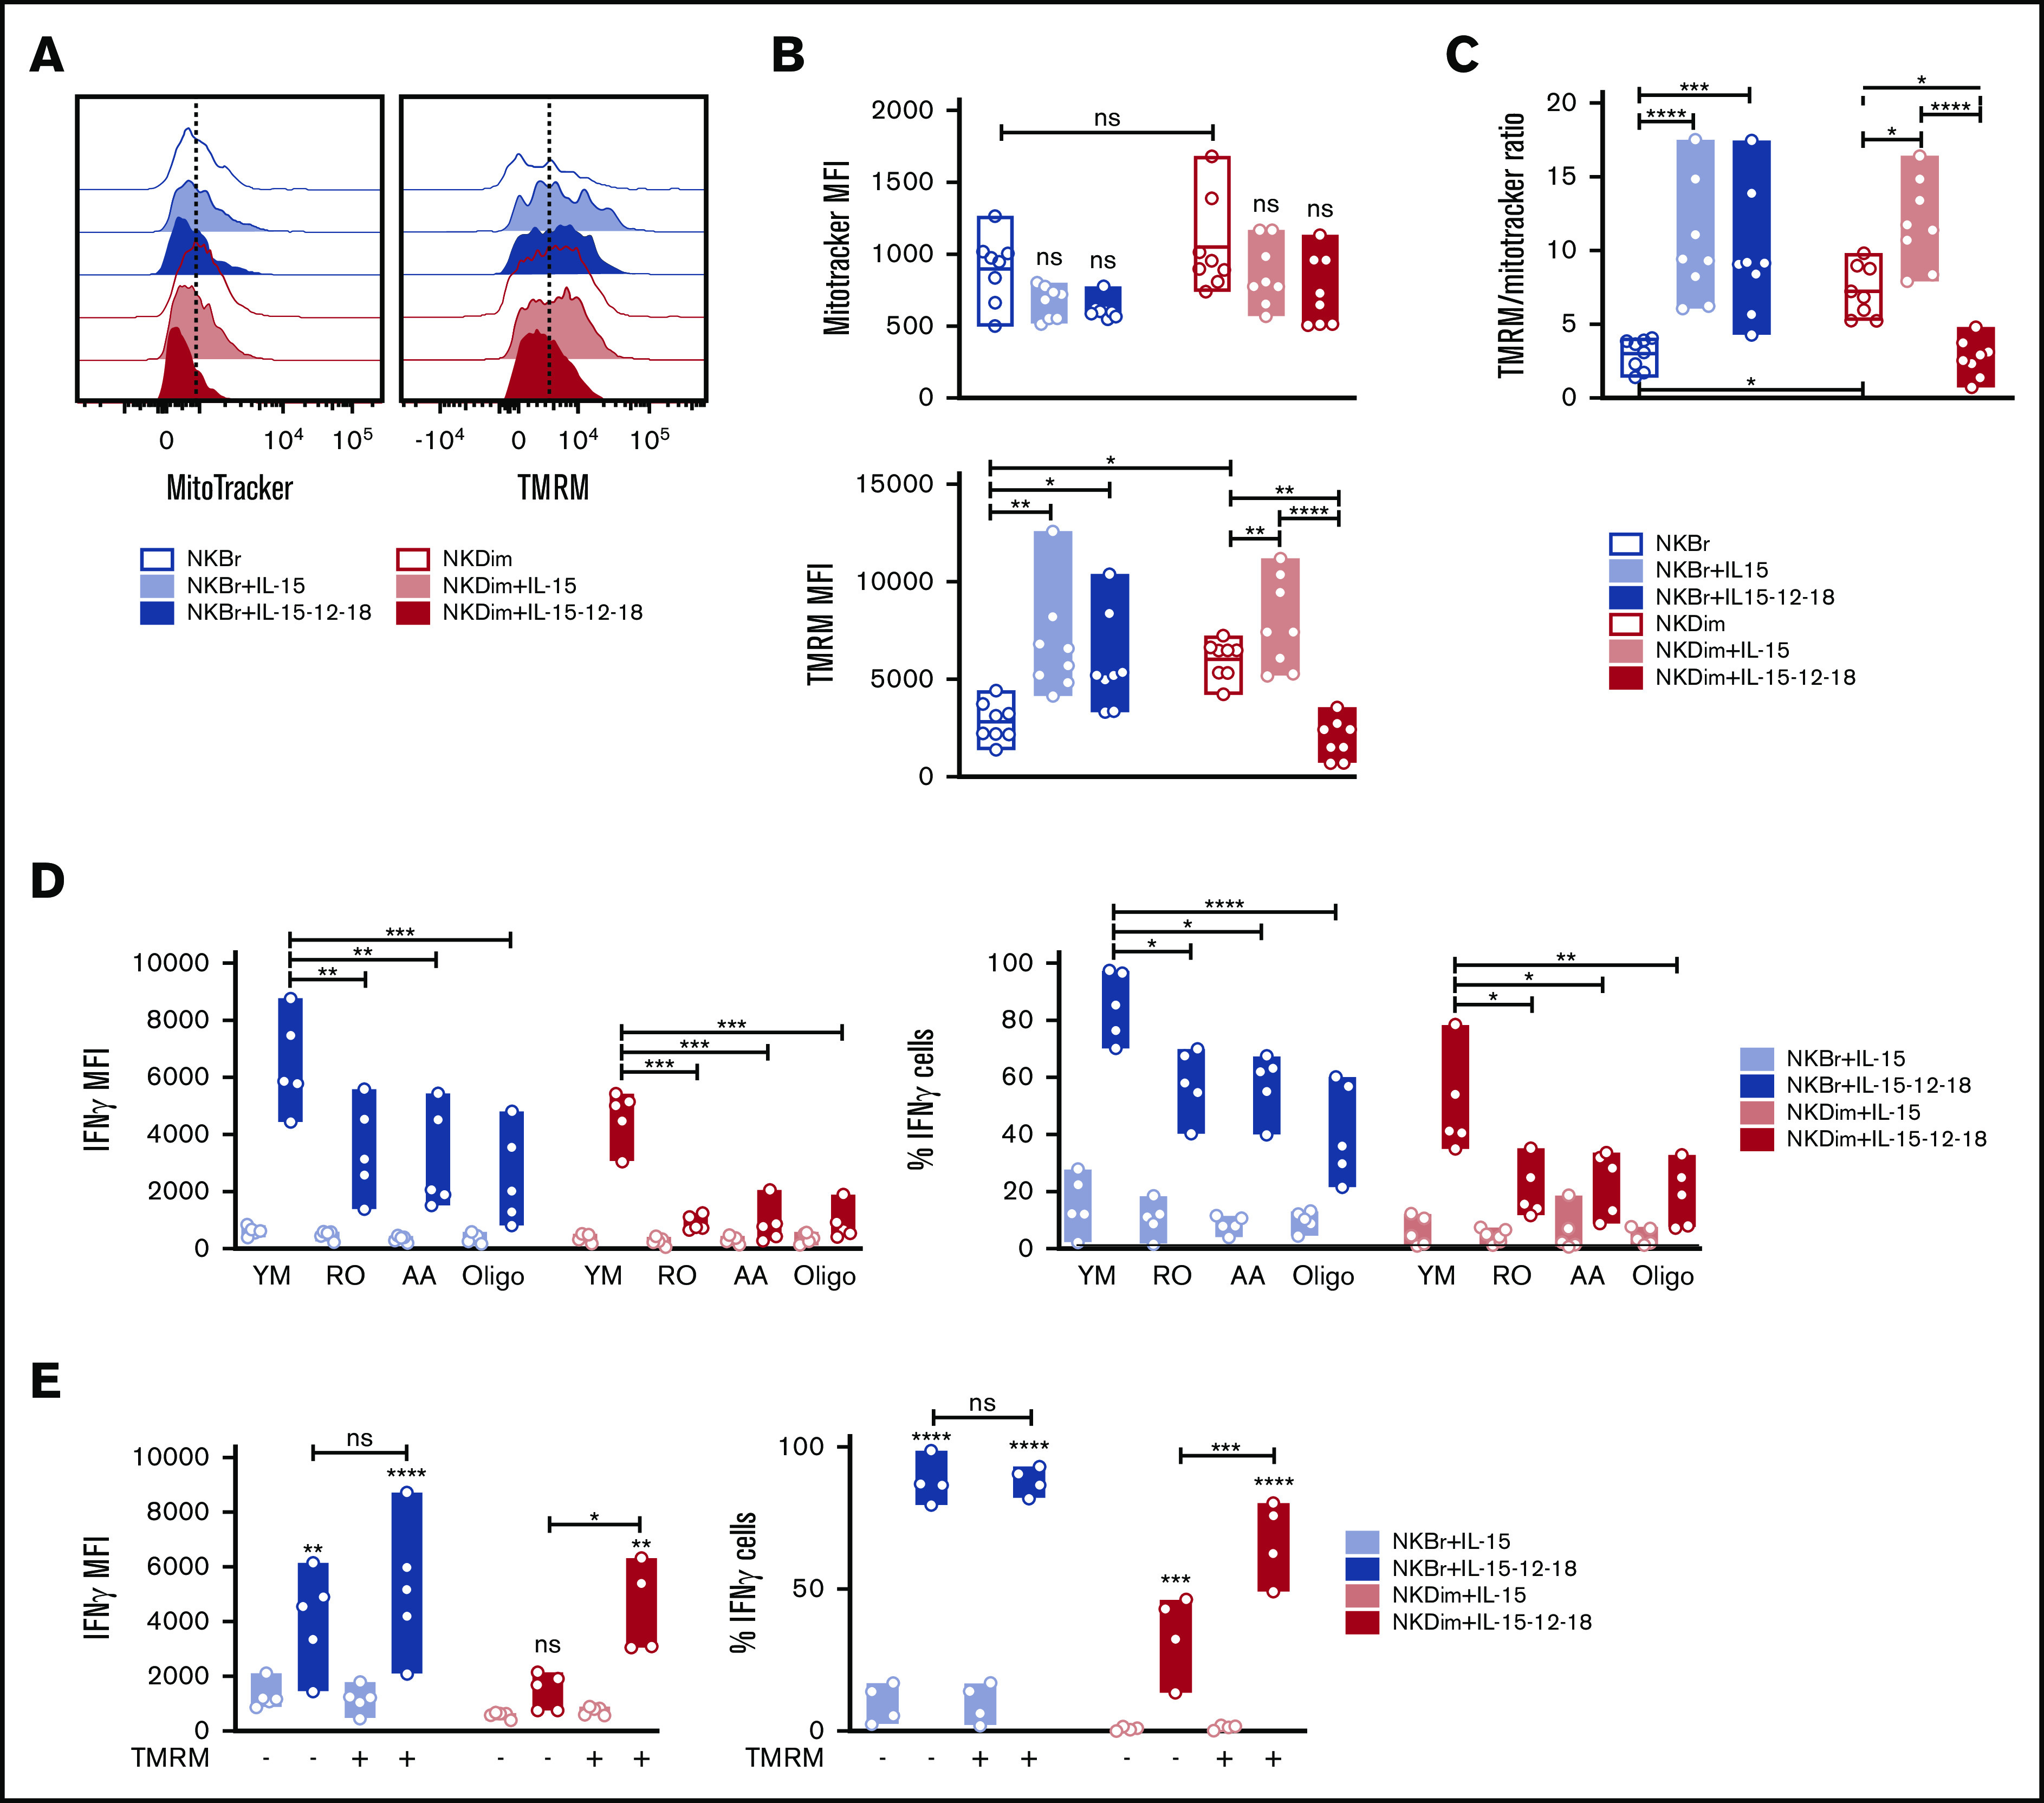
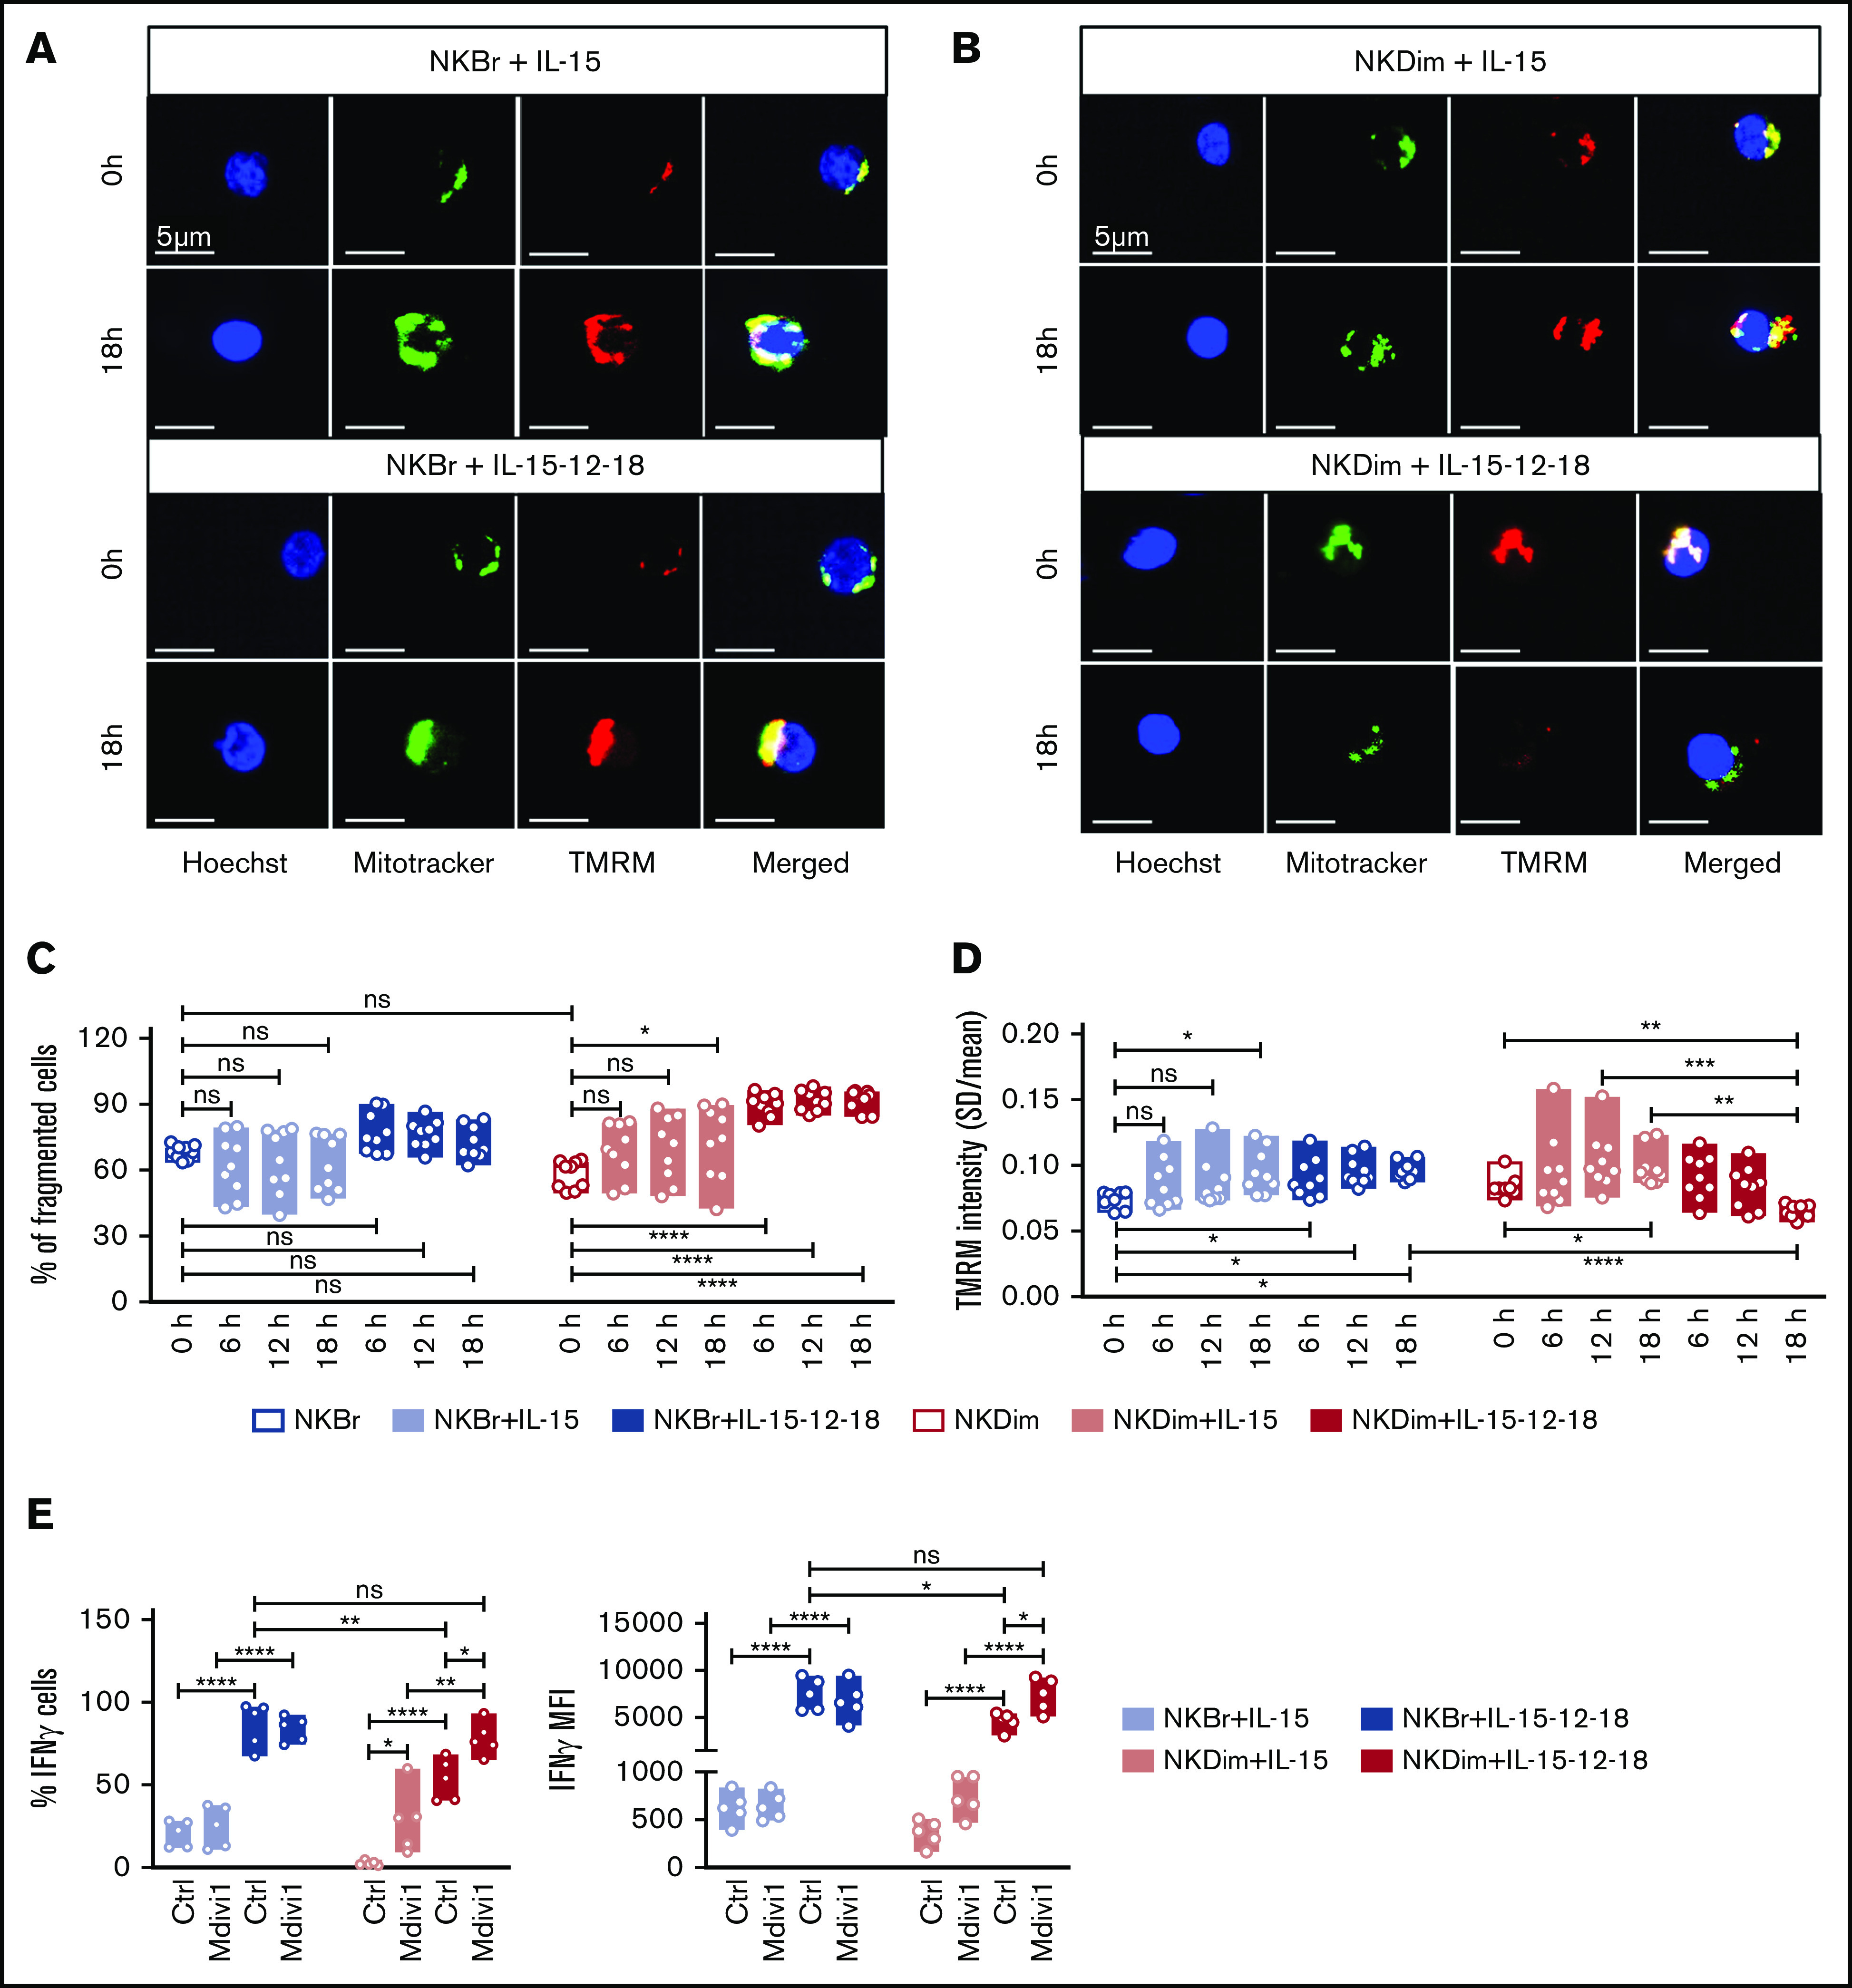
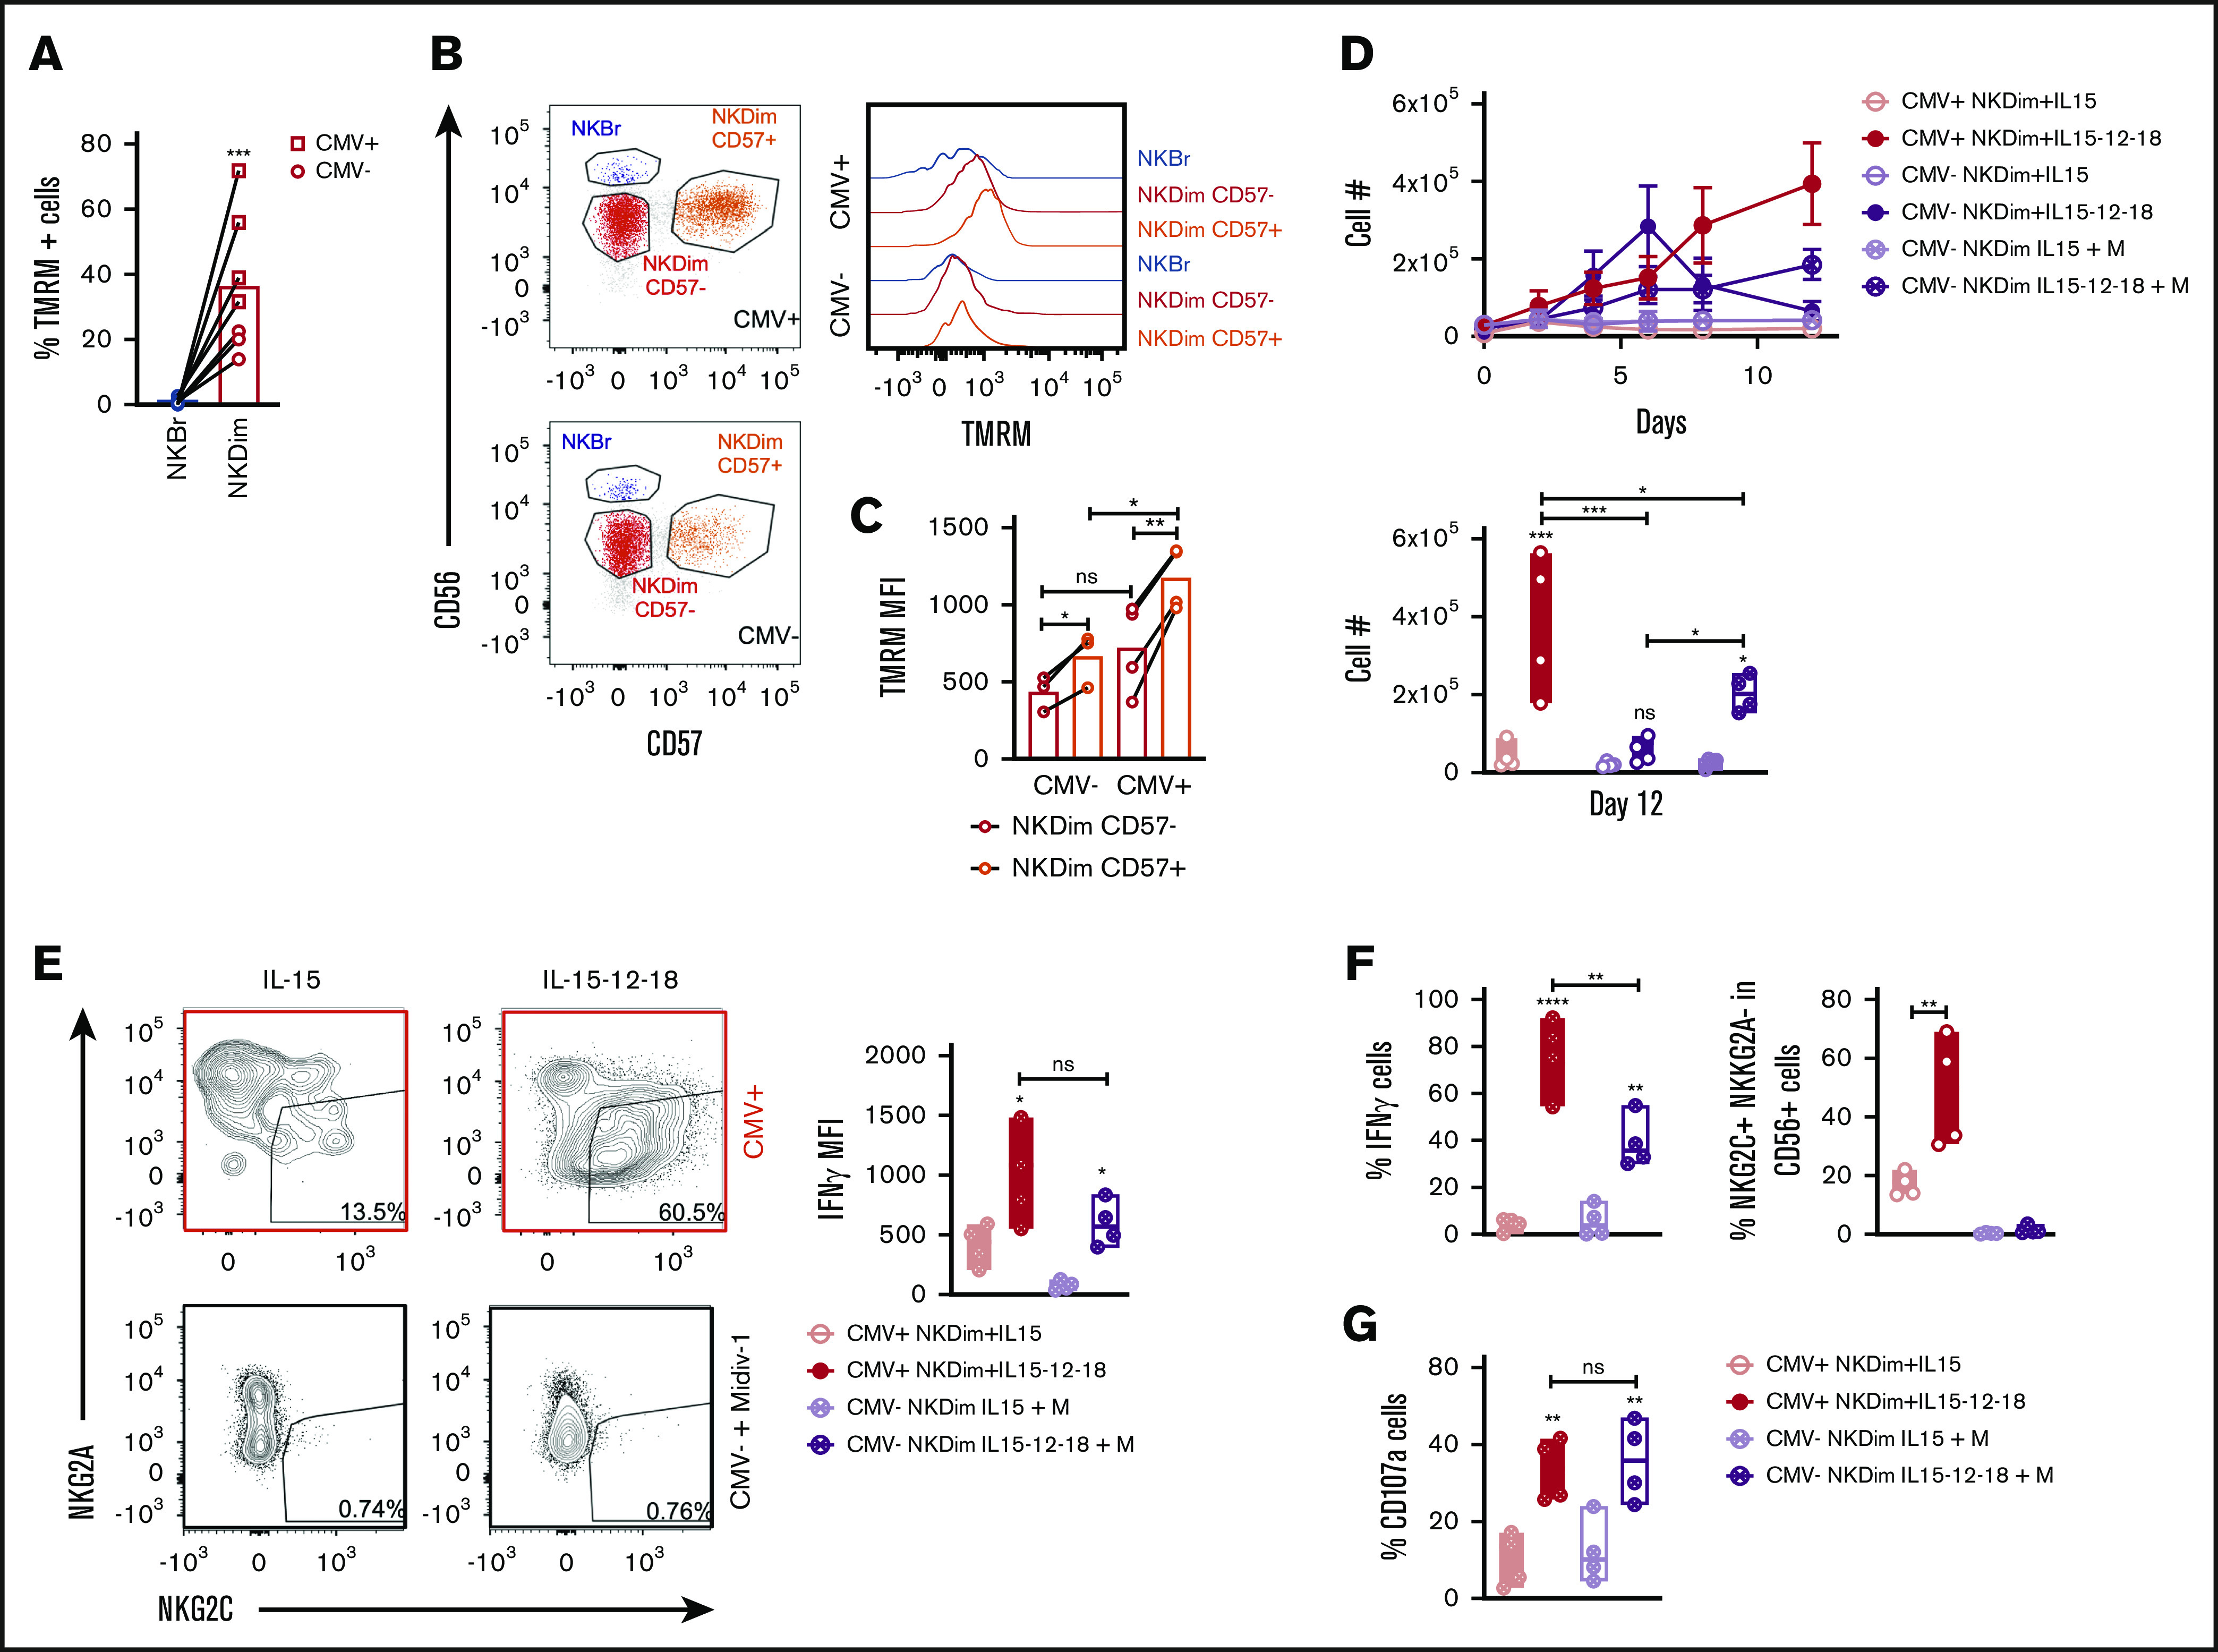
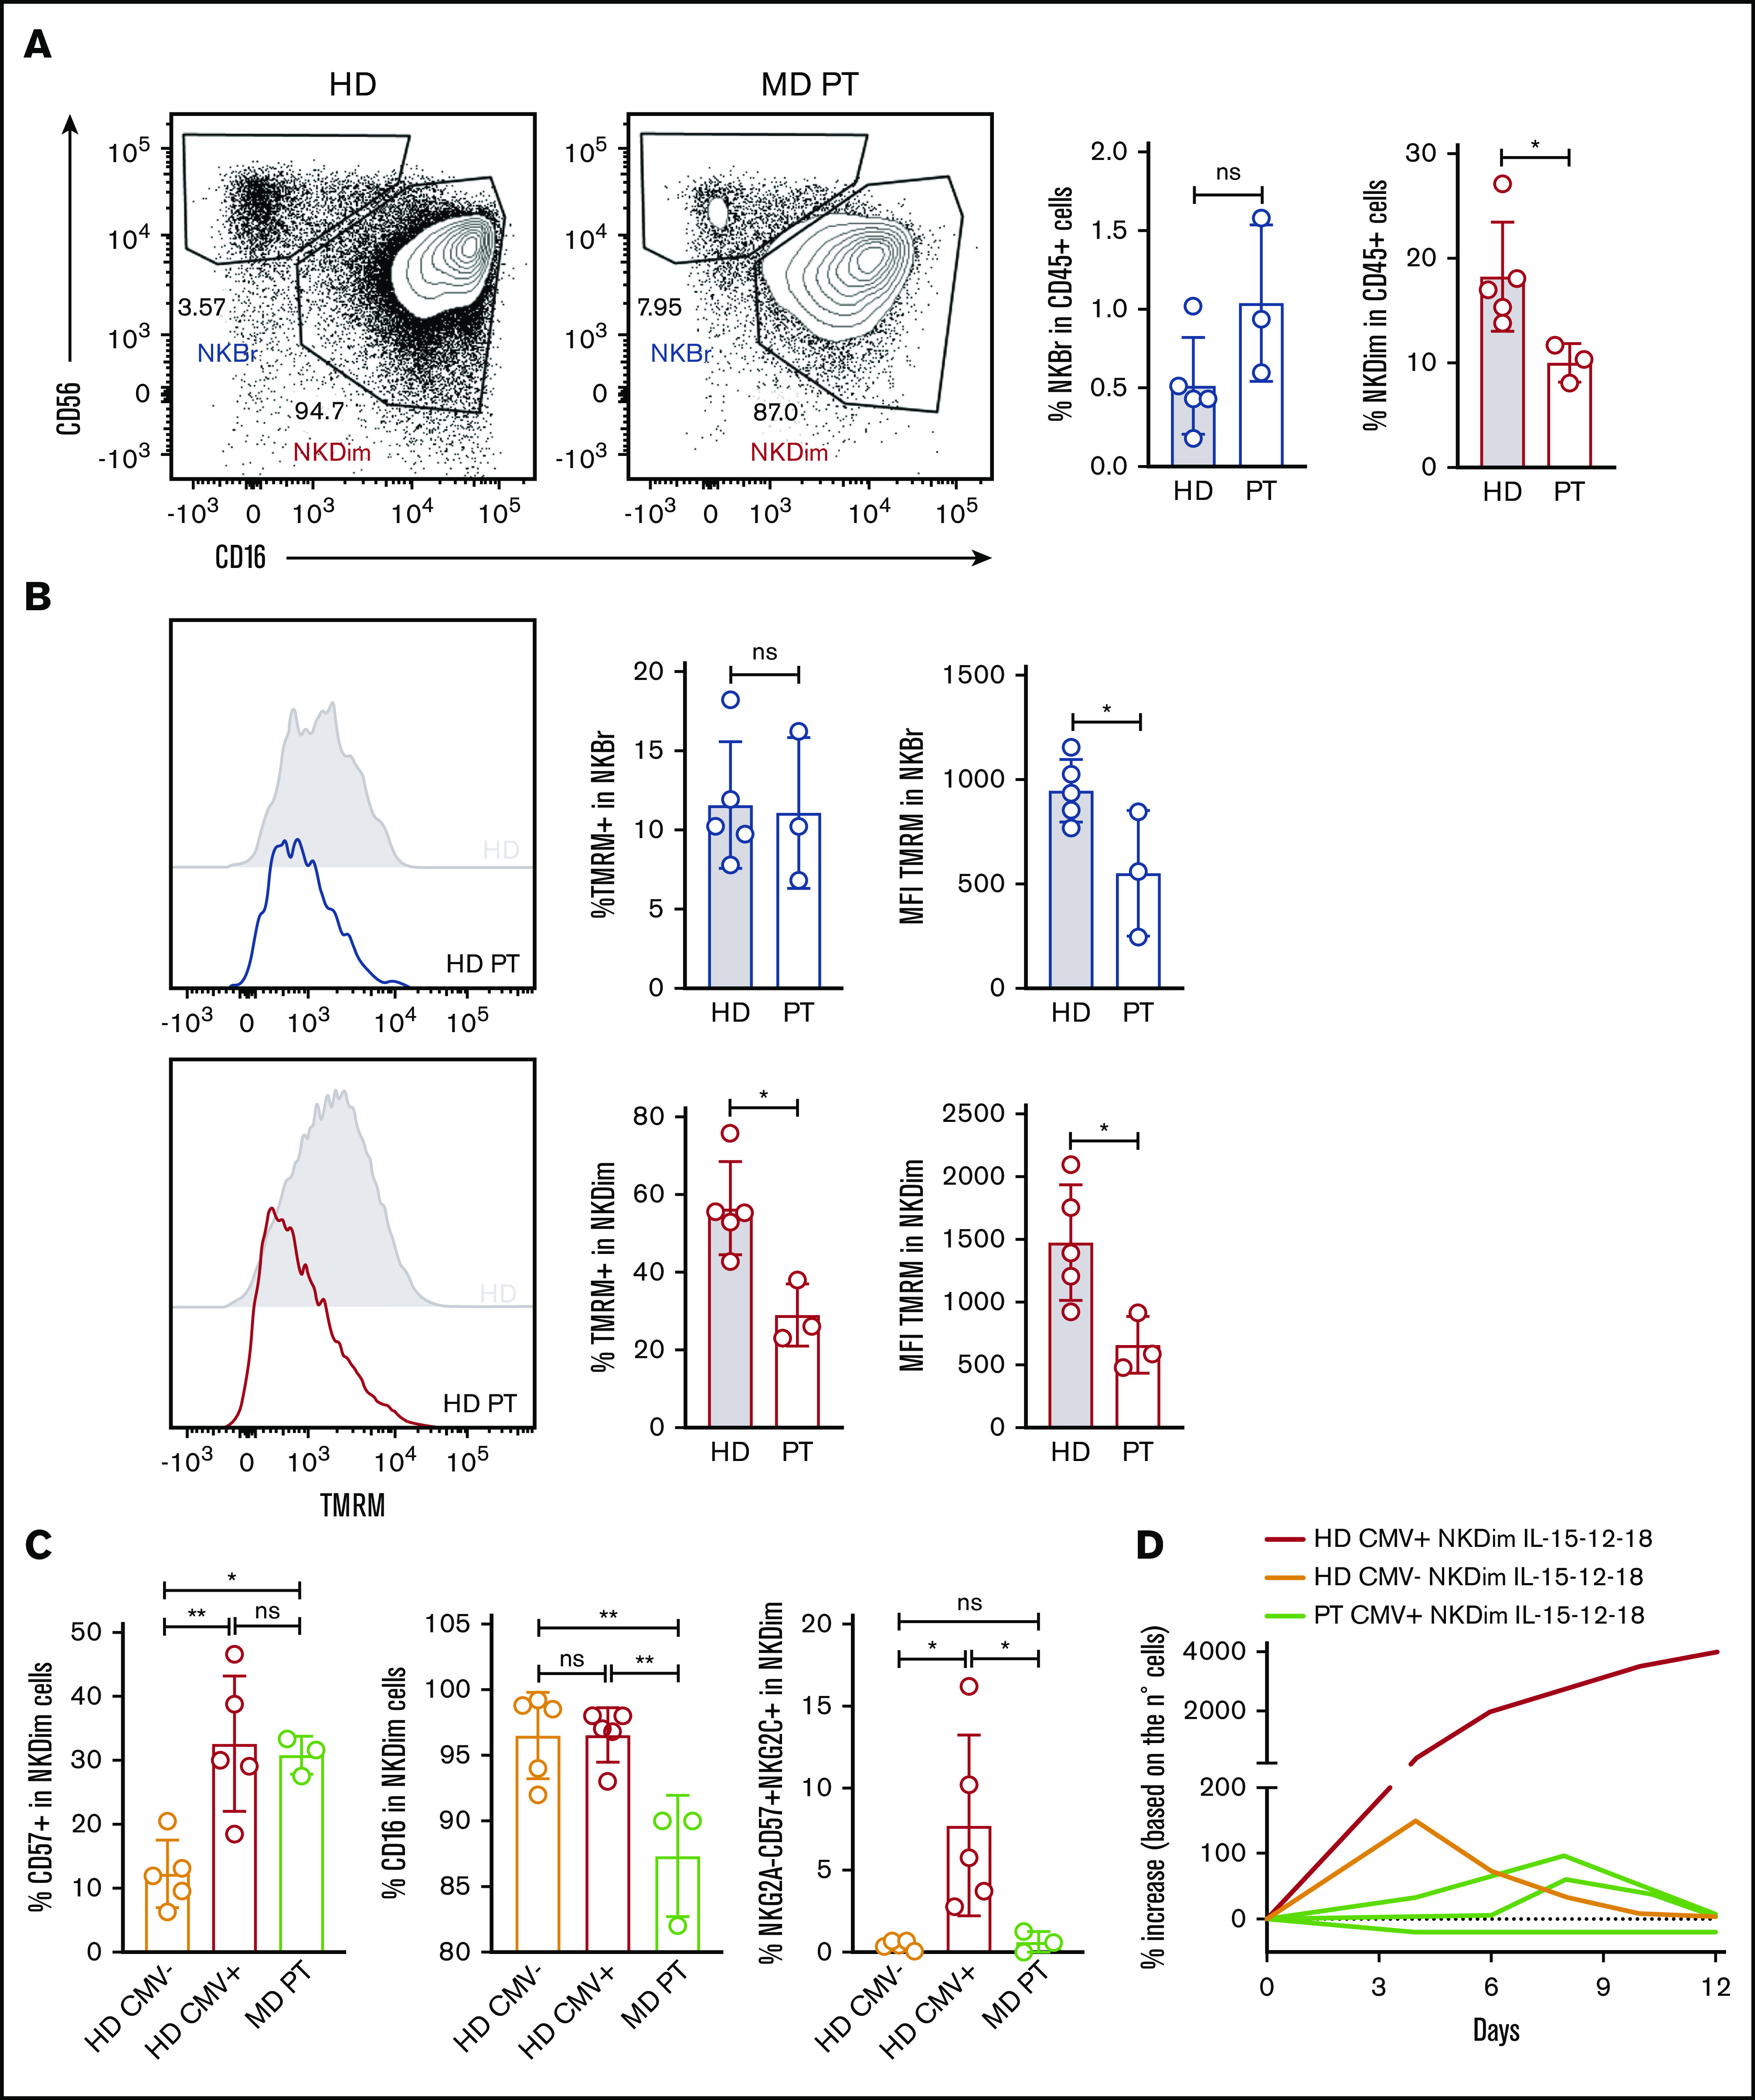
Distinct metabolic demands accompany lymphocyte differentiation into short-lived effector and long-lived memory cells. How bioenergetics processes are structured in innate natural killer (NK) cells remains unclear. We demonstrate that circulating human CD56Dim (NKDim) cells have fused mitochondria and enhanced metabolism compared with CD56Br (NKBr) cells. Upon activation, these 2 subsets showed a dichotomous response, with further mitochondrial potentiation in NKBr cells vs paradoxical mitochondrial fission and depolarization in NKDim cells. The latter effect impaired interferon-γ production, but rescue was possible by inhibiting mitochondrial fragmentation, implicating mitochondrial polarization as a central regulator of NK cell function. NKDim cells are heterogeneous, and mitochondrial polarization was associated with enhanced survival and function in mature NKDim cells, including memory-like human cytomegalovirus-dependent CD57+NKG2C+ subsets. In contrast, patients with genetic defects in mitochondrial fusion had a deficiency in adaptive NK cells, which had poor survival in culture. These results support mitochondrial polarization as a central regulator of mature NK cell fitness.


Conflict of interest statement

Conflict-of-interest disclosure: The authors declare no competing financial interests.

Figures

None
Graphical abstract
Figure 1.
Figure 1.
Energetic substrate use in NKDim vs NKBr cells at steady state and upon activation. (A) In vitro model of NKBr and NKDim cell priming and activation. (B-D) Freshly fluorescence-activated cell-sorted NKDim and NKBr cells, IL-15 primed or activated with IL-15/12/18 (18 h) were monitored for cell-surface expression of the GLUT-1 and ASCT2 transporters and percentage of positive cells (B) (data from 3 independent experiments with 1 HD each) and FL-BODIPY-C16 uptake (C) (data from 3 independent experiments with 1 or 2 HDs each). (D) Expression of IFN-γ and percentage of IFN-γ–producing cells were monitored in NKBr and NKDim cells incubated with IL-15 or IL-15/12/18 for 18 hours in the presence of different inhibitors: 1 mM of 2-DG, 4 μM of BPTES, or 20 μM of ETO (data are mean ± standard error of the mean [SEM]; data summarized from 3 independent experiments with at least 2 HDs each). P > .05 was considered not significant (ns). *P < .05, **P < .01, ***P < .001, ****P < .0001 using 2-way analysis of variance with Tukey’s correction. MFI, mean fluorescence intensity.
Figure 2.
Figure 2.
Steady-state CD56DimNK cells have latent mitochondrial activity and undergo a metabolic switch upon cytokine stimulation. (A-C) Metabolic function analyzed by extracellular flux analysis (EFA) in freshly fluorescence-activated cell-sorted (FACS) NKBr and NKDim cells. Cells were sequentially treated with glucose medium (medium), oligomycin A (Oligo), FCCP, and RO plus AA as indicated. (A) ECARs and maximal glycolysis (average values after glucose injection minus average basal ECAR values). (B) OCR plot. Calculation of the maximal respiration (average maximal OCR after FCCP) and basal respiration (average basal respiration after medium injection). (C) Mitochondrial spare respiratory capacity (SRC; average maximal OCR values after FCCP injection minus baseline OCR; data are representative of 3 independent experiments with 2 or 3 donors each). (D) Average fold increase comparing NKBr and NKDim cells is shown for all genes in OXPHOS complexes. Each dot represents the median relative expression level across donors. (E-G) EFA analysis in FACS NKBr and NKDim cells cultured for 18 hours in presence of IL-15 ± IL-12/18. Cells were sequentially treated as indicated above. ECAR and maximal glycolysis (E), OCR, maximal, and basal respiration (F), and SRC (G) (data are representative of 3 independent experiments; data are mean ± SEM). P > .05 was considered not significant (ns; or not indicated). *P < .05, **P < .01, ***P < .001 using 1-way analysis of variance with Tukey’s correction.
Figure 3.
Figure 3.
Mitochondrial membrane potential regulates cytokine production in cytokine-activated NK cells. (A-C) Mitochondrial mass was assessed by MitoTracker green and membrane potential (Δψm) by TMRM incorporation in freshly sorted NKBr and NKDim cells (empty bars) and cultured for 18 hours in presence of IL-15 ± IL-12/18 (filled bars). (C) TMRM/Mitotracker ratio (data are mean ± SEM; data summarized from 4 independent experiments with 2 donors each). (D) Primed or activated NKBr and NKDim cells were cultured for 18 hours with the following inhibitors: 10 μM of RO, 10 μM of AA, and 2 nM of oligomycin A. Expression of IFN-γ and percentage of cells producing IFN-γ were monitored by fluorescence-activated cell sorting (FACS; data from 3 independent experiments with at least 2 donors each). (E) TMRM+ and TMRM NKBr and NKDim cells were sorted and cultured with IL-15 or IL-15/12/18 for 18 hours. Expression of IFN-γ and percentage of positive cells in the different conditions were measured by FACS (data from 4 HDs). P > .05 was considered not significant (ns). *P < .05, **P < .01, ***P < .001, ****P < .0001 using 1-way analysis of variance with Tukey’s correction.
Figure 4.
Figure 4.
Divergent changes in mitochondrial morphology accompany activation of NKBr vs NKDim cells. (A-D) Freshly sorted NKDim and NKBr cells were stained with Mitotracker green and TMRM and imaged by confocal microscopy (0 hours). Cytokines were added to the medium as indicated in the figures, and images were taken every 6 hours. . (C-D) Mitochondrial fragmentation (C) and total TMRM intensity (D) at different time points for NKBr and NKDim cells. Circles are technical replicates from 3 HDs. (E) Primed or activated NKBr and NKDim cells were cultured for 18 hours ± Mdivi-1 (25 μM). Expression of IFN-γ was monitored by fluorescence-activated cell sorting; data from 3 independent experiments with at least 2 donors each). P > .05 was considered not significant (ns). *P < .05, **P < .01, ***P < .001, ****P < .0001 using 1-way analysis of variance with Tukey’s correction.
Figure 5.
Figure 5.
Mitochondrial fusion maintains NK cell survival and cellular fitness. (A) Percentage of TMRM+ cells in NKBr and NKDim cells (data from 7 HDs). (B-C) Quantification of TMRM in CD57+ NKDim and CD57 NKDim cells in CMV+ and CMV donors: representative plots (B) and quantification (C) (geometric mean fluorescence intensity [MFI]). (D-G) NKDim cells were cultured with IL-15 or IL-15/12/18 for 12 days. Mdivi-1 was added or not to NKDim cells from CMV donors. (D) Growth curves of NKDim cells isolated from CMV+ and CMV HDs and cell numbers at end point. (E) Representative fluorescence-activated cell sorting (FACS) analysis of NKG2C and NKG2A and percentage of NKG2C+NKG2A cells in the indicated culture conditions at day 12. Quantification by FACS of IFN-γ and percentage of IFN-γ+ cells (F) and CD107a+ cells (G) at day 12 (data are mean ± SEM; data summarized from 3 independent experiments with at least 2 HDs each). P > .05 was considered not significant (ns). *P < .05, **P < .01, ***P < .001, ****P < .0001 using 2-way analysis of variance with Tukey’s correction.
Figure 6.
Figure 6.
NK cells from MD patients have loss of memory-like NK cells and showed reduced cellular fitness. (A) Representative plots of NKBr and NKDim cells in HDs and MD patients with OPA1 mutation. Percentage of NKBr and NKDim cells in CD45+ cells. (B) Representative histograms of mitochondrial polarization in NKDim and NKBr cells comparing HDs and MD patients. Percentage of TMRM+ cells and TMRM intensity in NKBr and NKDim cells. (C) HDs and MD patients were compared with 5 CMV+ HDs by fluorescence-activated cell sorting (FACS). FACS analysis of the percentage of CD57+, CD16+, and CD57+NKG2ANKG2C+ cells in NKDim cells. (D) Cells from 2 HDs and 3 MD patients were cultured in IL-15/12/18 for 12 days. Percentage of increase was calculated based on the number of cells (red, CMV+ HD; orange, CMV HD; green, MD patients; data summarized from 2 independent experiments with at least 2 HDs each and 3 MD patients). P > .05 was considered not significant (ns). *P < .05, **P < .01 using 1-way analysis of variance with Tukey’s correction.

References

    1. Pearce EL, Pearce EJ. Metabolic pathways in immune cell activation and quiescence. Immunity. 2013;38(4):633-643. - PMC - PubMed
    1. Chang C-H, Curtis JD, Maggi LB Jr., et al. . Posttranscriptional control of T cell effector function by aerobic glycolysis. Cell. 2013;153(6):1239-1251. - PMC - PubMed
    1. Peng M, Yin N, Chhangawala S, Xu K, Leslie CS, Li MO. Aerobic glycolysis promotes T helper 1 cell differentiation through an epigenetic mechanism. Science. 2016;354(6311):481-484. - PMC - PubMed
    1. Bantug GR, Galluzzi L, Kroemer G, Hess C. The spectrum of T cell metabolism in health and disease. Nat Rev Immunol. 2018;18(1):19-34. - PubMed
    1. Nicoli F, Papagno L, Frere JJ, et al. . Naïve CD8+ T-cells engage a versatile metabolic program upon activation in humans and differ energetically from memory CD8+ T-cells. Front Immunol. 2018;9:2736. - PMC - PubMed

Publication types