. 2021 Jul;74(1):133-147.
doi: 10.1002/hep.31750. Epub 2021 Jun 24.

A Machine Learning Approach Enables Quantitative Measurement of Liver Histology and Disease Monitoring in NASH

Affiliations

A Machine Learning Approach Enables Quantitative Measurement of Liver Histology and Disease Monitoring in NASH

Amaro Taylor-Weiner et al. Hepatology. 2021 Jul.

Abstract

Background and aims: Manual histological assessment is currently the accepted standard for diagnosing and monitoring disease progression in NASH, but is limited by variability in interpretation and insensitivity to change. Thus, there is a critical need for improved tools to assess liver pathology in order to risk stratify NASH patients and monitor treatment response.

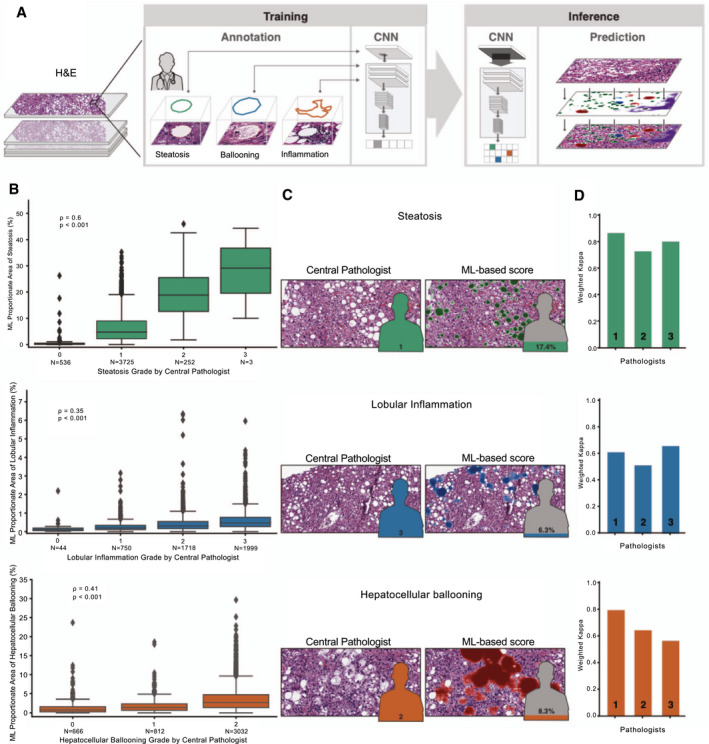
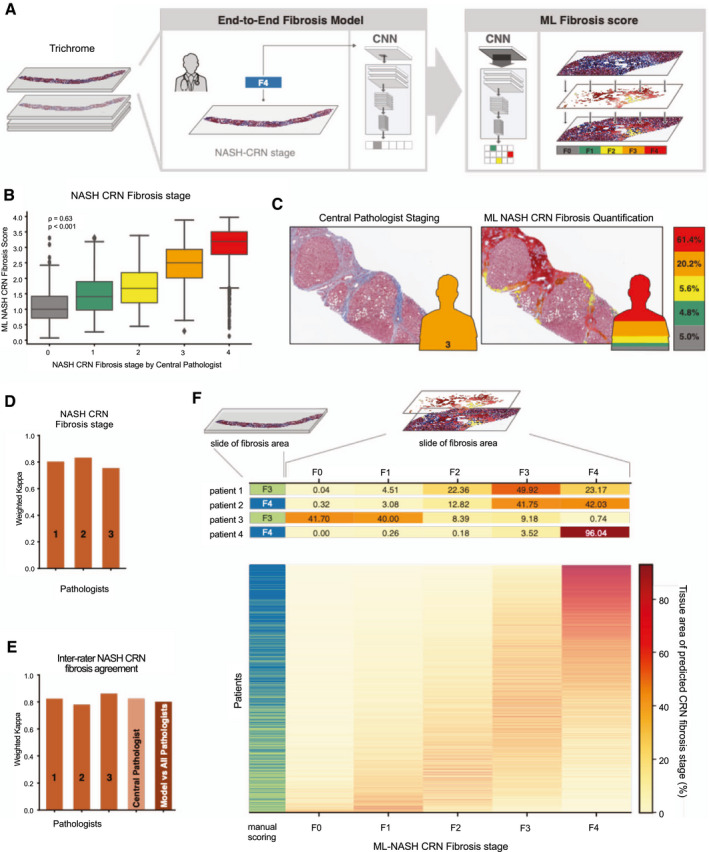
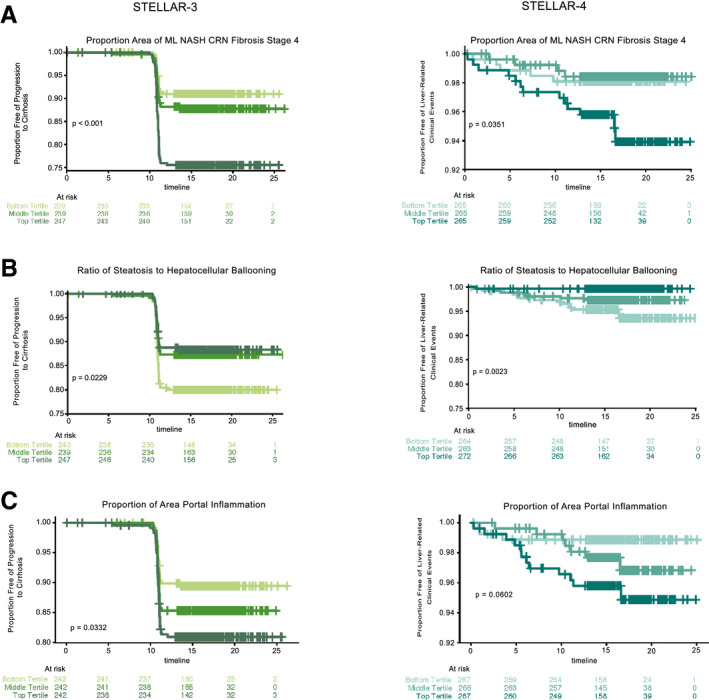
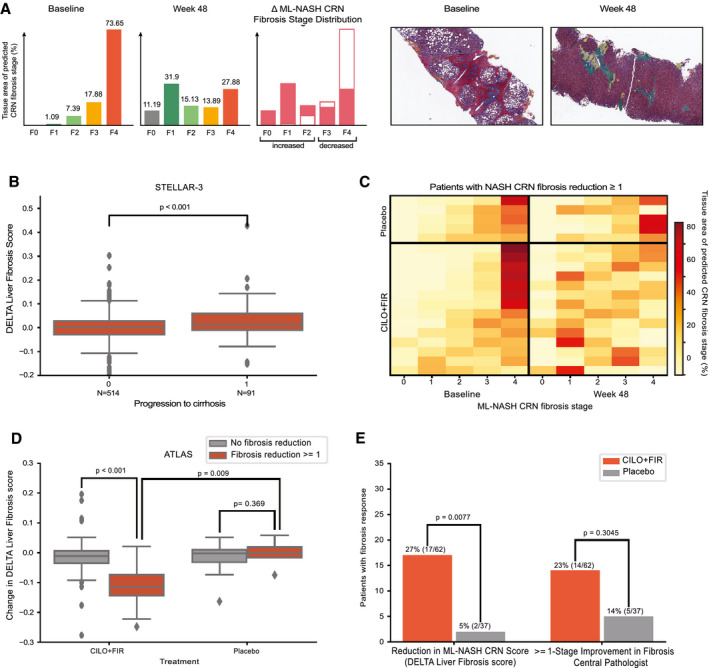
Approach and results: Here, we describe a machine learning (ML)-based approach to liver histology assessment, which accurately characterizes disease severity and heterogeneity, and sensitively quantifies treatment response in NASH. We use samples from three randomized controlled trials to build and then validate deep convolutional neural networks to measure key histological features in NASH, including steatosis, inflammation, hepatocellular ballooning, and fibrosis. The ML-based predictions showed strong correlations with expert pathologists and were prognostic of progression to cirrhosis and liver-related clinical events. We developed a heterogeneity-sensitive metric of fibrosis response, the Deep Learning Treatment Assessment Liver Fibrosis score, which measured antifibrotic treatment effects that went undetected by manual pathological staging and was concordant with histological disease progression.

Conclusions: Our ML method has shown reproducibility and sensitivity and was prognostic for disease progression, demonstrating the power of ML to advance our understanding of disease heterogeneity in NASH, risk stratify affected patients, and facilitate the development of therapies.


Figures

FIG. 1
FIG. 1
ML system for quantification of NAS features. (A) ML process for training and deploying models for the NAS. Example pathologist annotations are shown in the middle panel (bounding boxes). These annotations are used for model training to generate pixel‐resolution heatmaps (left panel), which segment the tissue into corresponding regions. (B) Box‐and‐whisker plots showing comparison of ordinal score based on evaluation by the CP (x‐axis) and ML‐based model measurement (y‐axis). Model values describe the proportion of tissue area predicted to be the substance in question (steatosis, lobular inflammation, or HB). Values shown are Spearman correlation coefficients (rho) and corresponding P values. Boxes show the interquartile range (IQR), and whiskers show 1.5× the limit of the IQR. Points show values beyond this range. (C) Example pathological images (left) and corresponding ML heatmaps (right). Figures represent pathologist label (left) and model predictions (right). Heatmaps represent model predictions: Green regions are predicted to be steatosis (top), blue regions are predicted to be lobular inflammation (middle), and red regions are predicted to be HB (bottom). (D) Intrapathologist reproducibility for scoring of NAS parameters. Values shown are weighted Cohen’s kappa computed for the repeated grading of the same slides (N = 166).
FIG. 2
FIG. 2
ML system for staging of fibrosis. (A) ML process for training and deploying models for fibrosis staging. Model is trained using the CP’s ordinal fibrosis stage (NASH CRN 0‐4 and Ishak 0‐6, middle panel). The model performs pixel‐wise prediction, and these predictions are pooled over the entire slide to yield a per‐slide prediction and distribution of fibrosis stages (left panel). (B) Box‐and‐whisker plots showing comparison of ordinal stage based on evaluation by the CP (x‐axis) and ML‐based model measurement (y‐axis). The ML‐based measurement is the weighted average NASH CRN fibrosis stage based on model predictions (Materials and Methods). Spearman correlation coefficients (rho) and corresponding P values are inset. Boxes show the IQR, and whiskers show 1.5× the limit of the IQR. Points show values beyond this range. (C) Example pathological image with and without ML‐based heatmap and stacked bar chart. Pixel‐wise predictions of NASH CRN fibrosis stage are shown on the left (gray = 0, green = 1, yellow = 2, orange = 3, and red = 4). Height of bar chart represents percentage of tissue classified as each fibrosis stage. (D) Intrapathologist reproducibility for NASH CRN fibrosis stage. Values shown are weighted Cohen’s kappa computed for repeated staging of the same slides (N = 166). (E) Pathologist and model inter‐rater agreement for staging of fibrosis. Bar charts show the weighted Cohen’s kappa for each pathologist’s score and the model’s score against the consensus of pathologists. (F) Heterogeneity of fibrosis within patients with advanced fibrosis (F3‐F4) attributable to NASH. Leftmost column represents the CP’s single ordinal stage (green = F3 and blue = F4). Middle panel shows a heatmap where each row is a patient and each column is an ML NASH CRN predicted stage. The color of each box represents the percentage of that patient’s biopsy, which is predicted to be consistent with each NASH CRN fibrosis stage (0‐4).
FIG. 3
FIG. 3
Application of ML features for assessing prognosis and monitoring responses to treatment and disease progression. Kaplan‐Meier curves showing proportions of patients with bridging fibrosis (F3) without progression to cirrhosis (left panel, STELLAR‐3) or patients with cirrhosis (F4) without liver‐related clinical events (right panel, STELLAR‐4) over time. Patients are categorized into subgroups by tertile of (A) percentage of area predicted to be NASH CRN stage 4, (B) ratio of steatosis to HB, and (C) percent area of portal inflammation based on ML predictions. Tertiles are shown by shades of green (STELLAR‐3) and blue (STELLAR‐4), with the lightest shades indicating the bottom tertile and darkest shades the top tertile. P values were computed using the log‐rank test.
FIG. 4
FIG. 4
(A) Example quantification of changes in fibrosis from advanced (F3‐F4) to less‐advanced (≤F2) fibrosis stage patterns for a patient treated with the CILO + FIR in the ATLAS trial. Sample regions with heatmaps are shown at baseline and week 48 below. (B) Box‐and‐whisker plot showing the difference in DELTA Liver Fibrosis score for patients who did and did not progress to cirrhosis at week 48 in STELLAR‐3. (C) Heatmap showing the change in percentage of each fibrosis stage pattern between baseline and week 48 in biopsies from patients in the placebo (top) and CILO + FIR (bottom) arms of the ATLAS trial. Each row represents a patient, all of whom were determined by the CP to have had a ≥1‐stage improvement in NASH CRN fibrosis stage. Each column is an ML NASH CRN predicted fibrosis stage. The color of each box represents the percentage of that patient’s biopsy, which is predicted to be consistent with each NASH CRN fibrosis stage (0‐4) at baseline (left) and at week 48 (right). (D) Box‐and‐whisker plot showing the DELTA Liver Fibrosis score for patients in the placebo and CILO + FIR arms of the ATLAS trial according to achievement of a ≥1‐stage improvement in fibrosis according to the CP. (B,D) P values for comparisons of change in DELTA Liver Fibrosis score between groups was computed using the Mann‐Whitney U test. Boxes show the interquartile range (IQR), and whiskers show 1.5× the limit of the IQR. (E) Bar chart showing the proportion of patients in the placebo (gray) and CILO + FIR arms (red) of the ATLAS study with a reduction in fibrosis as assessed by the DELTA Liver Fibrosis score and according to the CP using the NASH CRN classification. P values computed using Fisher’s exact test.

Comment in

References

    1. Estes C, Razavi H, Loomba R, Younossi Z, Sanyal AJ. Modeling the epidemic of nonalcoholic fatty liver disease demonstrates an exponential increase in burden of disease. Hepatology 2018;67:123‐133. - PMC - PubMed
    1. Estes C, Anstee QM, Arias‐Loste MT, Bantel H, Bellentani S, Caballeria J, et al. Modeling NAFLD disease burden in China, France, Germany, Italy, Japan, Spain, United Kingdom, and United States for the period 2016‐2030. J Hepatol 2018;69:896‐904. - PubMed
    1. Younossi Z, Stepanova M, Ong JP, Jacobson IM, Bugianesi E, Duseja A, et al. Nonalcoholic steatohepatitis is the fastest growing cause of hepatocellular carcinoma in liver transplant candidates. Clin Gastroenterol Hepatol 2019;17:748‐755.e3. - PubMed
    1. Kleiner DE, Brunt EM, Van Natta M, Behling C, Contos MJ, Cummings OW, et al. Design and validation of a histological scoring system for nonalcoholic fatty liver disease. Hepatology 2005;41:1313‐1321. - PubMed
    1. Merriman RB, Ferrell LD, Patti MG, Weston SR, Pabst MS, Aouizerat BE, et al. Correlation of paired liver biopsies in morbidly obese patients with suspected nonalcoholic fatty liver disease. Hepatology 2006;44:874‐880. - PubMed

Publication types

MeSH terms