. 2021 Apr 1;131(7):e145516.
doi: 10.1172/JCI145516.

Durable SARS-CoV-2 B cell immunity after mild or severe disease

Affiliations

Durable SARS-CoV-2 B cell immunity after mild or severe disease

Clinton O Ogega et al. J Clin Invest. .

Abstract

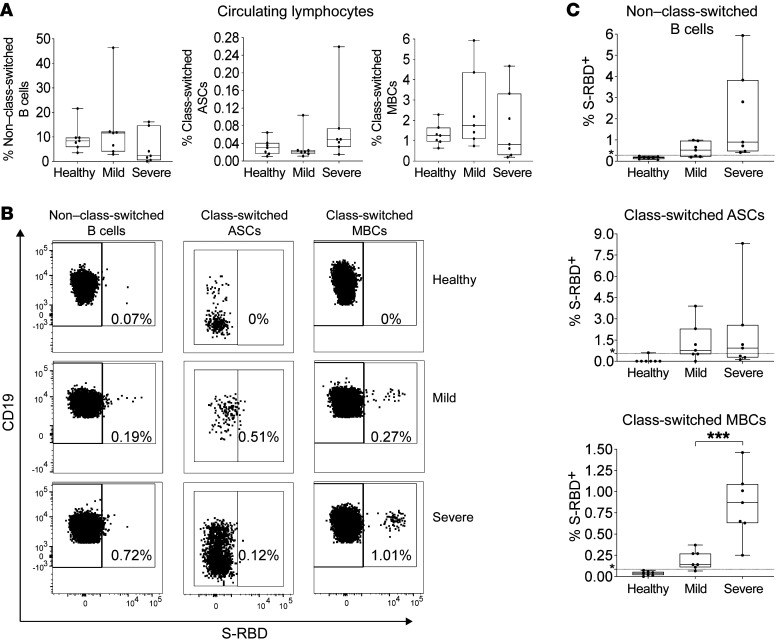
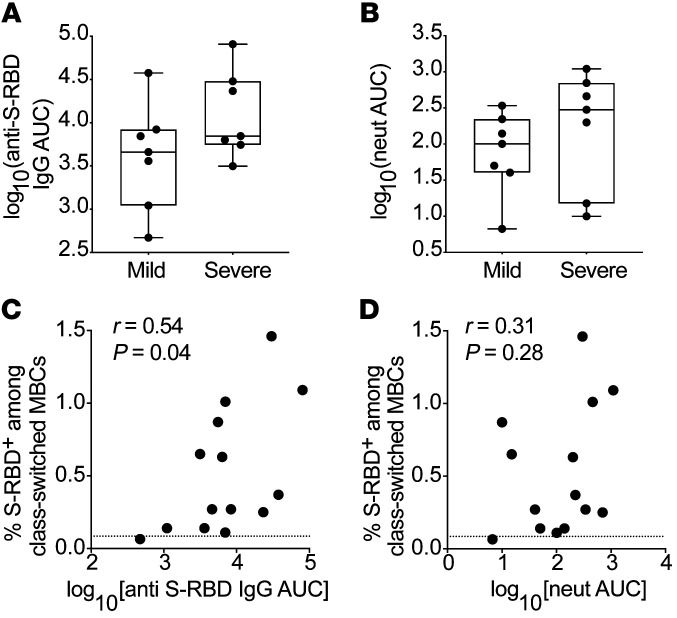
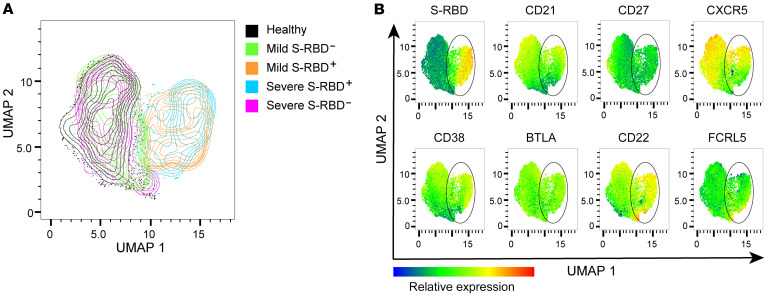
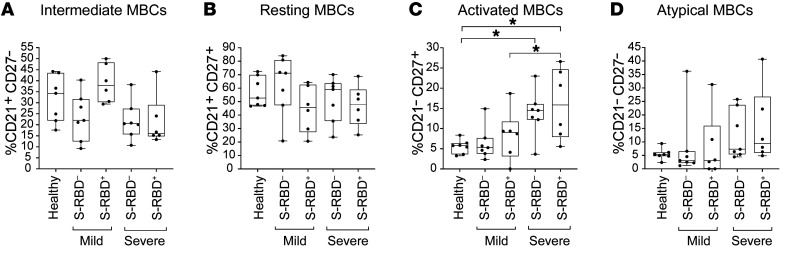
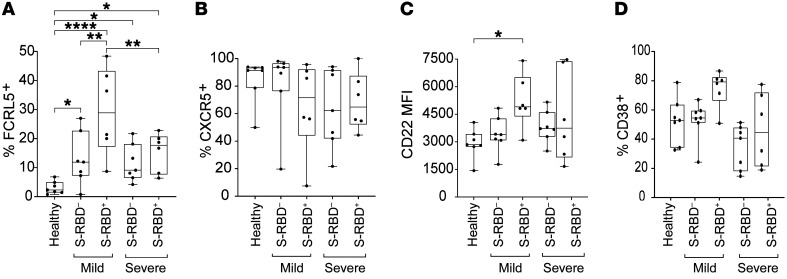
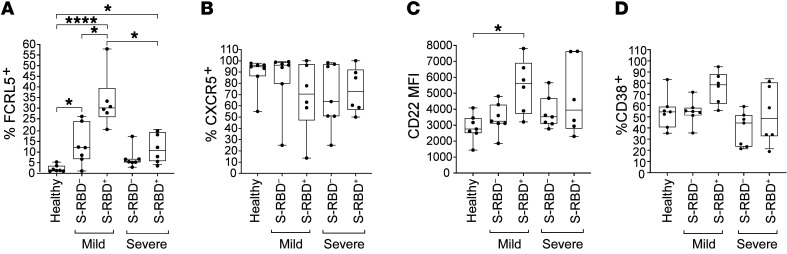
Multiple studies have shown loss of severe acute respiratory syndrome coronavirus 2-specific (SARS-CoV-2-specific) antibodies over time after infection, raising concern that humoral immunity against the virus is not durable. If immunity wanes quickly, millions of people may be at risk for reinfection after recovery from coronavirus disease 2019 (COVID-19). However, memory B cells (MBCs) could provide durable humoral immunity even if serum neutralizing antibody titers decline. We performed multidimensional flow cytometric analysis of S protein receptor binding domain-specific (S-RBD-specific) MBCs in cohorts of ambulatory patients with COVID-19 with mild disease (n = 7), and hospitalized patients with moderate to severe disease (n = 7), at a median of 54 days (range, 39-104 days) after symptom onset. We detected S-RBD-specific class-switched MBCs in 13 of 14 participants, failing only in the individual with the lowest plasma levels of anti-S-RBD IgG and neutralizing antibodies. Resting MBCs (rMBCs) made up the largest proportion of S-RBD-specific MBCs in both cohorts. FCRL5, a marker of functional memory on rMBCs, was more dramatically upregulated on S-RBD-specific rMBCs after mild infection than after severe infection. These data indicate that most SARS-CoV-2-infected individuals develop S-RBD-specific, class-switched rMBCs that resemble germinal center-derived B cells induced by effective vaccination against other pathogens, providing evidence for durable B cell-mediated immunity against SARS-CoV-2 after mild or severe disease.

Keywords: Adaptive immunity; Beta cells; Immunology; Infectious disease.


Conflict of interest statement

Conflict of interest: The authors have declared that no conflict of interest exists.

Figures

Figure 1
Figure 1. Quantifying S-RBD–specific B cells.
(A) Percentage of lymphocytes that are class-switched MBCs, class-switched ASCs, or non-class switched B cells in healthy (COVID-19), mild (COVID-19+, ambulatory), and severe (COVID-19+, hospitalized) participants (n = 7 for each group). (B) Gating strategy for S-RBD–specific non–class-switched B cells (CD3, CD19+, IgD/IgM+, S-RBD+), S-RBD–specific class-switched MBCs (CD3, CD19+, IgM, IgD, CD38+/– (excluding ++), CD138, S-RBD+), and S-RBD–specific class-switched ASCs (CD3, CD19+/–, IgM, IgD, CD38+/+, CD27+, S-RBD+) in healthy, mild, and severe participants. (C) Percentage of class-switched MBCs, class-switched ASCs, and non–class-switched B cells that are S-RBD–specific in healthy, mild, and severe participants (n = 7 for each group). Dotted line represents the true positive threshold, defined as the mean plus 2 standard deviations of the healthy group. For box plots, horizontal lines indicate means, boxes are interquartile range, and whiskers are minimum to maximum. Normality of data was determined using Shapiro Wilk normality test. Comparisons in A were performed using 1-way ANOVA for normally distributed data or Kruskal-Wallis test for non–normally distributed data, with P values adjusted for multiple comparisons using the Benjamini, Krieger, and Yekutieli method. Comparisons between mild and severe patients in C were performed with 2-tailed t tests if data were normally distributed or Mann Whitney test if data were not normally distributed. Statistically significant comparisons are indicated (***P ≤ 0.001).
Figure 2
Figure 2. Comparisons of serum anti-S-RBD IgG and neutralizing antibody titers in mild and severe participants.
(A) Anti S-RBD IgG AUC in mild or severe participants. (B) Neutralizing antibody AUC in mild or severe participants. (C) Correlation between percentage of class-switched MBCs that are S-RBD specific and plasma anti-S-RBD IgG AUC from the same subjects. (D) Correlation between percentage of class-switched MBCs that are S-RBD specific and plasma neutralizing antibody AUC values from the same subjects. Dotted line represents the true S-RBD positive threshold, defined as the mean plus 2 standard deviations of the healthy group. For box plots, horizontal lines indicate means, boxes are interquartile range, and whiskers are minimum to maximum. Normality of data was confirmed by Shapiro Wilk normality test. Significance in A and B was calculated using 2-tailed t tests. Correlation r and P values in C and D were calculated by the Pearson method.
Figure 3
Figure 3. UMAP projection of class-switched MBCs and heatmap statistic of surface receptors.
(A) Concatenated class-switched MBCs from healthy, mild, and severe subjects projected as a UMAP of S-RBD binding and CD21, CD27, CD38, FcRL5, CD22, CXCR5, and BTLA expression. All S-RBD+ MBCs were included, and S-RBD MBCs were downsampled to match S-RBD+ counts for each subject. (B) Multigraph color mapping of cell surface receptors on the UMAP projection, with S-RBD+ MBCs indicated on each UMAP with a black oval. Lowest expression is indicated by blue and highest expression by red.
Figure 4
Figure 4. Frequency of MBC subsets in S-RBD or S-RBD+ class-switched MBCs from healthy, mild, or severe participants.
Class-switched MBCs are defined as CD3, CD19+, IgM, IgD, CD38+/– (excluding ++), CD138. In addition, (A) intMBCs are CD21+, CD27; (B) rMBCs are CD21+, CD27+; (C) actMBCs are CD21, CD27+; and (D) atyMBCs are CD21, CD27. Horizontal lines indicate means, boxes are interquartile range, and whiskers are minimum to maximum. Normality of data was determined using Shapiro Wilk normality test, and comparisons were performed using 1-way ANOVA for normally distributed data (B and C) or Kruskal-Wallis test for non–normally distributed data (A and D), with P values adjusted for multiple comparisons using the Benjamini, Krieger, and Yekutieli method. Statistically significant comparisons are indicated (* P ≤ 0.05).
Figure 5
Figure 5. Surface expression of FcRL5, CXCR5, CD22, and CD38 on S-RBD or S-RBD+ class-switched MBCs from healthy, mild, or severe participants.
Expression is shown as either percentage of cells positive or the MFI. (A) FcRL5, (B) CXCR5, (C) CD22, (D) CD38. Horizontal lines indicate means, boxes are interquartile range, and whiskers are minimum to maximum. Normality of data was determined using Shapiro Wilk normality test, and comparisons were performed using 1-way ANOVA for normally distributed data (A and C) or Kruskal-Wallis test for non–normally distributed data (B and D), with P values adjusted for multiple comparisons using the Benjamini, Krieger, and Yekutieli method. Statistically significant comparisons are indicated (*P ≤ 0.05, **P ≤ 0.01, ***P ≤ 0.001, ****P ≤ 0.0001).
Figure 6
Figure 6. Surface expression of FcRL5, CXCR5, CD22, and CD38 on S-RBD+ class-switched rMBCs (CD21+, CD27+) from healthy, mild, or severe participants.
Expression is shown as either percentage of cells positive or the MFI. (A) FcRL5, (B) CXCR5, (C) CD22, (D) CD38. Horizontal lines indicate means, boxes are interquartile range, and whiskers are minimum to maximum. Normality of data was determined using Shapiro Wilk normality test, and comparisons were performed using 1-way ANOVA for normally distributed data (C and D) or Kruskal-Wallis test for non–normally distributed data (A and B), with P values adjusted for multiple comparisons using the Benjamini, Krieger, and Yekutieli method. Statistically significant comparisons are indicated (*P ≤ 0.05, ****P ≤ 0.0001).

Update of

References

    1. Guan WJ, Zhong NS. Clinical characteristics of Covid-19 in China. Reply. N Engl J Med. 2020;382(19):1861–1862. - PubMed
    1. Wang Z, et al. Clinical features of 69 cases with Coronavirus disease 2019 in Wuhan, China. Clin Infect Dis. 2020;71(15):769–777. doi: 10.1093/cid/ciaa272. - DOI - PMC - PubMed
    1. Long QX, et al. Antibody responses to SARS-CoV-2 in patients with COVID-19. Nat Med. 2020;26(6):845–848. doi: 10.1038/s41591-020-0897-1. - DOI - PubMed
    1. doi: 10.1101/2020.07.09.20148429. Seow J, et al. Longitudinal evaluation and decline of antibody responses in SARS-CoV-2 infection [preprint]. Posted on medRxiv July 11, 2020. - DOI
    1. Ibarrondo FJ, et al. Rapid decay of anti-SARS-CoV-2 antibodies in persons with Mild Covid-19. N Engl J Med. 2020;383(11):1085–1087. doi: 10.1056/NEJMc2025179. - DOI - PMC - PubMed

Publication types

MeSH terms

Substances