. 2021 Apr 1;131(7):e146927.
doi: 10.1172/JCI146927.

Antibody responses to endemic coronaviruses modulate COVID-19 convalescent plasma functionality

Affiliations

Antibody responses to endemic coronaviruses modulate COVID-19 convalescent plasma functionality

William R Morgenlander et al. J Clin Invest. .

Abstract

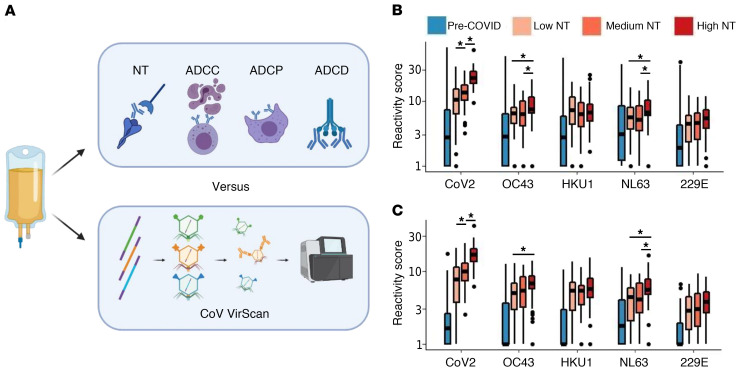
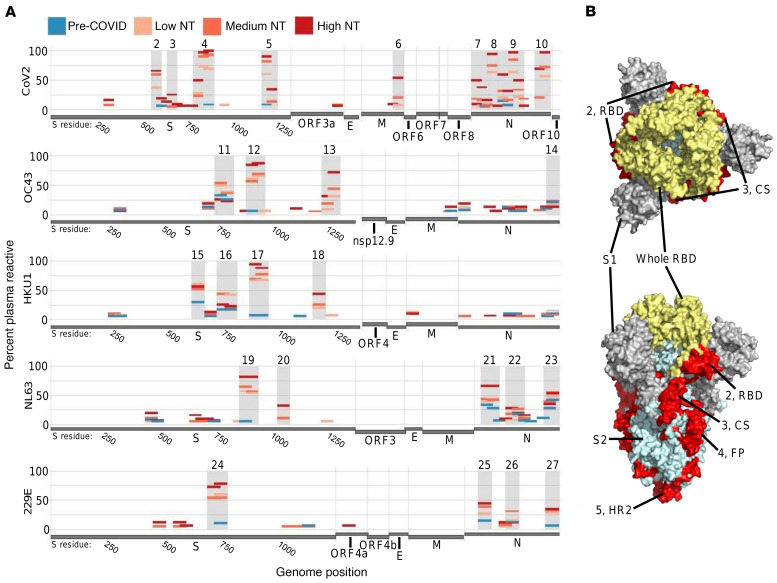
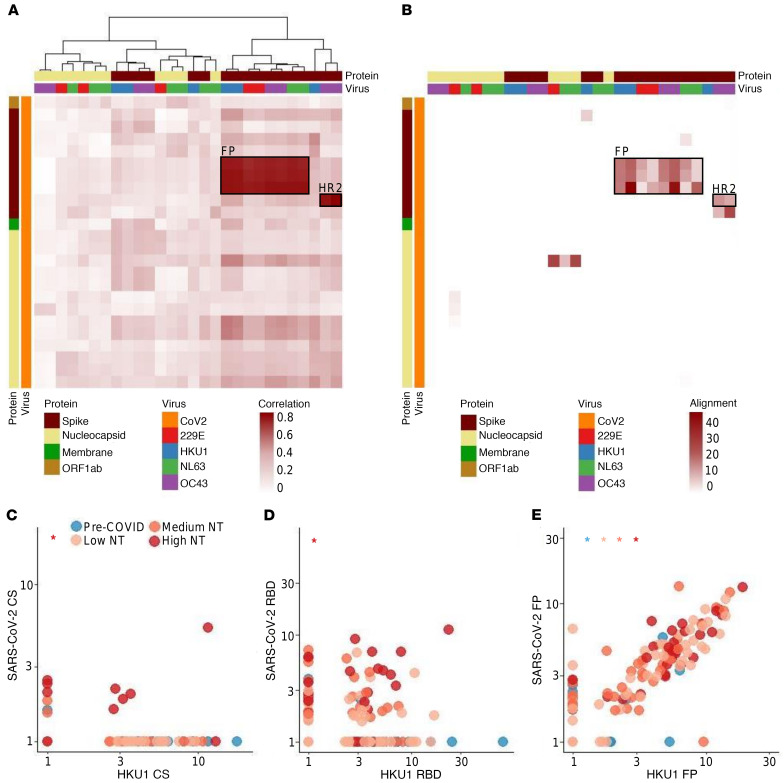
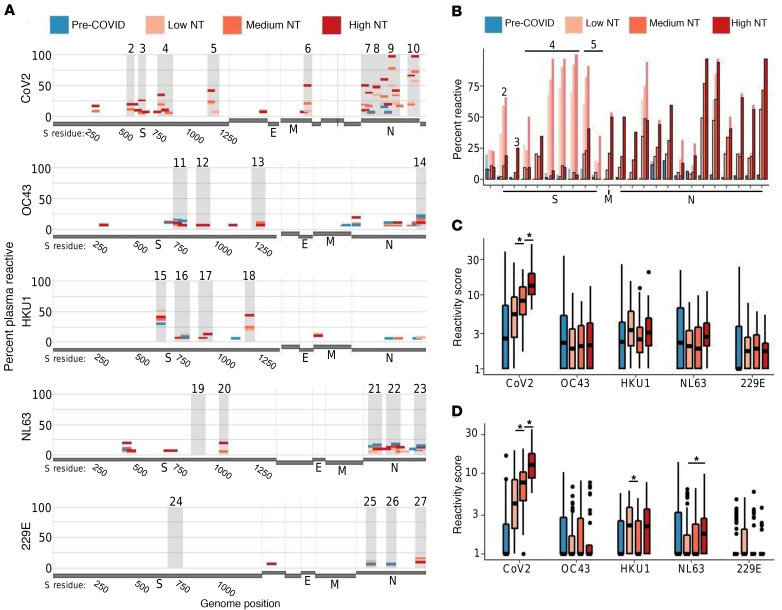
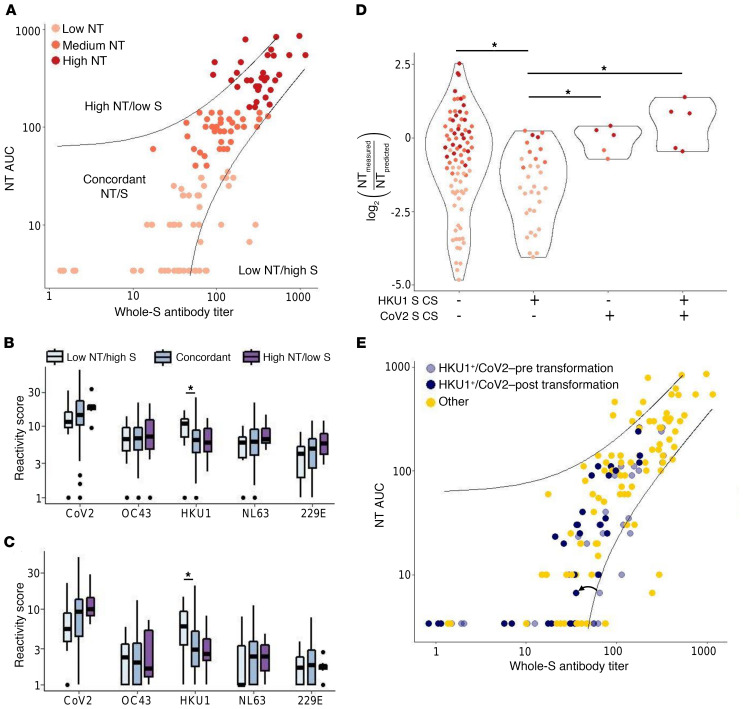
SARS-CoV-2 (CoV2) antibody therapies, including COVID-19 convalescent plasma (CCP), monoclonal antibodies, and hyperimmune globulin, are among the leading treatments for individuals with early COVID-19 infection. The functionality of convalescent plasma varies greatly, but the association of antibody epitope specificities with plasma functionality remains uncharacterized. We assessed antibody functionality and reactivities to peptides across the CoV2 and the 4 endemic human coronavirus (HCoV) genomes in 126 CCP donations. We found strong correlation between plasma functionality and polyclonal antibody targeting of CoV2 spike protein peptides. Antibody reactivity to many HCoV spike peptides also displayed strong correlation with plasma functionality, including pan-coronavirus cross-reactive epitopes located in a conserved region of the fusion peptide. After accounting for antibody cross-reactivity, we identified an association between greater alphacoronavirus NL63 antibody responses and development of highly neutralizing antibodies against CoV2. We also found that plasma preferentially reactive to the CoV2 spike receptor binding domain (RBD), versus the betacoronavirus HKU1 RBD, had higher neutralizing titer. Finally, we developed a 2-peptide serosignature that identifies plasma donations with high anti-spike titer, but that suffer from low neutralizing activity. These results suggest that analysis of coronavirus antibody fine specificities may be useful for selecting desired therapeutics and understanding the complex immune responses elicited by CoV2 infection.

Keywords: Adaptive immunity; Immunology; Infectious disease.


Conflict of interest statement

Conflict of interest: HBL and SJE are inventors on a patent application (US20160320406A, “Detection of an antibody against a pathogen”) filed by Brigham and Women’s Hospital that covers the use of the VirScan technology to identify pathogen antibodies and are founders of ImmuneID. HBL is a founder of Alchemab and Portal Bioscience, and is an advisor to CDI Laboratories and TSCAN Therapeutics. SJE is a founder of TSCAN Therapeutics, MAZE Therapeutics, and Mirimus. SJE serves on the scientific advisory board of Homology Medicines, TSCAN Therapeutics, MAZE, XChem, and is an advisor for MPM. SS has received grants from Ansun, Astrellas, Cidara, F2G, Merck, T2, Reviral, Shire, Shionogi, and Scynexis. SS has received personal fees from Acidophil, Amplyx, Janssen, Merck, Reviral, Karyopharm, Intermountain Health, and Immunome.

Figures

Figure 1
Figure 1. Correlating coronavirus peptide reactivity and functionality of COVID-19 convalescent plasma.
(A) One hundred twenty-six eligible COVID-19 convalescent plasma donors underwent functional analysis and antibody profiling via VirScan with a comprehensive coronavirus (CoV) peptide library. Functionalities included neutralizing titer (NT), antibody-dependent cellular cytotoxicity (ADCC), antibody-dependent cellular phagocytosis (ADCP), and antibody-dependent complement deposition (ADCD). Plasma from 87 prepandemic controls were additionally analyzed via VirScan. (B) COVID-19 convalescent plasma was divided into groups based on neutralizing titer area under the curve (NT AUC: Low NT, <40 [n = 55]; Medium NT, 40 to 160 [n = 39]; and High NT, ≥160 [n = 32]). Aggregate virus score was calculated as the sum of all log-transformed fold changes of peptides designed for a given virus. Bars with an asterisk indicate convalescent plasma groups that had significantly different scores. (C) Aggregate virus scores from peptides defining dominant regions. *P < 0.05 by 2-sided Wilcoxon’s test.
Figure 2
Figure 2. Defining coronavirus peptide epitopes targeted by COVID-19 convalescent plasma.
(A) The percentages of samples in each group (Pre-COVID, n = 87; Low NT, n = 55; Medium NT, n = 39; and High NT, n = 32) with reactivity to a particular peptide were plotted according to the peptide’s position along each viral genome. Dominant regions are shaded. Amino acid residue number is included for the spike protein (S). Full genome plots are provided in Supplemental Figure 1. Gene products: spike (S), envelope (E), membrane (M), and nucleocapsid (N). (B) Immunodominant regions of CoV2 S are mapped onto the CoV2 S structure (19). Trimeric spike is shown with the whole receptor binding domain (RBD) in yellow, the rest of S1 in gray, and S2 in blue. Immunodominant regions: 2 or RBD, 3 or S1/S2 cleavage site (CS), 4 or fusion peptide (FP), and 5 or heptad repeat 2 (HR2).
Figure 3
Figure 3. Reactivities against some CoV2 peptides are highly correlated with reactivities against homologous HCoV peptides.
(A) Spearman’s correlation coefficient matrix between dominant CoV2 peptides and dominant HCoV peptides is shown in the form of a clustered heatmap. CoV2 peptides (y axis) are ordered by genomic location from top to bottom, while HCoV peptides (x axis) are clustered according to their correlations. The heatmap annotations depict peptides’ protein of origin and virus of origin. Highly correlated peptides map to fusion peptide (FP) or heptad repeat 2 (HR2). (B) Sequence similarity (defined by the negative log of the blastp E value) between dominant CoV2 peptides and dominant HCoV peptides is shown. The rows and columns of the heatmap match those of the correlation heatmap to facilitate comparison. The regions of highest correlation (boxes as in A) show strongest alignment. (CE) Antibody reactivity (measured as fold changes) to 3 HKU1 S peptides are plotted against reactivity to homologous peptides of CoV2 S. The 2 CS peptides have no sequence homology and their reactivity is not correlated. The 2 RBD peptides have moderate homology and show frequent coreactivity but no strong correlation. The 2 FP peptides have high sequence homology and strong correlation among all sample groups. Asterisks indicate Pearson’s correlation with nonzero coefficient for a given plasma group (P < 0.05).
Figure 4
Figure 4. Deconvolution of COVID-19 convalescent plasma reactivities.
(A) Following deconvolution, the percentage of samples in each sample group with target-preferred peptide reactivities were plotted along the viral genomes. Amino acid residue number is included for the spike protein (S). Pre-COVID, n = 87; Low NT, n = 55; Medium NT, n = 39; and High NT, n = 32. Gene products: spike (S), envelope (E), membrane (M), and nucleocapsid (N). (B) The percentage of plasma in each sample group that had reactivity to dominant CoV2 peptides is shown before (light bars) and after (dark bars with outline) deconvolution. (C and D) Aggregate virus scores were calculated following deconvolution, using all peptides (C) or using only peptides from immunodominant regions (D). *P < 0.05 by 2-sided Wilcoxon’s test, indicating COVID-19 convalescent plasma groups that show significantly different scores.
Figure 5
Figure 5. VirScan identifies features associated with discordance between whole-spike titer and neutralizing titer.
(A) NT AUC was plotted against whole-S antibody titer. A linear regression was performed between whole S and NT AUC to establish a predicted NT AUC; boundary lines were plotted to indicate samples displaying large discordance between NT AUC and whole-S titer (Methods). Low NT, n = 55; Medium NT: n = 39, and High NT: n = 32. (B and C) Aggregate virus scores were calculated for COVID-19 convalescent plasma with concordant NT/S (n = 106), discordantly Low NT/S (n = 13), and discordantly High NT/S (n = 7) using predeconvolution (B) and postdeconvolution (C) peptide reactivity. Horizontal bars indicate differences in scores between groups. *P < 0.05 by Wilcoxon’s rank sum test. (D) Ratio of measured NT AUC to predicted NT AUC, versus CoV2 CS and HKU1 CS reactivities. *P < 0.05 by 2-sided Wilcoxon’s test. (E) COVID-19 convalescent plasma defined by the HKU1 CS+/CoV2 CS reactivity pattern (n = 32) are shown on the scatter plot in A. A correction factor (example indicated by arrow) was applied to these plasma samples to account for the association with NT/S discordance.

Update of

References

    1. Dong E, et al. An interactive web-based dashboard to track COVID-19 in real time. Lancet Infect Dis. 2020;20(5):533–534. doi: 10.1016/S1473-3099(20)30120-1. - DOI - PMC - PubMed
    1. Bloch EM, et al. Promoting access to COVID-19 convalescent plasma in low- and middle-income countries. Transfus Apher Sci. doi: 10.1016/j.transci.2020.102957. [published online September 20, 2020]. - DOI - PMC - PubMed
    1. Bloch EM, et al. Deployment of convalescent plasma for the prevention and treatment of COVID-19. J Clin Invest. 2020;130(6):2757–2765. doi: 10.1172/JCI138745. - DOI - PMC - PubMed
    1. Duan K, et al. Effectiveness of convalescent plasma therapy in severe COVID-19 patients. Proc Natl Acad Sci U S A. 2020;117(17):9490–9496. doi: 10.1073/pnas.2004168117. - DOI - PMC - PubMed
    1. Marovich M, et al. Monoclonal antibodies for prevention and treatment of COVID-19. JAMA. 2020;324(2):131–132. doi: 10.1001/jama.2020.10245. - DOI - PubMed

Publication types

MeSH terms