. 2021 Feb 11;17(2):e1008559.
doi: 10.1371/journal.pcbi.1008559. eCollection 2021 Feb.

The role of children in the spread of COVID-19: Using household data from Bnei Brak, Israel, to estimate the relative susceptibility and infectivity of children

Affiliations

The role of children in the spread of COVID-19: Using household data from Bnei Brak, Israel, to estimate the relative susceptibility and infectivity of children

Itai Dattner et al. PLoS Comput Biol. .

Abstract

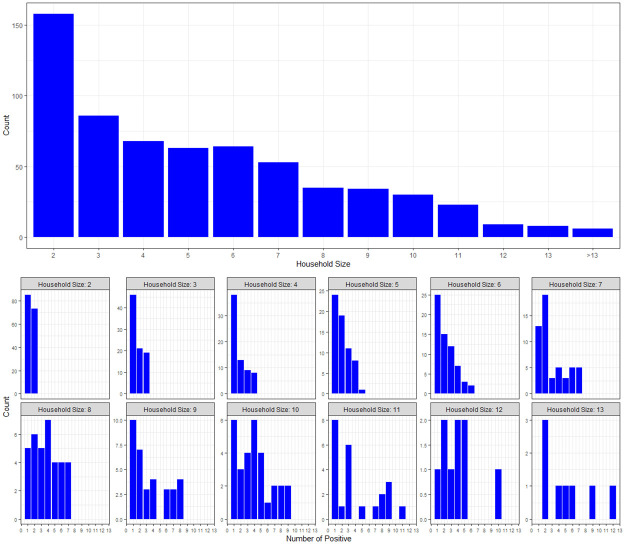
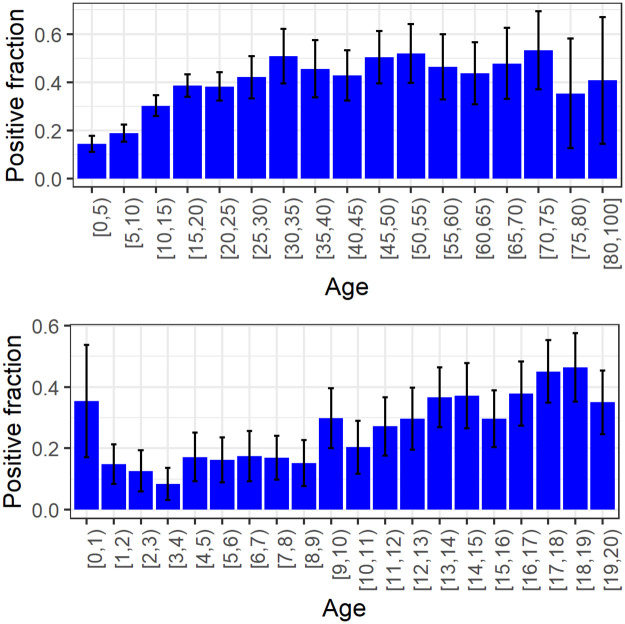
One of the significant unanswered questions about COVID-19 epidemiology relates to the role of children in transmission. This study uses data on infections within households in order to estimate the susceptibility and infectivity of children compared to those of adults. The data were collected from households in the city of Bnei Brak, Israel, in which all household members were tested for COVID-19 using PCR (637 households, average household size of 5.3). In addition, serological tests were performed on a subset of the individuals in the study. Inspection of the PCR data shows that children are less likely to be tested positive compared to adults (25% of children positive over all households, 44% of adults positive over all households, excluding index cases), and the chance of being positive increases with age. Analysis of joint PCR/serological data shows that there is under-detection of infections in the PCR testing, which is more substantial in children. However, the differences in detection rates are not sufficient to account for the differences in PCR positive rates in the two age groups. To estimate relative transmission parameters, we employ a discrete stochastic model of the spread of infection within a household, allowing for susceptibility and infectivity parameters to differ among children and adults. The model is fitted to the household data using a simulated maximum likelihood approach. To adjust parameter estimates for under-detection of infections in the PCR results, we employ a multiple imputation procedure using estimates of under-detection in children and adults, based on the available serological data. We estimate that the susceptibility of children (under 20 years old) is 43% (95% CI: [31%, 55%]) of the susceptibility of adults. The infectivity of children was estimated to be 63% (95% CI: [37%, 88%]) relative to that of adults.


Conflict of interest statement

The authors have declared that no competing interests exist.

Figures

Fig 1
Fig 1. Household sizes and the number of positives in households of different sizes.
Top panel: histogram of household sizes in the Bnei Brak data set. Bottom panel: histogram of the number of positives per household size in the Bnei Brak data set (households of size greater than 13 are not shown due to their small sample size).
Fig 2
Fig 2. Examples of two household timelines.
Each row represents the timeline of an individual in the household. The age group of each member is given in parenthesis (precise ages are not supplied, due to privacy concerns). In these examples, Household 5 includes 8 individuals and Household 142 includes 5 individuals. Red circles denote positive PCR tests while green circles denote negative PCR tests. Red squares denote days of reported symptoms onset. The period between the two vertical lines denote the observed time-period used in the model fitting, which was set, for each household, according to the rules described in Section 2.2 of S1 Text. Individuals whose label is colored in red are the suspected index cases, as determined by the criteria given in Section 2.3 of S1 Text. In Household 5, there are three suspected index cases (p6-p8), whereas in Household 142 only one (p5). Members of Household 142 were also tested using serology and the results are shown using the asterisks—red for a positive result and green for a negative. As can be seen, member p5 of Household 142 was found positive both by PCR and serology, while member p2 was found positive using serology but not using PCR. The rest of the household members were found to be negative using both PCR and serology. S2 Text contains similar timelines for all households in this study (excluding households with more than 10 individuals, which were removed for privacy consideration).
Fig 3
Fig 3. Incidence rates in Israel and in Bnei-Brak.
The number of new daily confirmed COVID-19 cases per 10,000 people in all of Israel and in the city of Bnei-Brak. The windows mark the periods of PCR and serological testing employed in our data set.
Fig 4
Fig 4. Positive rates in PCR tests, excluding index cases.
Top panel: Fraction of positives by age-group in the data set, excluding index cases. Bottom panel: Fraction of positives by age in children, excluding index cases. Binomial confidence intervals in both figures were calculated using the normal approximation.
Fig 5
Fig 5. Observed duration in households of different sizes.
A boxplot of the observed duration (in days) for different household sizes in the Bnei-Brak data set.
Fig 6
Fig 6. The log-likelihood as a function of the susceptibility and infectivity parameters.
Negative log-likelihood level curves for the parameters γ, δ, and three values of βaa. For smaller values of βaa the maximal-likelihood estimates of parameters γ and δ are larger. The white rectangle in the middle figure shows the 95% confidence region obtained using the bootstrap simulation.
Fig 7
Fig 7. Model fit to observations for households of different sizes.
Best model fit to the PCR testing data in the Bnei Brak data set, aggregated according to the household size (fit to households of size greater than or equal to 10 are not shown due to their small sample size). The histograms show the distribution of the total number of infected individuals (children+adults) in households of different sizes, together with the corresponding distributions as predicted by the model with the fitted parameters. While the fitting was done to the number of infected children and adults separately, as described in the text, the figure shows the summary results in order to allow a visual examination of the goodness-of-fit.

References

    1. Ludvigsson JF. Systematic review of COVID-19 in children shows milder cases and a better prognosis than adults. Acta Paediatrica. 2020;109(6):1088–1095. 10.1111/apa.15270 - DOI - PMC - PubMed
    1. CDCMMWR. Coronavirus Disease 2019 in Children—United States, February 12–April 2, 2020. MMWR Morbidity and Mortality Weekly Report. 2020;69 10.15585/mmwr.mm6914e4 - DOI - PMC - PubMed
    1. Dong Y, Mo X, Hu Y, Qi X, Jiang F, Jiang Z, et al. Epidemiology of COVID-19 Among Children in China. Pediatrics. 2020;145(6). - PubMed
    1. Liu Z, Xing B, Xue Za Z. The epidemiological characteristics of an outbreak of 2019 novel coronavirus diseases (COVID-19)—China, 2020. China CDC Weekly. 2020;2(8):113–122. 10.46234/ccdcw2020.032 - DOI - PMC - PubMed
    1. Shim E, Tariq A, Choi W, Lee Y, Chowell G. Transmission potential and severity of COVID-19 in South Korea. International Journal of Infectious Diseases. 2020;93:339–344. 10.1016/j.ijid.2020.03.031 - DOI - PMC - PubMed