

The impact of global and local Polynesian genetic ancestry on complex traits in Native Hawaiians
- PMID: 33571193
- PMCID: PMC7877570
- DOI: 10.1371/journal.pgen.1009273
The impact of global and local Polynesian genetic ancestry on complex traits in Native Hawaiians
Abstract
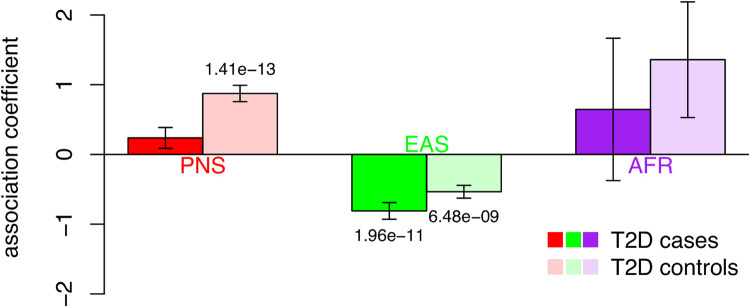
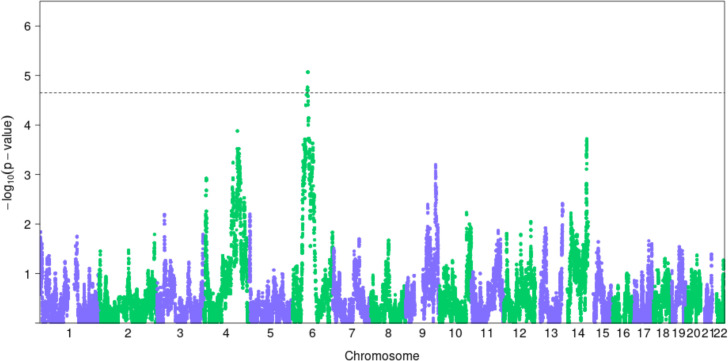
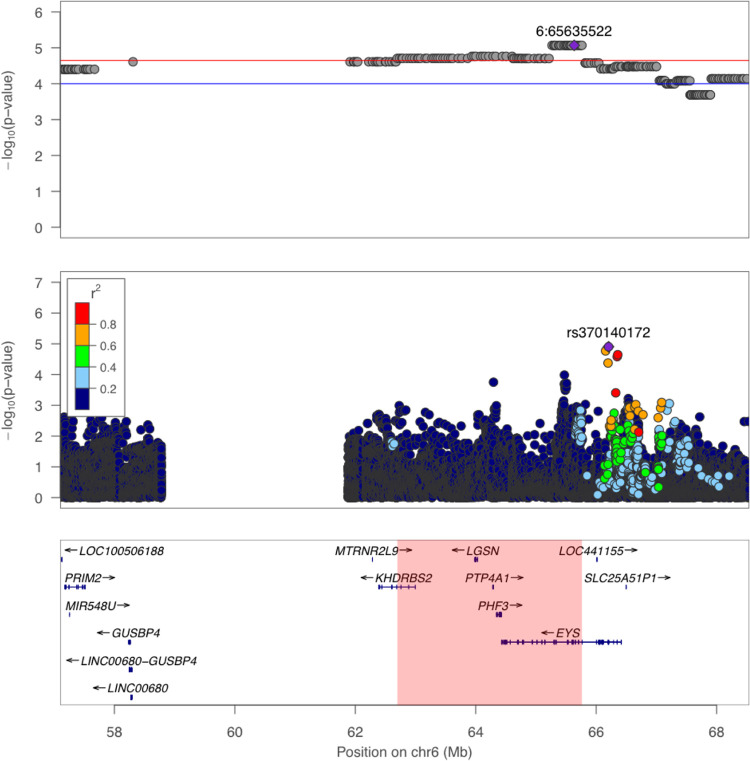
Epidemiological studies of obesity, Type-2 diabetes (T2D), cardiovascular diseases and several common cancers have revealed an increased risk in Native Hawaiians compared to European- or Asian-Americans living in the Hawaiian islands. However, there remains a gap in our understanding of the genetic factors that affect the health of Native Hawaiians. To fill this gap, we studied the genetic risk factors at both the chromosomal and sub-chromosomal scales using genome-wide SNP array data on ~4,000 Native Hawaiians from the Multiethnic Cohort. We estimated the genomic proportion of Native Hawaiian ancestry ("global ancestry," which we presumed to be Polynesian in origin), as well as this ancestral component along each chromosome ("local ancestry") and tested their respective association with binary and quantitative cardiometabolic traits. After attempting to adjust for non-genetic covariates evaluated through questionnaires, we found that per 10% increase in global Polynesian genetic ancestry, there is a respective 8.6%, and 11.0% increase in the odds of being diabetic (P = 1.65×10⁻⁴) and having heart failure (P = 2.18×10⁻⁴), as well as a 0.059 s.d. increase in BMI (P = 1.04×10⁻¹⁰). When testing the association of local Polynesian ancestry with risk of disease or biomarkers, we identified a chr6 region associated with T2D. This association was driven by an uniquely prevalent variant in Polynesian ancestry individuals. However, we could not replicate this finding in an independent Polynesian cohort from Samoa due to the small sample size of the replication cohort. In conclusion, we showed that Polynesian ancestry, which likely capture both genetic and lifestyle risk factors, is associated with an increased risk of obesity, Type-2 diabetes, and heart failure, and that larger cohorts of Polynesian ancestry individuals will be needed to replicate the putative association on chr6 with T2D.
Conflict of interest statement
The authors have declared that no competing interests exist.
Figures
References
-
- Hixson L, Hepler BB, Kim MO. The Native Hawaiian and Other Pacific Islander Population: 2010. 2010 Census Briefs. United States Census Bureau; 2012. Available from: https://www.census.gov/prod/cen2010/briefs/c2010br-12.pdf
-
- Pike MC, Kolonel LN, Henderson BE, Wilkens LR, Hankin JH, Feigelson HS, et al. Breast cancer in a multiethnic cohort in Hawaii and Los Angeles: risk factor-adjusted incidence in Japanese equals and in Hawaiians exceeds that in whites. Cancer Epidemiol Biomarkers Prev. 2002;11: 795–800. - PubMed
Publication types
MeSH terms
Grants and funding
LinkOut - more resources
Full Text Sources
Other Literature Sources
Medical
Miscellaneous
