

Prioritizing investments in rapid response vaccine technologies for emerging infections: A portfolio decision analysis
- PMID: 33571206
- PMCID: PMC7877621
- DOI: 10.1371/journal.pone.0246235
Prioritizing investments in rapid response vaccine technologies for emerging infections: A portfolio decision analysis
Abstract
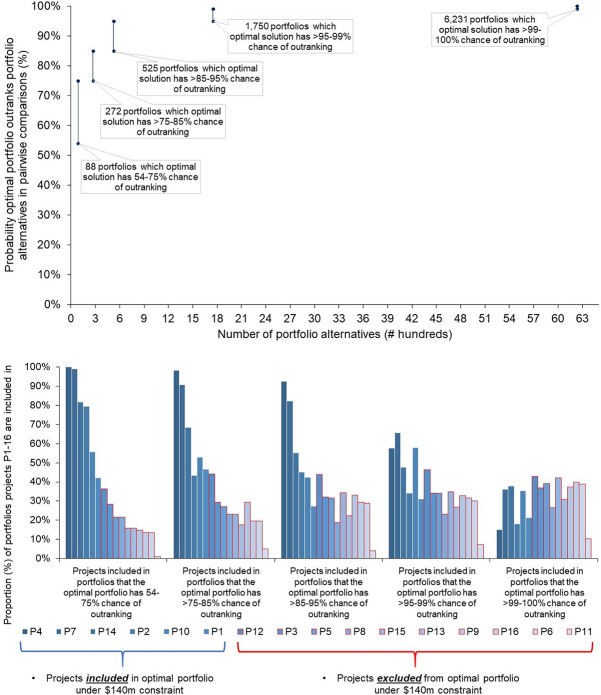
This study reports on the application of a Portfolio Decision Analysis (PDA) to support investment decisions of a non-profit funder of vaccine technology platform development for rapid response to emerging infections. A value framework was constructed via document reviews and stakeholder consultations. Probability of Success (PoS) data was obtained for 16 platform projects through expert assessments and stakeholder portfolio preferences via a Discrete Choice Experiment (DCE). The structure of preferences and the uncertainties in project PoS suggested a non-linear, stochastic value maximization problem. A simulation-optimization algorithm was employed, identifying optimal portfolios under different budget constraints. Stochastic dominance of the optimization solution was tested via mean-variance and mean-Gini statistics, and its robustness via rank probability analysis in a Monte Carlo simulation. Project PoS estimates were low and substantially overlapping. The DCE identified decreasing rates of return to investing in single platform types. Optimal portfolio solutions reflected this non-linearity of platform preferences along an efficiency frontier and diverged from a model simply ranking projects by PoS-to-Cost, despite significant revisions to project PoS estimates during the review process in relation to the conduct of the DCE. Large confidence intervals associated with optimization solutions suggested significant uncertainty in portfolio valuations. Mean-variance and Mean-Gini tests suggested optimal portfolios with higher expected values were also accompanied by higher risks of not achieving those values despite stochastic dominance of the optimal portfolio solution under the decision maker's budget constraint. This portfolio was also the highest ranked portfolio in the simulation; though having only a 54% probability of being preferred to the second-ranked portfolio. The analysis illustrates how optimization modelling can help health R&D decision makers identify optimal portfolios in the face of significant decision uncertainty involving portfolio trade-offs. However, in light of such extreme uncertainty, further due diligence and ongoing updating of performance is needed on highly risky projects as well as data on decision makers' portfolio risk attitude before PDA can conclude about optimal and robust solutions.
Conflict of interest statement
KM reports personal fees from CEPI, during the conduct of the study. KM is employed by a commercial company. DG reports grants from the Research Council of Norway, during the conduct of this study (ref. 234608). DG reports paid employment by CEPI, during the conduct of the study. Names of projects evaluated in this study are anonymized due to confidentiality restrictions by CEPI. These do not alter our adherence to PLOS ONE policies on sharing data and materials.
Figures


References
-
- CEPI. Coalition for Epidemic Preparedness Innovations preliminary business plan 2017–2021. 2016. [Cited 2019 16 December]. Available from: http://cepi.net/sites/default/files/CEPI%20Preliminary%20Business%20Plan....
-
- Gouglas D, Hoyt K, Peacocke E, Kaloudis A, Ottersen T, Røttingen JA. Setting Strategic Objectives for the Coalition of Epidemic Preparedness Innovations: An Exploratory Decision Analysis Process. INFORMS J. Appl. Anal. 2019;49(6):397–459. 10.1287/inte.2019.1011. - DOI
-
- CEPI. Platform technologies to enable rapid vaccine development for epidemic prone infections. [Cited 2019 16 December]. Available from: https://cepi.net/get_involved/cfps/.
Publication types
MeSH terms
Substances
LinkOut - more resources
Full Text Sources
Other Literature Sources
Medical
