

Genetic control of the human brain proteome
- PMID: 33571421
- PMCID: PMC8008492
- DOI: 10.1016/j.ajhg.2021.01.012
Genetic control of the human brain proteome
Abstract
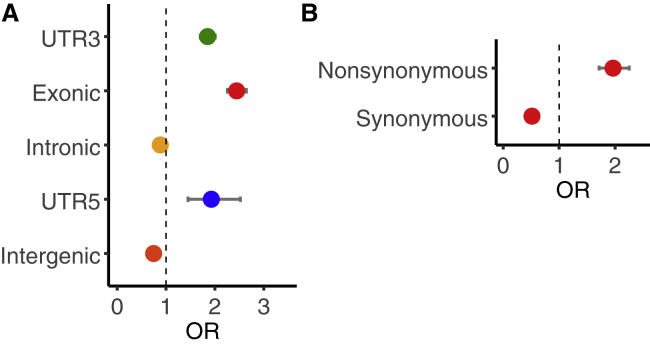
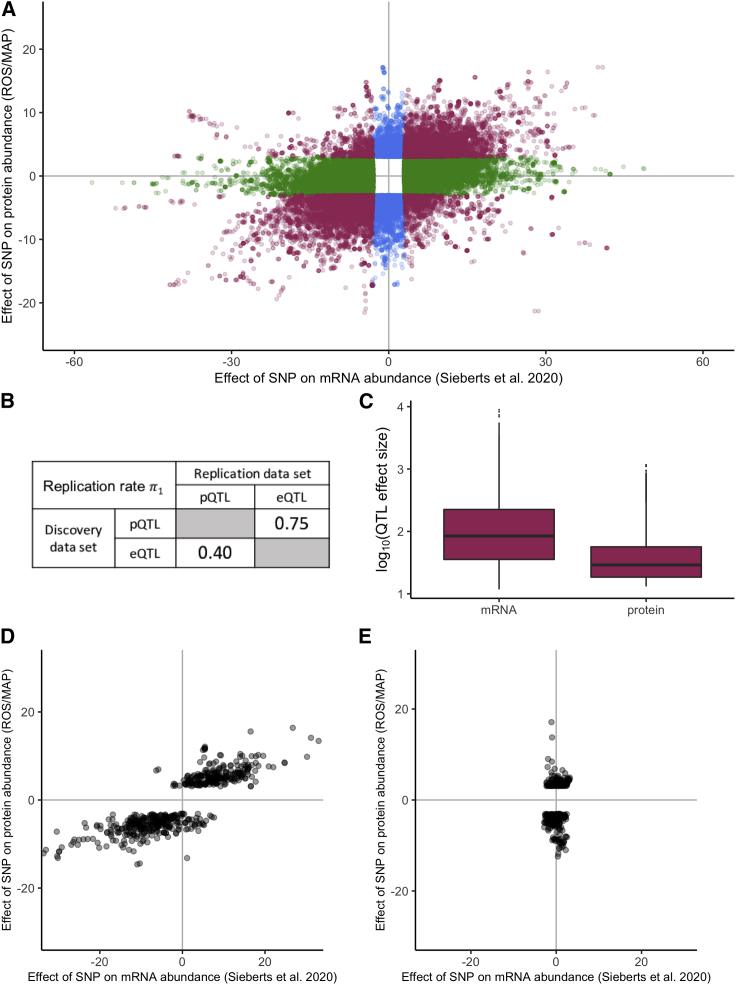
We generated an online brain pQTL resource for 7,376 proteins through the analysis of genetic and proteomic data derived from post-mortem samples of the dorsolateral prefrontal cortex of 330 older adults. The identified pQTLs tend to be non-synonymous variation, are over-represented among variants associated with brain diseases, and replicate well (77%) in an independent brain dataset. Comparison to a large study of brain eQTLs revealed that about 75% of pQTLs are also eQTLs. In contrast, about 40% of eQTLs were identified as pQTLs. These results are consistent with lower pQTL mapping power and greater evolutionary constraint on protein abundance. The latter is additionally supported by observations of pQTLs with large effects' tending to be rare, deleterious, and associated with proteins that have evidence for fewer protein-protein interactions. Mediation analyses using matched transcriptomic and proteomic data provided additional evidence that pQTL effects are often, but not always, mediated by mRNA. Specifically, we identified roughly 1.6 times more mRNA-mediated pQTLs than mRNA-independent pQTLs (550 versus 341). Our pQTL resource provides insight into the functional consequences of genetic variation in the human brain and a basis for novel investigations of genetics and disease.
Keywords: brain; eQTL; expression; gene regulation; pQTL; proteomics; quantitative trait locus.
Copyright © 2021 American Society of Human Genetics. All rights reserved.
Conflict of interest statement
C.R. is currently an employee of GlaxoSmithKline.
Figures
Similar articles
-
Identification and validation of genetic variants that influence transcription factor and cell signaling protein levels.Am J Hum Genet. 2014 Aug 7;95(2):194-208. doi: 10.1016/j.ajhg.2014.07.005. Epub 2014 Jul 31. Am J Hum Genet. 2014. PMID: 25087611 Free PMC article.
-
Common Genetic Polymorphisms Influence Blood Biomarker Measurements in COPD.PLoS Genet. 2016 Aug 17;12(8):e1006011. doi: 10.1371/journal.pgen.1006011. eCollection 2016 Aug. PLoS Genet. 2016. PMID: 27532455 Free PMC article.
-
Defining the consequences of genetic variation on a proteome-wide scale.Nature. 2016 Jun 23;534(7608):500-5. doi: 10.1038/nature18270. Epub 2016 Jun 15. Nature. 2016. PMID: 27309819 Free PMC article.
-
Proteomic studies related to genetic determinants of variability in protein concentrations.J Proteome Res. 2014 Jan 3;13(1):5-14. doi: 10.1021/pr400765y. Epub 2013 Dec 4. J Proteome Res. 2014. PMID: 24237071 Review.
-
Proteome-wide Systems Genetics to Identify Functional Regulators of Complex Traits.Cell Syst. 2021 Jan 20;12(1):5-22. doi: 10.1016/j.cels.2020.10.005. Cell Syst. 2021. PMID: 33476553 Review.
Cited by
-
Potential drug targets for asthma identified in the plasma and brain through Mendelian randomization analysis.Front Immunol. 2023 Sep 21;14:1240517. doi: 10.3389/fimmu.2023.1240517. eCollection 2023. Front Immunol. 2023. PMID: 37809092 Free PMC article.
-
Investigating Post-translational Modifications in Neuropsychiatric Disease: The Next Frontier in Human Post-mortem Brain Research.Front Mol Neurosci. 2021 Jul 16;14:689495. doi: 10.3389/fnmol.2021.689495. eCollection 2021. Front Mol Neurosci. 2021. PMID: 34335181 Free PMC article. Review.
-
Quantitative proteomics of cerebrospinal fluid from African Americans and Caucasians reveals shared and divergent changes in Alzheimer's disease.Mol Neurodegener. 2023 Jul 19;18(1):48. doi: 10.1186/s13024-023-00638-z. Mol Neurodegener. 2023. PMID: 37468915 Free PMC article.
-
Genetic control of body weight by the human brain proteome.iScience. 2023 Mar 11;26(4):106376. doi: 10.1016/j.isci.2023.106376. eCollection 2023 Apr 21. iScience. 2023. PMID: 37013190 Free PMC article.
-
Integrating multi-omics summary data using a Mendelian randomization framework.Brief Bioinform. 2022 Nov 19;23(6):bbac376. doi: 10.1093/bib/bbac376. Brief Bioinform. 2022. PMID: 36094096 Free PMC article.
References
-
- Zhu Z., Zhang F., Hu H., Bakshi A., Robinson M.R., Powell J.E., Montgomery G.W., Goddard M.E., Wray N.R., Visscher P.M., Yang J. Integration of summary data from GWAS and eQTL studies predicts complex trait gene targets. Nat. Genet. 2016;48:481–487. - PubMed
-
- Battle A., Brown C.D., Engelhardt B.E., Montgomery S.B., GTEx Consortium. Laboratory, Data Analysis &Coordinating Center (LDACC)—Analysis Working Group. Statistical Methods groups—Analysis Working Group. Enhancing GTEx (eGTEx) groups. NIH Common Fund. NIH/NCI Genetic effects on gene expression across human tissues. Nature. 2017;550:204–213. - PMC - PubMed
Publication types
MeSH terms
Substances
Grants and funding
- U01 AG046152/AG/NIA NIH HHS/United States
- U01 MH115484/MH/NIMH NIH HHS/United States
- R56 AG062633/AG/NIA NIH HHS/United States
- U01 AG061357/AG/NIA NIH HHS/United States
- T32 NS007480/NS/NINDS NIH HHS/United States
- RF1 AG051633/AG/NIA NIH HHS/United States
- U24 NS072026/NS/NINDS NIH HHS/United States
- P30 AG019610/AG/NIA NIH HHS/United States
- U01 AG057195/AG/NIA NIH HHS/United States
- P30 AG066511/AG/NIA NIH HHS/United States
- U01 AG061356/AG/NIA NIH HHS/United States
- U01 AG032984/AG/NIA NIH HHS/United States
- R01 AG056533/AG/NIA NIH HHS/United States
- R01 AG030146/AG/NIA NIH HHS/United States
- I01 BX003853/BX/BLRD VA/United States
- R56 AG062256/AG/NIA NIH HHS/United States
- R01 AG017917/AG/NIA NIH HHS/United States
- P30 AG072980/AG/NIA NIH HHS/United States
- R01 AG036042/AG/NIA NIH HHS/United States
- P30 AG010161/AG/NIA NIH HHS/United States
- R56 AG060757/AG/NIA NIH HHS/United States
- P50 AG025688/AG/NIA NIH HHS/United States
- R01 AG036836/AG/NIA NIH HHS/United States
- R01 AG015819/AG/NIA NIH HHS/United States
LinkOut - more resources
Full Text Sources
Other Literature Sources
