. 2021 Feb 18;184(4):969-982.e13.
doi: 10.1016/j.cell.2021.01.024. Epub 2021 Feb 10.

A role of PIEZO1 in iron metabolism in mice and humans

Affiliations

A role of PIEZO1 in iron metabolism in mice and humans

Shang Ma et al. Cell. .

Abstract

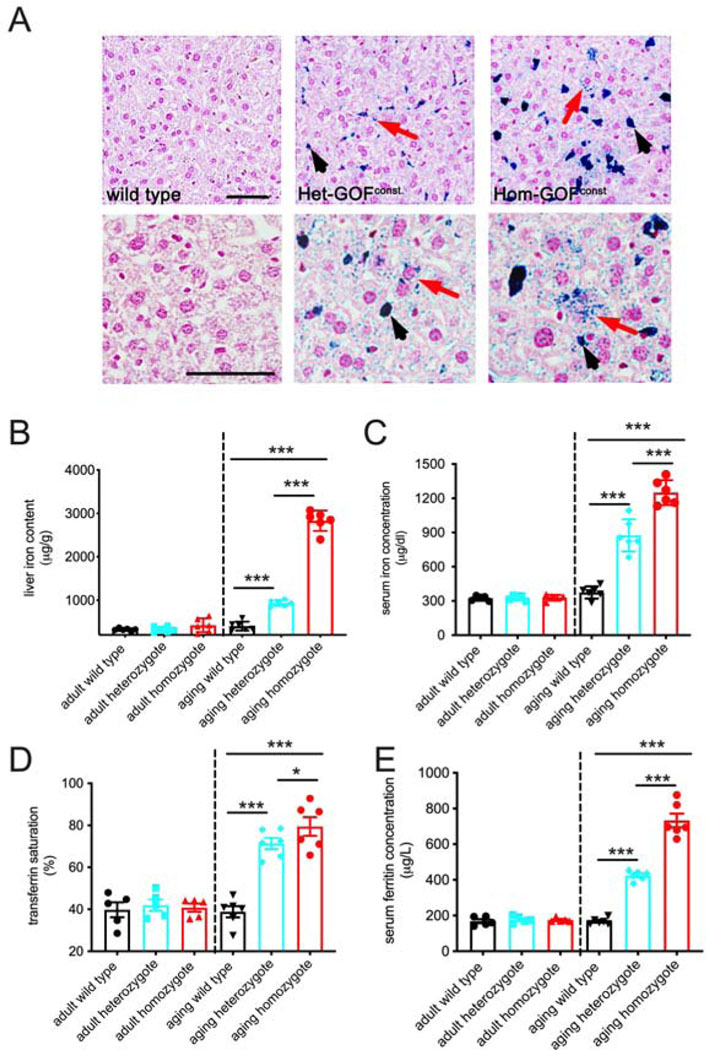
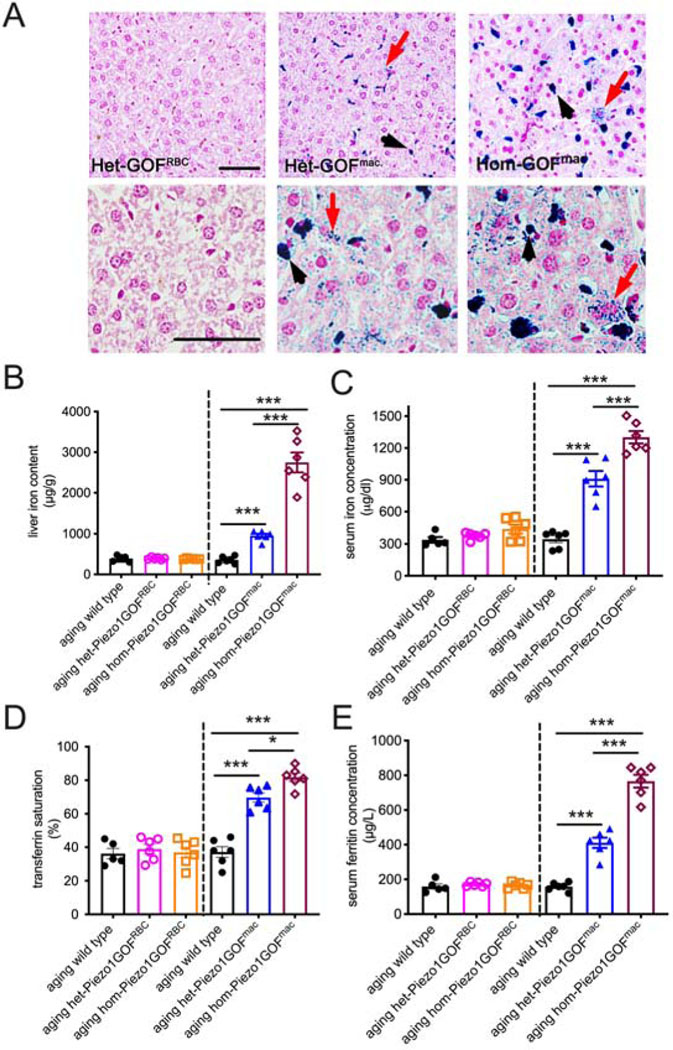
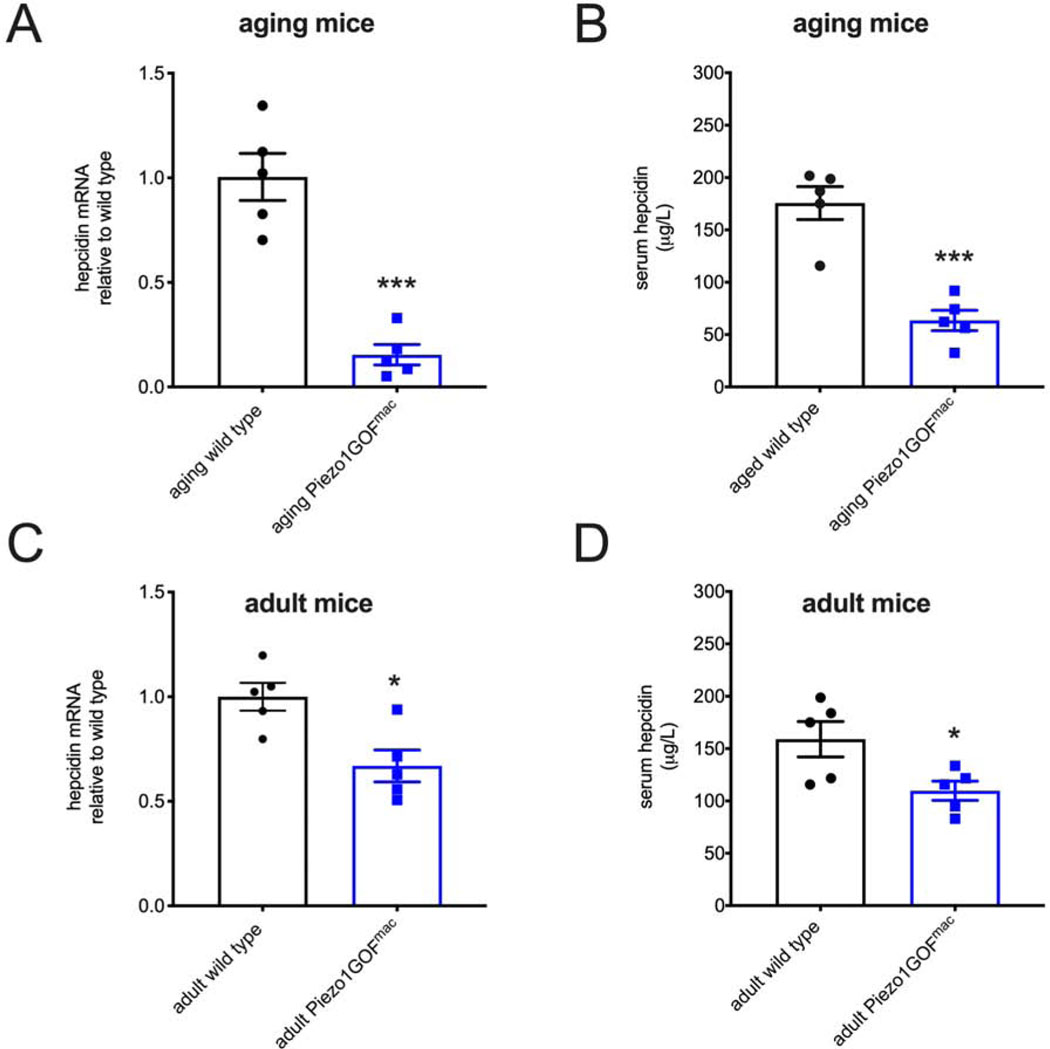
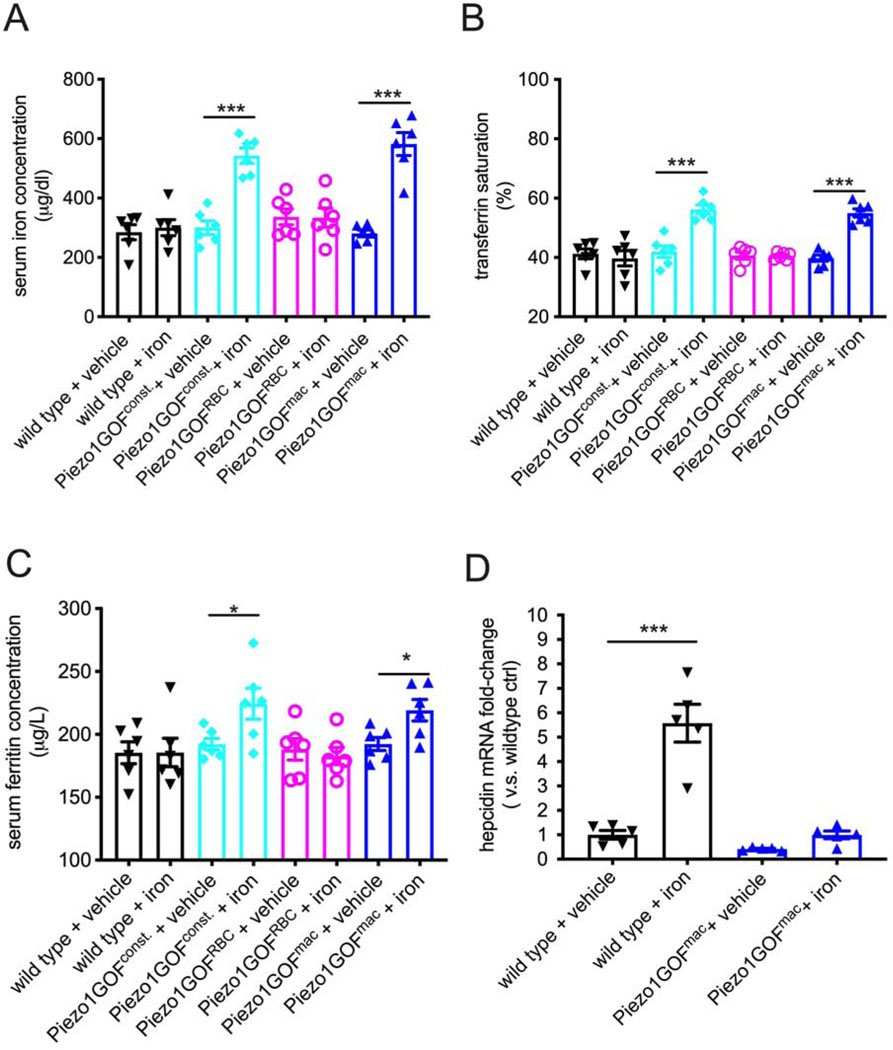
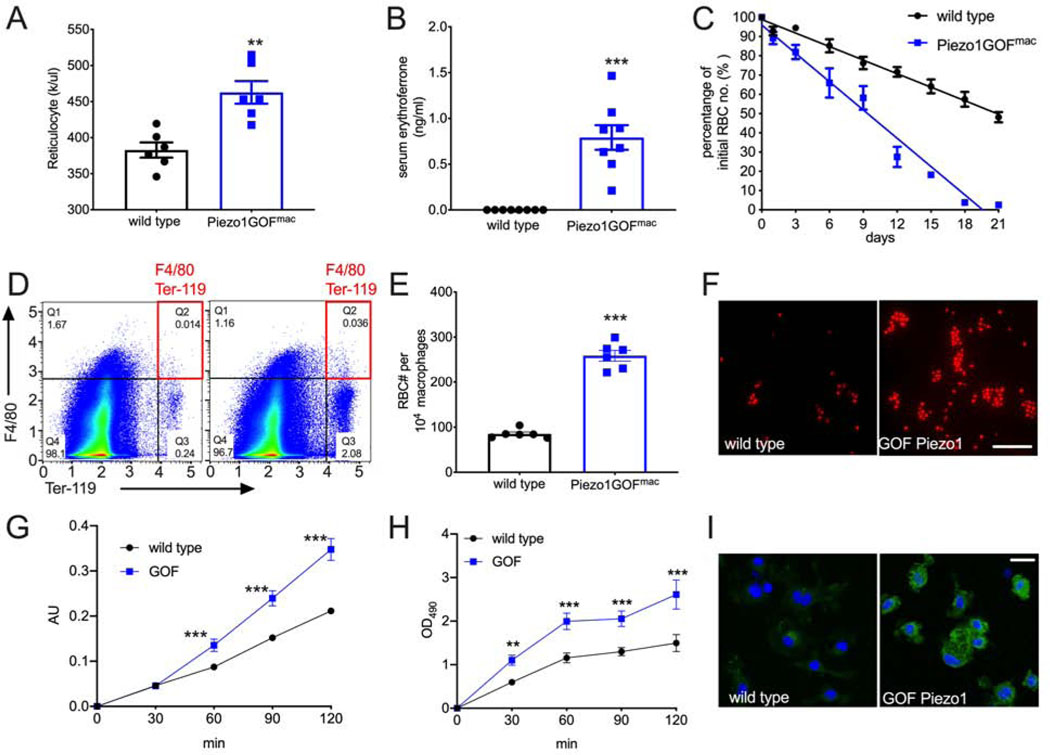
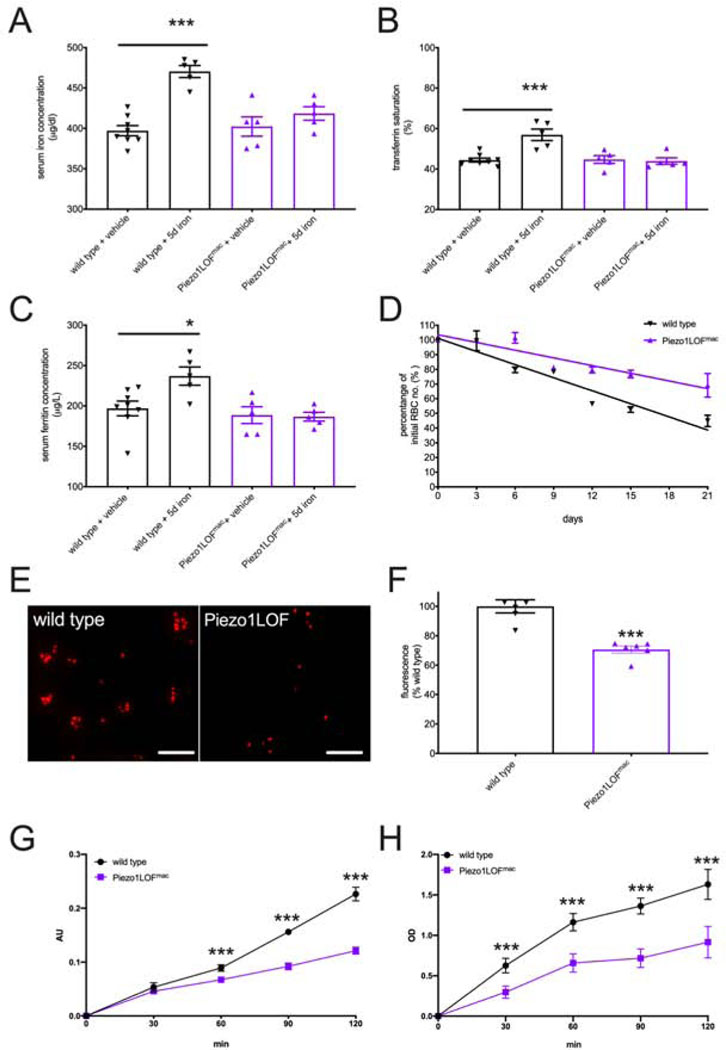
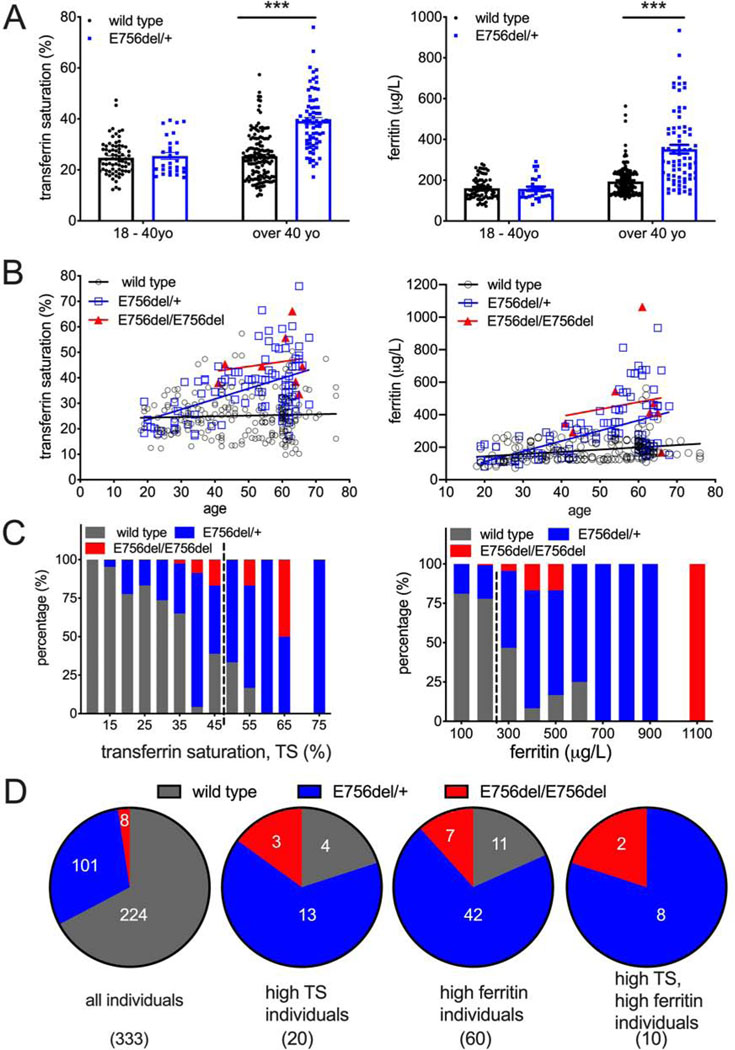
Iron overload causes progressive organ damage and is associated with arthritis, liver damage, and heart failure. Elevated iron levels are present in 1%-5% of individuals; however, iron overload is undermonitored and underdiagnosed. Genetic factors affecting iron homeostasis are emerging. Individuals with hereditary xerocytosis, a rare disorder with gain-of-function (GOF) mutations in mechanosensitive PIEZO1 ion channel, develop age-onset iron overload. We show that constitutive or macrophage expression of a GOF Piezo1 allele in mice disrupts levels of the iron regulator hepcidin and causes iron overload. We further show that PIEZO1 is a key regulator of macrophage phagocytic activity and subsequent erythrocyte turnover. Strikingly, we find that E756del, a mild GOF PIEZO1 allele present in one-third of individuals of African descent, is strongly associated with increased plasma iron. Our study links macrophage mechanotransduction to iron metabolism and identifies a genetic risk factor for increased iron levels in African Americans.

Keywords: African American; Ion channel; PIEZO1; erythropoiesis; human genetics; iron metabolism; macrophage; mechanotransduction; phagocytosis.


Conflict of interest statement

Declaration of interests The authors declare no competing interests.

Figures

Figure 1.
Figure 1.
Gain-of-function (GOF) Piezo1 mice develop late-onset iron overload. A. Perls Prussian blue staining in 10μm paraffin sections of livers from aging wild-type and constitutive GOF Piezo1 mice (higher magnification examples shown in lower panels). Blue color represents iron staining in hepatocytes (red arrow) and Kupffer cells (black arrowhead). Note more iron staining in homozygotes compared to heterozygotes. (Hematoxylin and eosin (H&E) staining used as background. Het: heterozygote; Hom: homozygote) Constitutive GOF mice were generated by breeding GOF mice with animals expressing a ubiquitous Cre driver (CMV-Cre). Scale bars: 50 μm. B. Enzymatic-based iron content measurement in liver extracts from both adult and aging animals with genotypes described in A. C. Serum iron concentration measurement (same method as B) in animals described in B. D. Transferrin saturation measurement in animals described in B. E. Enzyme-linked immunosorbent assay (ELISA) of serum ferritin concentration in animals described in B. (One way ANOVA test, *p < 0.05, **p < 0.01, ***p < 0.001. Each data point represents a single animal. Data presented as mean +SEM.)
Figure 2.
Figure 2.
GOF PIEZO1 expression in macrophages causes iron overload. A. Perls Prussian blue staining in 10 μm paraffin sections of livers from aging RBC- and macrophage-specific GOF Piezo1 mice (higher magnification examples shown in lower panels). Blue color represents iron in hepatocytes (red arrow) and Kupffer cells (black arrowhead). Note more iron staining in macrophage-specific GOF homozygotes compared to heterozygotes. (H&E staining used as background.Hom: homozygote; Het: heterozygote). These mice were generated by breeding conditional GOF alleles to LysM-cre for targeting macrophages and EpoR-Cre for RBCs. Scale bars: 50 μm. B. Enzymatic-based iron measurement in liver extracts from aging wild type and transgenic animals described in A. C. Serum iron concentration measurement in animals described in B. D. Transferrin saturation measurement in animals described in B. E. Enzyme-linked immunosorbent assay (ELISA) of serum ferritin concentration in animals described in B. (One way ANOVA test, *p < 0.05, **p < 0.01, ***p < 0.001. Each data point represents a single animal. Data presented as mean +SEM.)
Figure 3.
Figure 3.
Hepcidin levels are reduced in macrophage-specific GOF Piezo1 mice. A. Real-time RT-PCR analysis of liver expression of hepcidin mRNA from aging wild type and macrophage-specific GOF Piezo1 mice (12 – 18 months old). B. Enzyme-linked immunosorbent assay (ELISA) of serum hepcidin protein levels from animals described in A. C. Real-time RT-PCR analysis of liver expression of hepcidin mRNA from adult wild type and macrophage-specific GOF Piezo1 mice (2 – 5 months old). D. ELISA of serum hepcidin protein levels from animals described in C. (Student’s t-tests, *p < 0.05, **p < 0.01, ***p < 0.001. Each data point represents a single animal. Data presented as mean +SEM)
Figure 4.
Figure 4.
Acute response to iron stress is compromised in macrophage-specific GOF Piezo1 mice. A. Serum iron levels in adult wild type, constitutive, RBC- and microphage-specific GOF Piezo1 mice 24 hours after a single-dose injection of iron dextran at 40 μg/gram body weight. B. Serum transferrin saturation as described in A. C. Serum ferritin concentration as described in A. D. Real-time RT-PCR analysis of liver expression of hepcidin mRNA as described in A. (Dextran solution used as a vehicle control, multiple t-test with adjusted p-value by Bonferroni correction, *p < 0.05, **p < 0.01, ***p < 0.001. Each data point represents a single animal. Data presented as mean +SEM) (all RBC- and macrophage-specific GOF Piezo1 mice are heterozygotes)
Figure 5.
Figure 5.
Gain-of-function PIEZO1 in macrophages enhances erythropoiesis, red blood cell (RBC) turnover and phagocytic activity. A. Reticulocyte count in whole blood. Unit: thousand per microliter B. ELISA of serum erythroferrone concentration. C. RBC turnover rate: pulse-chase experiment calculating percent fluorescent RBCs on a given day compared to number of fluorescent RBCs present initially on Day 1. The slope of linear best-fit curves represents RBC turnover rate. D. Flow cytometry analysis for hemophagocytosis. F4/80 (y-axis) and Ter-119 (x-axis) label macrophages and RBCs respectively (axis values in log scale). Window Q2 have F4/80+; Ter-119+ cell populations which represent macrophages with internalized RBCs. E. RBC numbers in splenic macrophages from D. F. Fluorescent zymosan particles in wild type and GOF Piezo1 macrophage culture. G. Phagocytosis assay with opsonized RBCs. Arbitrary unit (AU) in absorption measures the amount of internalized RBCs in macrophages. H. Rac1 activation assays during phagocytosis. OD values at 490nm represent active GTP-bound Rac1 levels in macrophage cell lysates. I. Immunocytochemistry for active Rac1 in macrophages. Active Rac1 protein level is detected by specific antibody (green) in macrophage cytoplasm 30 min after phagocytosis. (Student t-tests, *p < 0.05, **p < 0.01, ***p < 0.001. Each data point represents a single animal in A-G, and represents a single cell in H and I. Data presented as mean +SEM, scale bar: 20μm)
Figure 6.
Figure 6.
PIEZO1 in macrophages is required for normal response to iron stress and phagocytosis. A. Serum iron levels in adult wild type and macrophage-specific LOF Piezo1 mice after daily injection of iron dextran at 80μg/gram body weight for 5 consecutive days. B. Serum transferrin saturation as described in A. C. Serum ferritin concentration as described in A. D. RBC turnover rate in vivo measurement in 21 days for animals described in A (see Figure S4A). E. In vitro phagocytosis assay: fluorescent zymosan particles in wild type and LOF Piezo1 macrophage culture (See Figure S4B). Scale bar: 20μm. F. Fluorescence intensity quantification of E (normalized to cell number). G. Phagocytosis assay with opsonized RBCs and bone marrow derived macrophages. Arbitrary unit (AU) in absorption measures the amount of internalized RBCs in macrophages. H. Rac1 activation assays during phagocytosis. OD values at 490nm represent active GTP-bound Rac1 levels in macrophage cell lysates. (Dextran solution used as vehicle control, multiple t-test with adjusted p-value by Bonferroni correction, *p < 0.05, **p < 0.01, ***p < 0.001. Each data point represents a single animal in A-G, and represents a single cell in H. Data presented as mean +SEM)
Figure 7.
Figure 7.
E756del gain-of-function PIEZO1 allele is associated with higher serum iron levels in an African American cohort. A. Serum iron measurements in heterozygous PIEZO1 E756del allele carriers and wild type of different age groups from a cohort of 333 African American individuals. Left: transferrin saturation. Right: ferritin. B. Correlation between serum iron measurments and age in all three genotypes (wild type, E576del heterozygotes, and E576del homozygotes). Left: transferrin saturation. Right: ferritin. C. Percentage of individuals in each serum iron measurement range for all three genotypes. Left: transferrin saturation. Right: ferritin. Values on the right of dashed line are clinically considered as provisionally high. D. Frequency of genotypes in all individuals (left Pie chart) and individuals with provisionally high transferrin saturation (TS), ferritin, and both (Right three Pie charts). Actual number of individuals written in the chart. (Student t-test, *p < 0.05, **p < 0.01, ***p < 0.001. Each data point represents a single human sample. Data presented as mean +SEM)

Comment in

Similar articles

Cited by

References

    1. Adams PC, Reboussin DM, Barton JC, McLaren CE, Eckfeldt JH, McLaren GD, Dawkins FW, Acton RT, Harris EL, Gordeuk VR, et al. (2005). Hemochromatosis and iron-overload screening in a racially diverse population. N. Engl. J. Med 352, 1769–1778. - PubMed
    1. Albuisson J, Murthy SE, Bandell M, Coste B, Louis-Dit-Picard H, Mathur J, Fénéant-Thibault M, Tertian G, de Jaureguiberry J-P, Syfuss P-Y, et al. (2013). Dehydrated hereditary stomatocytosis linked to gain-of-function mutations in mechanically activated PIEZO1 ion channels. Nat Commun 4, 1884. - PMC - PubMed
    1. Andolfo I, Rosato BE, Manna F, De Rosa G, Marra R, Gambale A, Girelli D, Russo R, and Iolascon A (2020). Gain‐of‐function mutations in PIEZO1 directly impair hepatic iron metabolism via the inhibition of the BMP/SMADs pathway. Am J Hematol 95, 188–197. - PubMed
    1. Andrews NC, and Ganz T (2019). The molecular basis of iron metabolism. In Molecular Hematology 4e, Provan D, and Gribben J, eds. (Wiley; ), pp. 161–172.
    1. Aykut B, Chen R, Kim JI, Wu D, Shadaloey SAA, Abengozar R, Preiss P, Saxena A, Pushalkar S, Leinwand J, et al. (2020). Targeting Piezo1 unleashes innate immunity against cancer and infectious disease. Sci. Immunol 5, eabb5168. - PubMed

Publication types

MeSH terms

LinkOut - more resources