. 2021 Feb 18;184(4):931-942.e18.
doi: 10.1016/j.cell.2021.01.027. Epub 2021 Feb 10.

Structural insights into the human D1 and D2 dopamine receptor signaling complexes

Affiliations

Structural insights into the human D1 and D2 dopamine receptor signaling complexes

Youwen Zhuang et al. Cell. .

Abstract

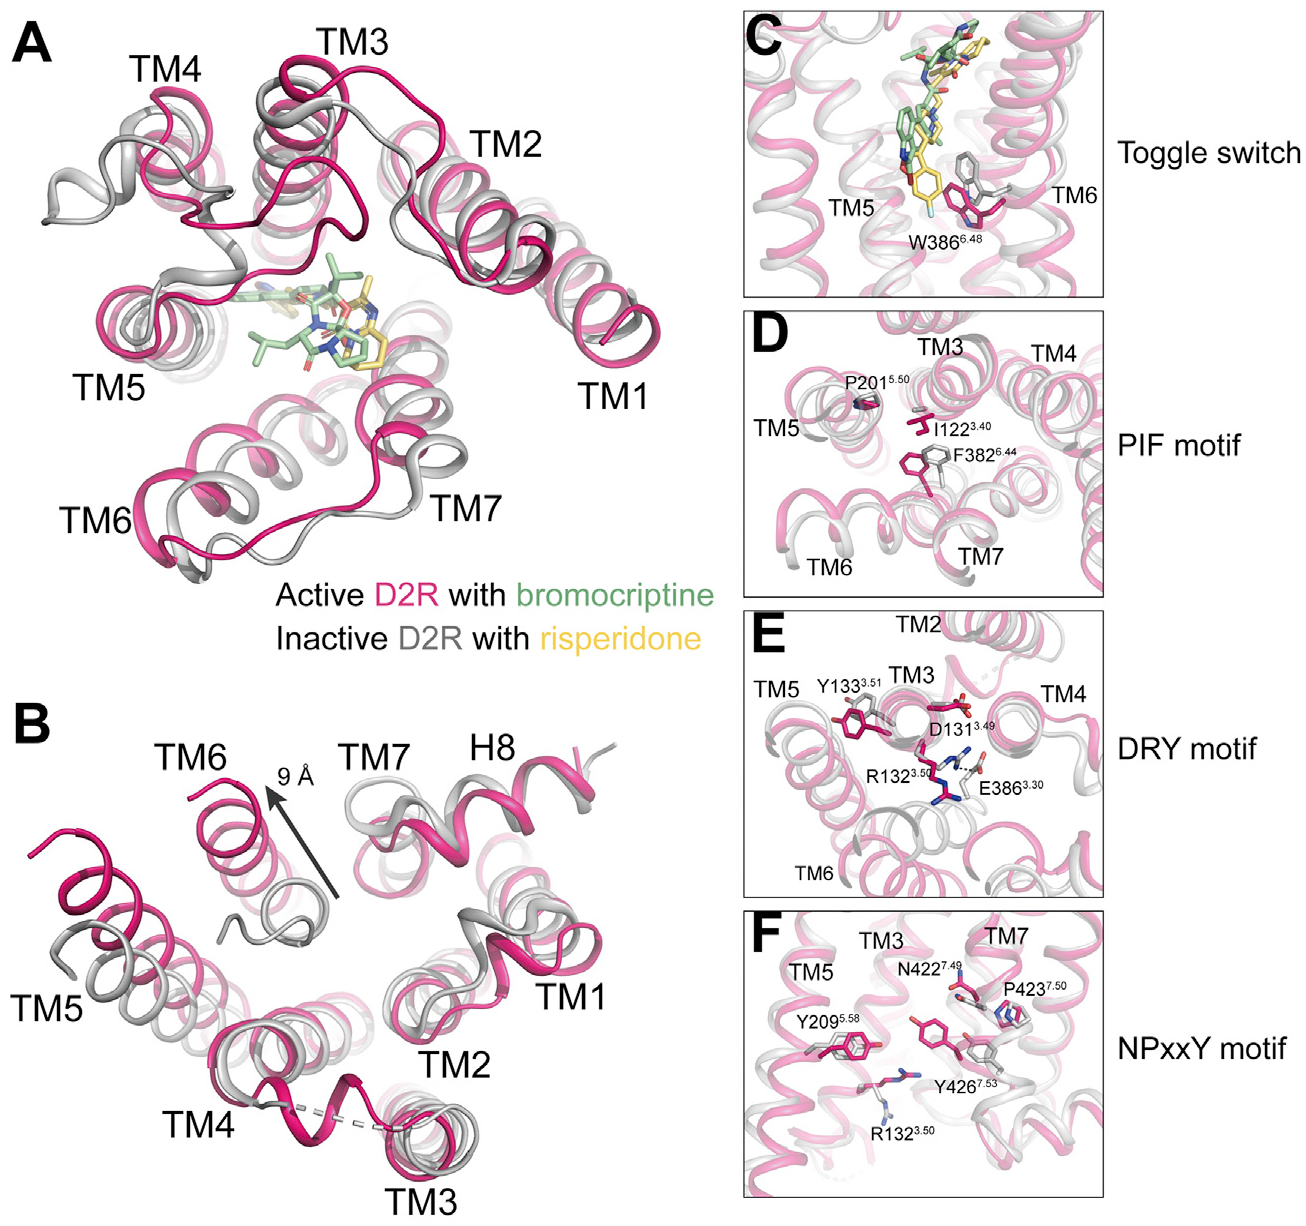
The D1- and D2-dopamine receptors (D1R and D2R), which signal through Gs and Gi, respectively, represent the principal stimulatory and inhibitory dopamine receptors in the central nervous system. D1R and D2R also represent the main therapeutic targets for Parkinson's disease, schizophrenia, and many other neuropsychiatric disorders, and insight into their signaling is essential for understanding both therapeutic and side effects of dopaminergic drugs. Here, we report four cryoelectron microscopy (cryo-EM) structures of D1R-Gs and D2R-Gi signaling complexes with selective and non-selective dopamine agonists, including two currently used anti-Parkinson's disease drugs, apomorphine and bromocriptine. These structures, together with mutagenesis studies, reveal the conserved binding mode of dopamine agonists, the unique pocket topology underlying ligand selectivity, the conformational changes in receptor activation, and potential structural determinants for G protein-coupling selectivity. These results provide both a molecular understanding of dopamine signaling and multiple structural templates for drug design targeting the dopaminergic system.

Keywords: D1R; D2R; G protein selectivity; Parkinson’s disease; apomorphine; bromocriptine; cryo-EM; dopamine receptors; ligand selectivity; receptor activation.


Conflict of interest statement

Declaration of interests The authors declare no competing interests.

Figures

Figure 1.
Figure 1.. Overall structures of D1R and D2R signaling complexes
(A) Dopamine signaling through D1-like and D2-like dopamine receptors. (B) Structures of the D1R-Gs with SKF83959 and SKF81297 and the D1R-miniGs with apomorphine. The receptor is colored slate, cyan, and pink, respectively. See Figure S2 and Table S1. (C) Alignment of three structures of D1R signaling complexes shown in (B). (D) Structure of the D2R-Gi with bromocriptine. The D2R is colored hot pink. See Figure S2 and Table S1. See also Figures S1, S3, and S4.
Figure 2.
Figure 2.. Structure comparison of bromocriptine-D2R-Gi complexes
(A) Alignment of the structure of bromocriptine-D2R-Gi complex reported by us and the structure of thermostabilized D2R complexed with Gi and bromocriptine in nanodiscs reported previously (PDB: 6VMS). The receptor and Gi protein are colored hot pink and pale cyan, respectively, in our structure. The thermostabilized receptor and the ligand bromocriptine are colored light brown, and the Gi protein is colored light blue in the previously reported structure. Bromocriptine is colored light green in our structure. See Figure S5 for amino acid sequence alignment between WT D2R and thermostabilized D2R. (B–E) Structural differences of the two bromocriptine-D2R-Gi complexes in TM1 (B), TM6 (C), and ligand binding mode (D) of receptor part and Gαi of G protein part (E).
Figure 3.
Figure 3.. Agonists recognition at D1R
(A–C) Interactions between SKF81297 (orange), SKF83959 (yellow), and apomorphine (purple) with D1R. The receptor is colored slate, cyan, and pink, respectively. (D–F) Comparisons of binding poses between SKF81297 and SKF83959 (D), SKF81297 and apomorphine (E), and SKF83959 and apomorphine (F) when aligned in D1R receptor part. Hydrogen bonds are shown as black dash lines. (G) Gs-cAMP accumulation results of WT D1R and D1R mutants activated by SKF81297, SKF83959, and apomorphine, respectively. Activities of the three agonists are identified as pEC50. ND, not detected. Average Emax values were determined from “log(agonist) versus response-variable slope (four parameters)” function in GraphPad Prism 8.4 software (GraphPad Software Inc., San Diego, CA) and were divided by 103 for display. All data are presented as mean values ± SEM with a minimum of four technical replicates and n = 3 biological replicates. See Figure S6 for dose response curves and Table S4 for fitted parameter values. See also Tables S2 and S3.
Figure 4.
Figure 4.. D1R activation
(A) Structural alignment of D1R-Gs bound to SKF81297 and β2AR-Gs bound to BI-167107 (PDB: 3SN6). The alignment was based on the structures of D1R and β2AR, which are colored slate and teal, respectively. (B) Structural comparison of the cytoplasmic regions of D1R and β2AR. (C) Alignment of TM5, TM6, and TM7 of D1R and β2AR. (D and E) Alignment of the D3.49R3.50Y3.51 motifs (D) and the P5.50I3.40F6.44 motifs (E) of D1R and β2AR. See also Figures S2 and S7 and Table S5.
Figure 5.
Figure 5.. D2R activation
(A and B) Structural comparison of the extracellular regions (A) and the cytoplasmic regions (B) of the active D2R (hot pink) with bromocriptine (light green) and the inactive D2R (light gray) with risperidone (light yellow) (PDB: 6CM4). (C–F) Different conformations of residues and motifs in the active D2R and the inactive D2R that are involved in receptor activation. See also Figures S2 and S4.
Figure 6.
Figure 6.. Differences of D1R and D2R in ligand-binding
(A) Structural comparison of the extracellular regions of D1R (slate) and D2R (hot pink). D1R and D2R agonists SKF81297 and bromocriptine are colored orange and light green, respectively. (B) Agonist-binding pockets of D1R and D2R viewed from the extracellular side. (C) Structural alignment of the agonist-binding pockets of D1R and D2R. The surface of ECL2 of D2R is shown in hot pink. (D) Binding poses of the D1R agonist SKF81297 and the D2R agonist bromocriptine. The orthosteric binding pocket (OBP) and the extended binding pocket (EBP) in the D2R for bromocriptine are circled. (E) Potential EBP in D1R. The residue K81 is shown in yellow. (F) Extracellular regions. Extracellular ends of TM1, TM6, and TM2 as well as ECL1 in D1R adopt different conformations compared to those in D2R. The narrow D1R ligand binding pocket resulted from the large inward movement of TM6 relative to D2R cause steric clash with bromocriptine. The steric clash regions are circled by dash line and marked with black star. Slate, D1R; hot pink, D2R; light green, bromocriptine. See also Figures S2, S3, S4, and S5B.
Figure 7.
Figure 7.. Differences of D1R and D2R G protein-coupling
(A) Structural comparison of the active D1R and D2R showing differences in TM3-ICL2-TM4, TM5, and TM6. (B) Surface maps of D1R-Gs and D2R-Gi. The extended binding region between D1R and TM5 is circled by dash line, such interaction is absent in D2R-Gi complex. Slate, SKF81297-D1R; hot pink, bromocriptine-D2R; green, Gαs; pale cyan, Gαi1; yellow orange, Gβ; light magentas, Gγ. (C) Interaction between D1R TM5 cytoplasmic end and Gs. The long extended TM5 cytoplasmic end of D1R adopts another binding interface with the Ras-like domain of Gs. Slate, D1R; hot pink, D2R; green, Gs; pale cyan, Gi. (D) Interaction interface of D1R with ICL2 region of Gαs. The corresponding region in D2R-Gi complex was aligned. The conformational changes of ICL2 region in D1R relative to D2R were marked with black arrows, compared to D2R, the one more helix turn extending of D1R ICL2 toward Gs hydrophobic pocket leads to stronger hydrophobic interaction between ICL2 and G protein, which is mainly mediated by F129 in ICL2 of D1R. Slate, SKF81297-D1R; green, Gαs; hot pink, bromocriptine-D2R; pale cyan, Gαi. The hydrogen bonds are shown in black dash line. (E) Structural comparison of the binding activities in D1R (slate) and D2R (hot pink) for the α5 helix of Gαs (green) and Gαi (pale cyan), respectively. (F) Different orientations of Gs (green) relative to D1R and Gi (pale cyan) relative to D2R. This is based on the alignment of the receptors. See also Figures S2, S3, and S4.

Comment in

Similar articles

Cited by

References

    1. Abi-Dargham A, Mawlawi O, Lombardo I, Gil R, Martinez D, Huang Y, Hwang DR, Keilp J, Kochan L, Van Heertum R, et al. (2002). Prefrontal dopamine D1 receptors and working memory in schizophrenia. J. Neurosci 22, 3708–3719. - PMC - PubMed
    1. Adams PD, Afonine PV, Bunkóczi G, Chen VB, Davis IW, Echols N, Headd JJ, Hung LW, Kapral GJ, Grosse-Kunstleve RW, et al. (2010). PHENIX: a comprehensive Python-based system for macromolecular structure solution. Acta Crystallogr. D Biol. Crystallogr 66, 213–221. - PMC - PubMed
    1. Andersen PH, and Jansen JA (1990). Dopamine receptor agonists: selectivity and dopamine D1 receptor efficacy. Eur. J. Pharmacol 188, 335–347. - PubMed
    1. Ballesteros JA, and Weinstein H (1995). Integrated methods for the construction of three-dimensional models and computational probing of structure-function relations in G protein-coupled receptors. In Methods in Neurosciences, Sealfon SC, ed. (Elsevier; ), pp. 366–428.
    1. Beaulieu JM, and Gainetdinov RR (2011). The physiology, signaling, and pharmacology of dopamine receptors. Pharmacol. Rev 63, 182–217. - PubMed

Publication types

MeSH terms

LinkOut - more resources