. 2021 Feb 18;184(4):943-956.e18.
doi: 10.1016/j.cell.2021.01.028. Epub 2021 Feb 10.

Ligand recognition and allosteric regulation of DRD1-Gs signaling complexes

Affiliations

Ligand recognition and allosteric regulation of DRD1-Gs signaling complexes

Peng Xiao et al. Cell. .

Abstract

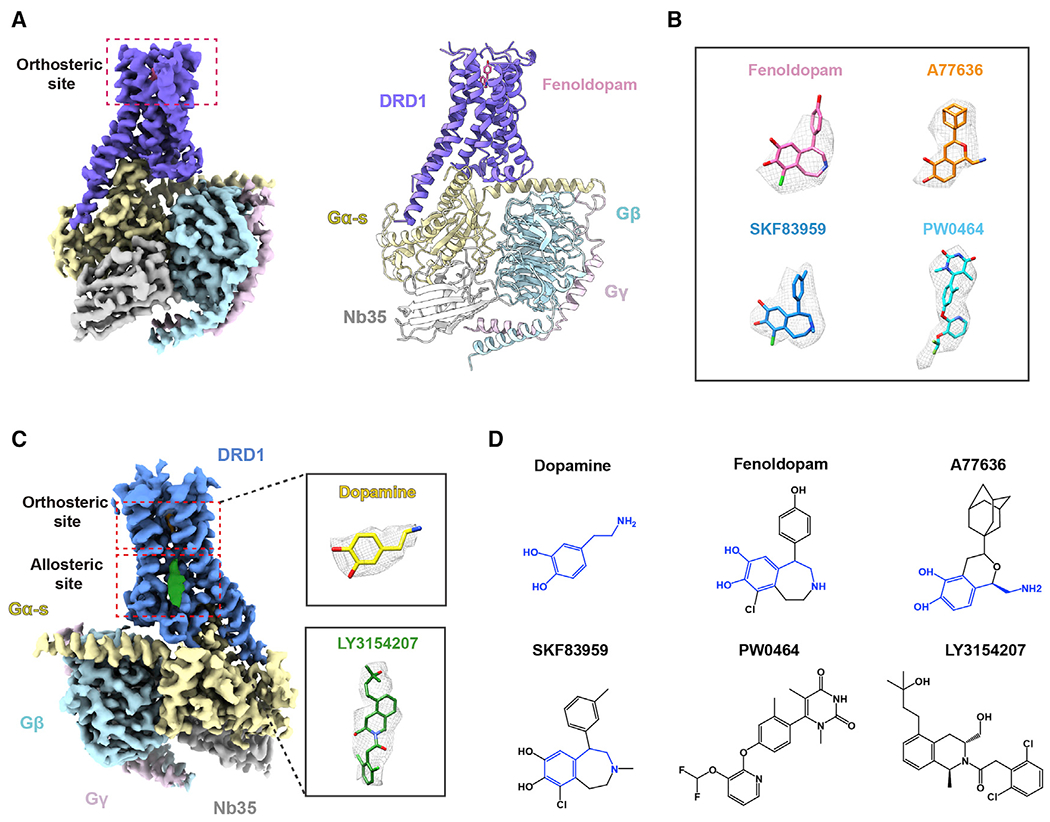
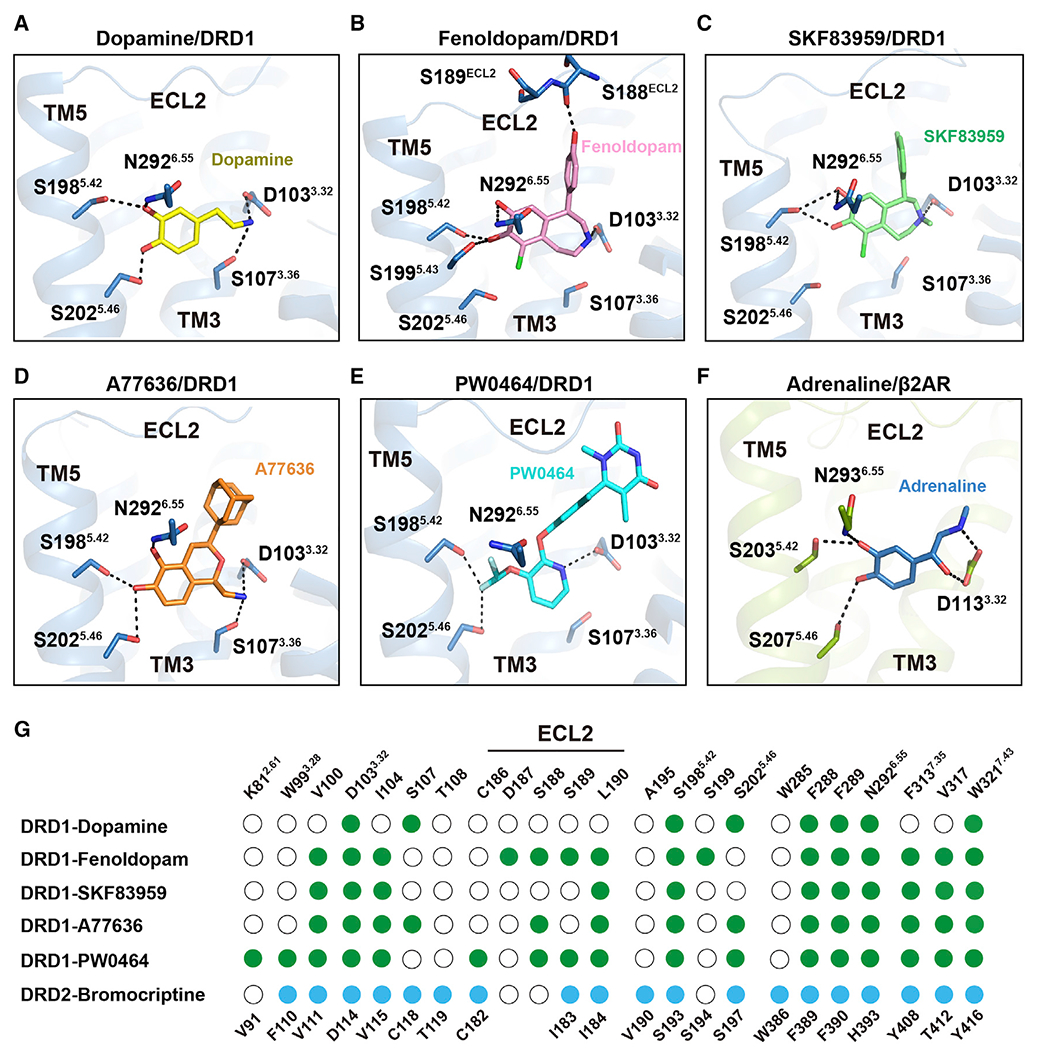
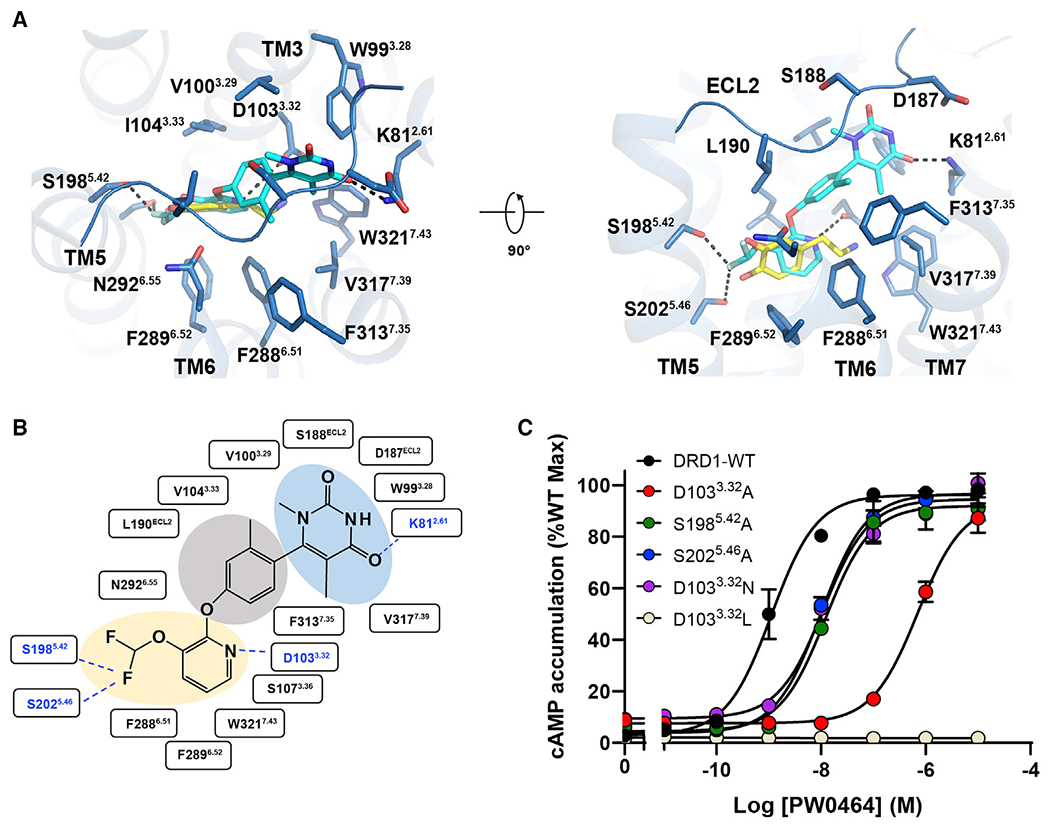
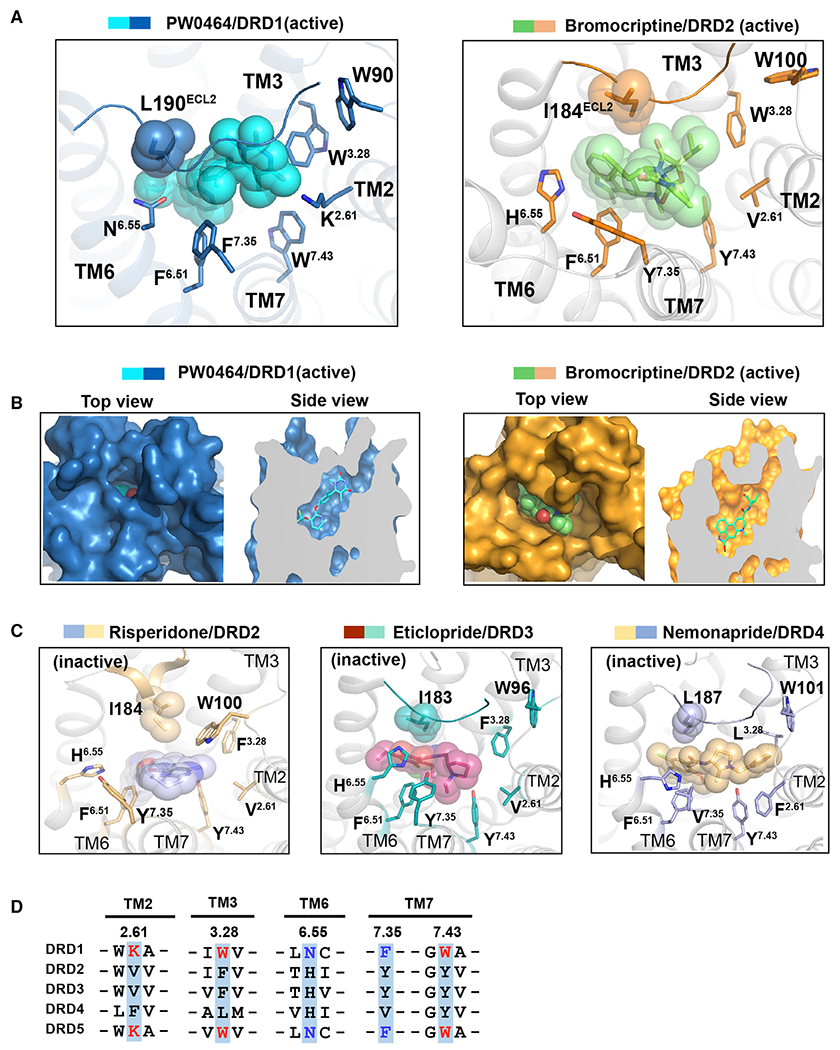
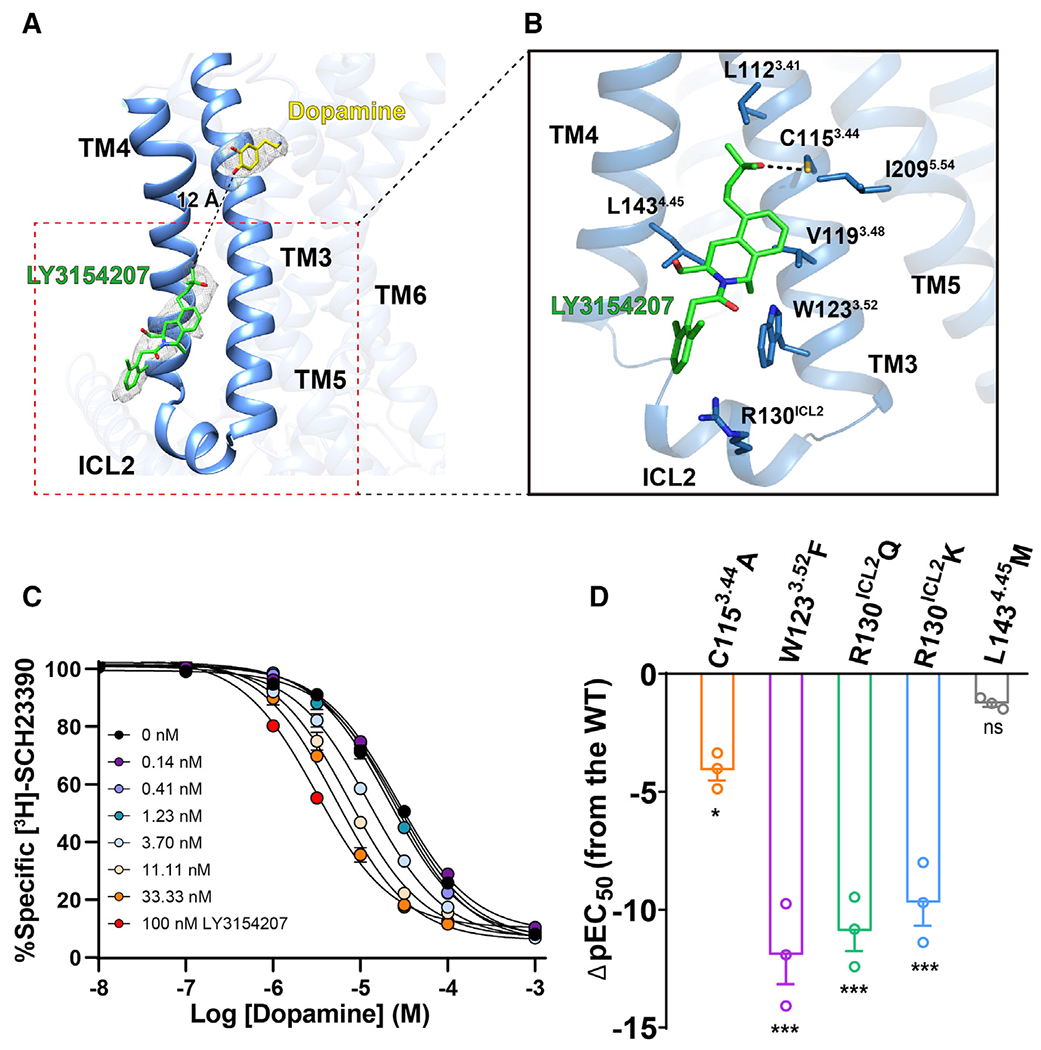
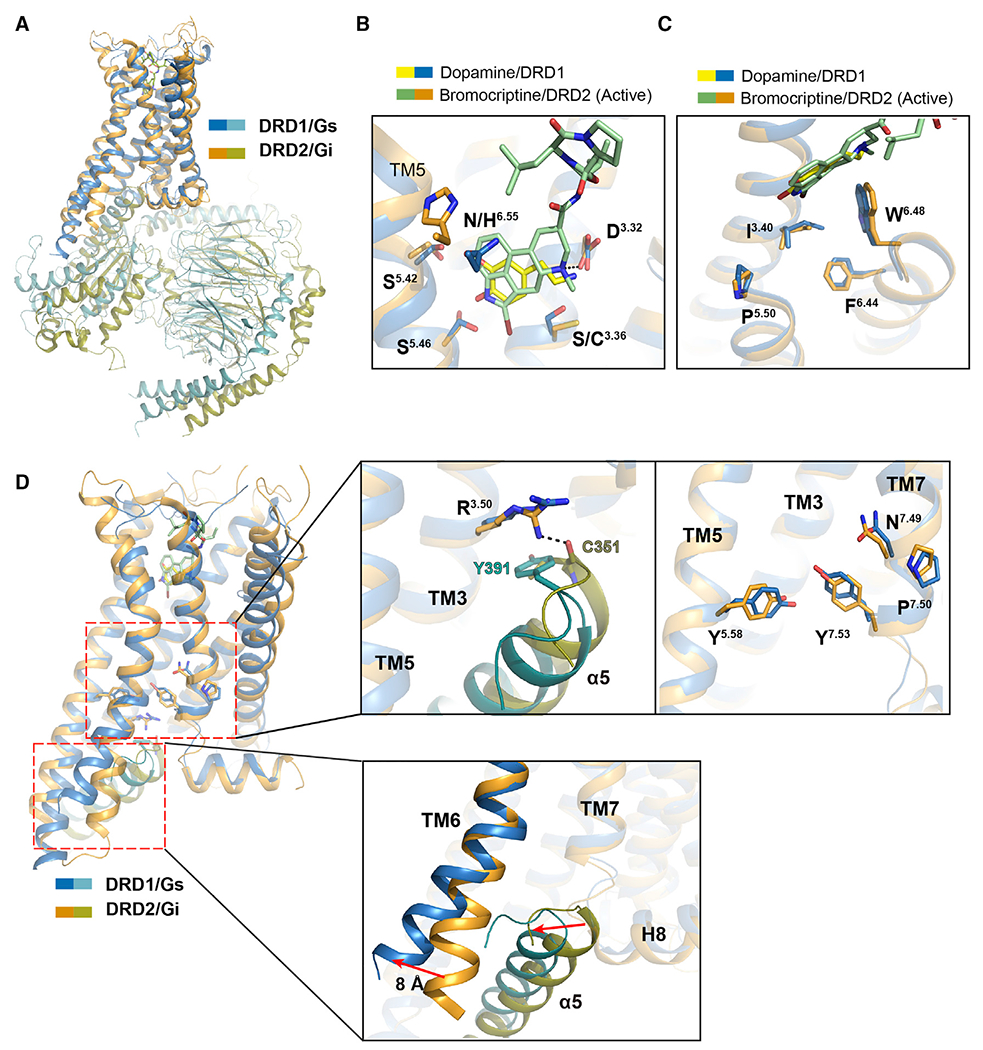
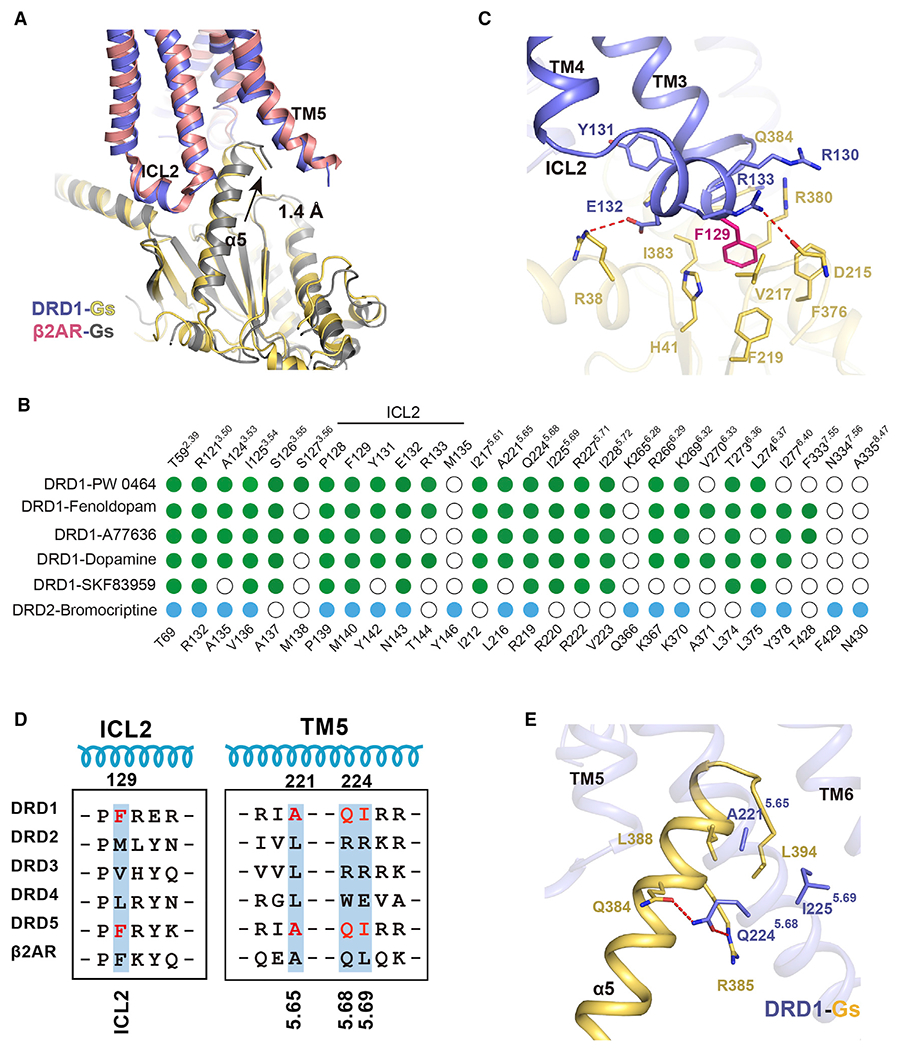
Dopamine receptors, including D1- and D2-like receptors, are important therapeutic targets in a variety of neurological syndromes, as well as cardiovascular and kidney diseases. Here, we present five cryoelectron microscopy (cryo-EM) structures of the dopamine D1 receptor (DRD1) coupled to Gs heterotrimer in complex with three catechol-based agonists, a non-catechol agonist, and a positive allosteric modulator for endogenous dopamine. These structures revealed that a polar interaction network is essential for catecholamine-like agonist recognition, whereas specific motifs in the extended binding pocket were responsible for discriminating D1- from D2-like receptors. Moreover, allosteric binding at a distinct inner surface pocket improved the activity of DRD1 by stabilizing endogenous dopamine interaction at the orthosteric site. DRD1-Gs interface revealed key features that serve as determinants for G protein coupling. Together, our study provides a structural understanding of the ligand recognition, allosteric regulation, and G protein coupling mechanisms of DRD1.

Keywords: DRD1-Gs complex; allosteric regulation; catecholamine; ccryo-EM; dopamine receptor; noncatechol; positive allosteric modulator; structure.


Conflict of interest statement

Declaration of interests The authors declare no competing interests.

Figures

Figure 1.
Figure 1.. Overall cryo-EM structures of the DRD1-Gs heterotrimer complexes
(A) The cryo-EM map (left) of the DRD1-Gs-Nb35 in complex with fenoldopam and the cartoon representations (right) of the complex structure are shown. Slate, DRD1; pink, fenoldopam; yellow, Gαs; cyan, Gβ; light pink, Gβ; and gray, Nb35. The cryo-EM density map colored according to different subunits is shown at 0.022 contour level. (B) The cryo-EM density of four ligands presented as gray meshes allowed unambiguous identification of fenoldopam (pink), A77636 (orange), SKF83959 (blue), and PW0464 (cyan). The density maps of the agonists are depicted at contour level of 0.022, except for that of SKF83959 at 0.9. (C) Cryo-EM map of the DRD1-Gs-Nb35 in complex with dopamine and positive allosteric modulator (PAM) LY3154207. The cryo-EM map contoured at the 0.022 level is colored according to different subunits. The densities of dopamine (yellow stick) and LY3154207 (green stick) are depicted as gray meshes shown in the inserted magnified panels. (D) Two-dimensional representation of chemical structures of dopamine, fenoldopam, synthetic agonist A77636, SKF83959, non-catechol agonist PW0464, and PAM LY3154207. The common catecholamine pharmacophore is highlighted in blue. See also Figure S1 and Table S1.
Figure 2.
Figure 2.. Polar network in the orthosteric binding pocket (OBP) of DRD1
(A) Detailed interactions of dopamine (yellow) with DRD1 (sky blue); the hydroxyl groups of dopamine form potential polar interactions with the side chains of S1985.42, S2025.46, and N2926.55, and the amine group of dopamine forms salt bridges and hydrogen bond with D1033.32 and S1073.36 in DRD1, respectively. Polar interactions are highlighted as black dashed lines. (B–E) Detailed interactions of fenoldopam (pink), SKF83959 (lime), A77636 (orange), and PW0464 (cyan) with DRD1 (sky blue). The polar interactions are indicated by black dashed lines. (F) Detailed interactions of adrenaline (sky blue) with β2AR (limon) (PDB: 4LDO). The polar interactions are shown as black dashed lines. (G) Comparison of agonist binding sites between DRD1 and DRD2. Residues in agonist-bound DRD1 or DRD2 that interact with ligands are indicated with green or blue dots, respectively. Residues that show no interaction with ligands are shown as white circles. Residue positions for DRD1 or DRD2 are indicated on the top or bottom of the scheme, respectively. Ballesteros-Weinstein numbers of D3.32-S5.42-S5.46, K2.61-W3.28-W7.43, or N6.55-F7.35 motif residues are shown as superscripts. See also Figures S2 and S3 and Tables S2, S3 and S5.
Figure 3.
Figure 3.. Non-catechol agonist PW0464 binding mode of DRD1
(A) Detailed interactions between PW0464 (cyan) and DRD1 (marine) shown in extracellular view (left panel) or side view (right panel). PW0464 occupies the same hydrophobic OBP as dopamine but exhibits a different binding mode. Polar interactions are highlighted with black dotted lines. The ligand PW0464 forms potential polar interactions with D3.32-S5.42-S5.46 motif via the pyridine nitrogen and difluoromethoxy group and retains the putative hydrogen bonding with N2926.55 and an additional direct interaction with K812.61. (B) Diagram of ligand interactions between DRD1 and PW0464. The difluoromethoxy, pyridine (orange shade), phenoxy (gray shade), and pyrimidinedione groups (sky blue shade) are highlighted. Polar interactions are shown by the blue dashed lines. (C) Effects of the D1033.32-S1985.42-S2025.46 mutants of DRD1 on PW0464-induced cAMP accumulation. See also Figure S4 and Table S4.
Figure 4.
Figure 4.. Comparison of extended binding pockets (EBPs) between DRD1 and D2-like receptors
(A) Structural comparison of the EBP in PW0464 (cyan)-bound DRD1 (sky blue) structure with that in bromocriptine (pale green)-bound DRD2 (orange) (PDB: 6VMS). The ligands PW0464 and bromocriptine are represented as sticks/spheres by corresponding colors, and the side chains of key residues of EBP are shown in sticks for both receptors. (B) Surface representation and cut away view of the ligand binding pocket for PW0464-bound DRD1 structure (left panel) and bromocriptine-bound DRD2 structure (right panel). The ligand PW0464 was covered by the ECL2 region of DRD1. (C) Structural representation of the EBPs in antagonist-bound D2-like receptors. Risperidone (blue sphere)-bound DRD2 (light orange) (left, PDB: 6CM4), eticlopride (warm pink sphere)-bound DRD3 (teal) (middle, PDB: 3PBL), and nemonapride (light orange sphere)-bound DRD4 (light blue) (right, PDB: 5WIU). (D) Sequence alignment of two critical motifs of EBP in five dopaminergic receptors located in TM2, TM3, TM6, and TM7. The K2.61-W3.28-W7.43 motifs of D1-like receptors are highlighted in red, whereas the N6.55-F7.35 pairs are highlighted in blue. See also Figure S5 and Table S2.
Figure 5.
Figure 5.. Binding of the PAM LY3154207 to DRD1
(A) Overall structure of DRD1 bound to dopamine (yellow stick) and LY3154207 (green stick). The structure reveals that an EM density (gray mesh, contoured at 0.022) corresponding to LY3154207 located at the membrane-embedded binding site was created by ICL2, TM3, and TM4, and the allosteric site in DRD1 is 12 Å away from the orthosteric site. (B) Contact residues in dopamine-LY3154207-DRD1-Gs complex (sticks with sky-blue carbons) within 4 Å of the LY3154207 (green). Polar interaction is highlighted as a black dotted line. (C) Competition binding curve of dopamine to wild-type (WT) DRD1 in the presence of different concentrations of LY3154207 (0.14–100 nM). LY3154207 enhanced the binding affinity of dopamine with DRD1. The Ki value (±SEM) of DRD1 for dopamine is 25.86 ± 1.9 μM, whereas the Ki value decreases to 3.16 ± 0.3 μM in the presence of 100 nM LY3154207. Data are presented as the mean ± SEM of three or more experiments run in triplicate. (D) Dopamine-induced cAMP accumulation assay in the presence of 100 nM LY3154207. Bars represent differences in calculated potency of dopamine (ρEC50 [half maximal effective concentration]) for each mutation relative to WT of DRD1. *p < 0.01, ***p < 0.0001 (one-way analysis of variance [ANOVA] followed by the Dunnett’s test, compared with the response of WT). See also Figure S6.
Figure 6.
Figure 6.. Structural features of active DRD1 compared with that of active DRD2 receptor
(A) Structural superposition of DRD1-Gs complex with DRD2-Gi complex when DRD1 and DRD2 were aligned. Sky blue, DRD1; teal, Gαs; orange, DRD2; and deep olive, Gi. (B) Comparison of the OBP of dopamine (yellow) and PAM-bound DRD1 (sky blue) with that of bromocriptine (pale green)-bound DRD2 (orange). The amine group of bromocriptine is observed to form a polar interaction with D3.32 in DRD2, and the key residues are shown as sticks with corresponding colors. (C) Structural comparison of the toggle switch W6.48 and P5.50-I3.40-F6.44 motif between DRD1 (sky blue) and DRD2 (orange). (D) Relative orientation of TM5, TM6, and TM7 in DRD1 (sky blue) with Gαs (teal) coupling compared with that in DRD2 (orange) with Gαi (deep olive) coupling. Notable differences are the conformations of the D-R3.50-Y motif, N-P7.50-xx-Y7.53 motif and Y5.58 residue in DRD1 and DRD2. The orientations of TM6 and C-terminal α5 in Gαs or Gαi are highlighted according to receptor alignment.
Figure 7.
Figure 7.. Comparison of receptor-G protein binding interface of DRD1-Gs complex with two previously determined class A GPCRs-Gs complexes (β2AR and A2AR) or DRD2-Gi complex
(A) Comparison of the interface of DRD1-Gs complex with that of β2AR-Gs complex when the TM3 helixes of DRD1 and DRD2 were aligned. (B) Comparison of residues between agonist-bound DRD1 or DRD2 that contact their corresponding downstream G protein subtypes, the Gαs or Gαi, respectively. Residues in DRD1 that contact with Gαs or DRD2 that interact with Gαi are depicted as green or blue dots, respectively. Residues that show no interaction with G proteins are indicated as white circles. Residue positions with Ballesteros-Weinstein numbers shown as superscripts for DRD1 or DRD2 are indicated on the top or bottom of the scheme, respectively. (C) Detailed interactions between ICL2 of DRD1 with Gαs. F129 (magenta stick) of DRD1 inserts into a hydrophobic pocket composed by Gαs. Additional polar interactions (highlighted by red dashed lines) strengthen the interaction between DRD1 and Gαs. (D) Sequence alignment of ICL2 and TM5 of five dopaminergic receptors and the β2AR. The residues of F129, A221, Q224, and I225 in DRD1 and the equivalent residues in DRD5 are highlighted in red. (E) Detailed interaction between α5 helix in Gαs (yellow) and DRD1 (blue). Polar interaction is highlighted in red dotted lines. The key A5.65xxQ5.68-I5.69 motif of DRD1 involved in G protein coupling is represented by the blue stick. See also Figure S7.

Comment in

Similar articles

Cited by

References

    1. Adams PD, Afonine PV, Bunkóczi G, Chen VB, Davis IW, Echols N, Headd JJ, Hung LW, Kapral GJ, Grosse-Kunstleve RW, et al. (2010). PHENIX: a comprehensive Python-based system for macromolecular structure solution. Acta Crystallogr. D Biol. Crystallogr 66, 213–221. - PMC - PubMed
    1. Beaulieu JM, and Gainetdinov RR (2011). The physiology, signaling, and pharmacology of dopamine receptors. Pharmacol. Rev 63, 182–217. - PubMed
    1. Betz R. (2018). Dabble 10.5281/zenodo.836914. - DOI
    1. Chien EY, Liu W, Zhao Q, Katritch V, Han GW, Hanson MA, Shi L, Newman AH, Javitch JA, Cherezov V, and Stevens RC (2010). Structure of the human dopamine D3 receptor in complex with a D2/D3 selective antagonist. Science 330, 1091–1095. - PMC - PubMed
    1. Conroy JL, Free RB, and Sibley DR (2015). Identification of G protein-biased agonists that fail to recruit β-arrestin or promote internalization of the D1 dopamine receptor. ACS Chem. Neurosci 6, 681–692. - PMC - PubMed

Publication types

MeSH terms