. 2021 Jun 3;28(6):1057-1073.e7.
doi: 10.1016/j.stem.2021.01.010. Epub 2021 Feb 10.

Loss of KDM4B exacerbates bone-fat imbalance and mesenchymal stromal cell exhaustion in skeletal aging

Affiliations

Loss of KDM4B exacerbates bone-fat imbalance and mesenchymal stromal cell exhaustion in skeletal aging

Peng Deng et al. Cell Stem Cell. .

Abstract

Skeletal aging is a complex process, characterized by a decrease in bone formation, an increase in marrow fat, and stem cell exhaustion. Loss of H3K9me3, a heterochromatin mark, has been proposed to be associated with aging. Here, we report that loss of KDM4B in mesenchymal stromal cells (MSCs) exacerbated skeletal aging and osteoporosis by reducing bone formation and increasing marrow adiposity via increasing H3K9me3. KDM4B epigenetically coordinated β-catenin/Smad1-mediated transcription by removing repressive H3K9me3. Importantly, KDM4B ablation impaired MSC self-renewal and promoted MSC exhaustion by inducing senescence-associated heterochromatin foci formation, providing a mechanistic explanation for stem cell exhaustion with aging. Moreover, while KDM4B was required for parathyroid hormone-mediated bone anabolism, KDM4B depletion accelerated bone loss and marrow adiposity induced by a high-fat diet. Our results suggest that the epigenetic rejuvenation and reversing bone-fat imbalance might be new strategies for preventing and treating skeletal aging and osteoporosis by activating KDM4B in MSCs.

Keywords: bone marrow adiposity; bone metabolism; mesenchymal stem cells; mesenchymal stromal cells; osteoporosis; parathyroid hormone; senescence-associated heterochromatin foci; skeletal aging; stem cell self-renewal.


Conflict of interest statement

Declaration of interests The authors declare no competing interests.

Figures
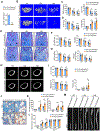
Figure 1.
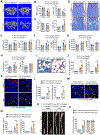
Figure 1.. Deletion of Kdm4b in mesenchymal cells using Prx1Cre exacerbates bone-fat imbalance in skeletal aging.
(A) Kdm4b mRNA in Sca1+CD29+CD45CD11b MSCs from 2-month-old Prx1Cre;Kdm4bw/w and Prx1Cre;Kdm4bf/f mice was assessed by qRT-PCR. n = 3. (B) Representative μCT images of femurs from Prx1Cre;Kdm4bw/w and Prx1Cre;Kdm4bf/f mice at 3-, 12- and 18-month-old. Scale bar, 0.4 mm. n = 16. (C) Quantitative measurements of BMD and BV/TV in Prx1Cre;Kdm4bw/w and Prx1Cre;Kdm4bf/f mice by μCT. n = 16. (D) Tb.N and Tb.Sp in Prx1Cre;Kdm4bw/w and Prx1Cre;Kdm4bf/f mice by μCT. n = 16. (E) Representative toluidine blue staining images of Prx1Cre;Kdm4bw/w and Prx1Cre;Kdm4bf/f mouse femurs. Blanks arrows indicate trabecular bones, and orange arrows indicate marrow adipose tissues. Scale bar, 0.4 mm. n = 16. (F) Ob.N/BS and Ob.S/BS in 3-, 12- and 18-month-old Prx1Cre;Kdm4bw/w and Prx1Cre;Kdm4bf/f mice. n = 16. (G) MAR and BFR as determined by dual labeling in Prx1Cre;Kdm4bw/wand Prx1Cre;Kdm4bf/f mice. n = 16. (H) Representative μCT images of femoral cortex from Prx1Cre;Kdm4bw/w and Prx1Cre;Kdm4bf/f mice at 3-,12- and 18-month-old. Scale bar, 0.6 mm. n = 16. (I) Quantitative measurements of cortical bone thickness (Cb.Th), cortex BMD (cBMD) and porosity by μCT. n = 16. (J and K) Immunostaining of FABP4 and quantitative measurements of adipocytes in Prx1Cre;Kdm4bw/w and Prx1Cre;Kdm4bf/f mice. Scale bar, 30 μm. n = 16. (L and M) μCT analysis of MAT in tibiae of Prx1Cre;Kdm4bw/w and Prx1Cre;Kdm4bf/f mice. Scale bar, 1 mm. n = 16. Data represent mean ± SD (error bars) from the pool of two independent experiments. The results were analyzed by two-way ANOVA with Holm-Sidak posthoc test except for (A) which was analyzed by Student’s t-test. *P < 0.05, **P < 0.01, between groups; #P < 0 .05; ##P < 0.01, age x genotype interaction. Also see Figure S1-S3
Figure 2.
Figure 2.. Deletion of Kdm4b in mesenchymal cells using Prx1Cre exacerbated bone-fat imbalance in OVX-induced osteoporosis.
(A) Representative μCT images of femurs from Prx1Cre;Kdm4bw/w and Prx1Cre;Kdm4bf/f mice following sham and OVX. Scale bar, 0.4 mm. n = 8. (B) Quantitative measurements of BMD and BV/TV in Prx1Cre;Kdm4bw/w and Prx1Cre;Kdm4bf/f mice following sham and OVX by μCT. n = 8. (C) Tb.N and Tb.Sp in Prx1Cre;Kdm4bw/w and Prx1Cre;Kdm4bf/f mice following sham and OVX by μCT. n = 8. (D) Representative toluidine blue staining images of Prx1Cre;Kdm4bw/w and Prx1Cre;Kdm4bf/f mouse femurs following sham and OVX. Scale bar, 0.4 mm. n = 8. (E) Ob.N/BS and Ob.S/BS in Prx1Cre;Kdm4bw/w and Prx1Cre;Kdm4bf/f mouse femurs following sham and OVX. n = 8. (F) MAR and BFR as determined by dual labeling in Prx1Cre;Kdm4bw/w and Prx1Cre;Kdm4bf/f mouse femurs following sham and OVX. n = 8. (G) Oc.N/BS and Oc.S/BS in Prx1Cre;Kdm4bw/w and Prx1Cre;Kdm4bf/f mouse femurs following sham and OVX. n = 8. (H) ELISA of serum P1NP and CTX in Prx1Cre;Kdm4bw/w and Prx1Cre;Kdm4bf/f mice following sham and OVX. n = 8. (I and J) Representative immunostaining of FABP4 in Prx1Cre;Kdm4bw/w and Prx1Cre;Kdm4bf/f mouse femurs following sham and OVX. Scale bar, 30 μm. n = 8. (K and L) Fat cell density and fat tissue fraction of FABP4-expressing tdTomato+ adipocytes in Prx1Cre;Kdm4bw/w;tdTomato and Prx1Cre;Kdm4bf/f;tdTomato mouse femurs following sham and OVX. Scale bar, 40 μm. n = 8. (M and N) Representative immunostaining image of FABP4-expressing tdTomato and tdTomato+ adipocytes in Prx1Cre/ERT2;Kdm4bw/w;tdTomato and Prx1Cre/ERT2;Kdm4bf/f;tdTomato mouse femurs following OVX, respectively. Scale bar, 40 μm. n = 6. (O and P) μCT analysis of MAT in tibiae of Prx1Cre/ERT2;Kdm4bw/w;tdTomato and Prx1Cre/ERT2;Kdm4bf/f;tdTomato mice following sham and OVX. Scale bar, 1 mm. n = 6. Data represent mean ± SD from the pool of two independent experiments. The results were analyzed by two-way ANOVA with Holm-Sidak posthoc test. *P < 0.05, **P < 0.01, between groups; #P < 0.05, ##P < 0.01 surgery x genotype interaction. Also see Figure S4 and S5
Figure 3.
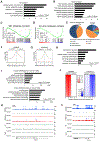
Figure 3.. KDM4B epigenetically controls Wnt/β-catenin- and BMP/Smad-mediated transcription by erasing H3K9me3 in mouse MSCs.
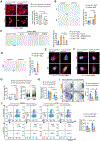
(A and B) GO (A) and KEGG (B) analysis of downregulated genes with Kdm4b deletion in MSCs. (C and D) GSEA shows a significant decrease of Wnt/β-catenin (C) and TGF-β (D) gene signatures in Kdm4b−/− MSCs, respectively. Black bars represent individual genes in rank order. NES, normalized enrichment score; FDR, false discovery rate. (E) Pie chart showing genome-wide binding profiles of KDM4B in mouse MSCs. (F and G) The average bindings of KDM4B (F) and levels of H3K9me3 (G) for all refseq gene promoters, spanning ± 2 kb of the closest transcription start sites (TSSs). Red line, Kdm4b+/+ MSCs; green line, Kdm4b−/− MSCs. (H) GO analysis of genes associated with KDM4B and over 2-fold H3K9me3 upregulation in Kdm4b−/− MSCs (±2kb of their TSSs). Bars represent −log10 of binomial raw p values. (I) GREAT analysis of the nearest genes whose TSSs are within ±2kb of the unique KDM4B peaks in Kdm4b+/+ MSCs (upper) and unique H3K9me3 peaks in Kdm4b−/− MSCs (lower). (J) Distribution of KDM4B and H3K9me3 at the ±5 kb regions centered at KDM4B peaks in Kdm4b+/+ and Kdm4b−/− MSCs (log2 scale). (K and L) Gene tracks showing KDM4B binding and H3K9me3 levels at the Runx2 (K) and Ccnd1 (L) in Kdm4b+/+ and Kdm4b−/− MSCs. Bars above the gene tracks shows the significant peaks identified by using MACS2. Also see Figure S6
Figure 4.
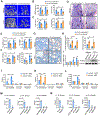
Figure 4.. KDM4B is required for PTH-mediated anabolic actions by controlling β-catenin/Smad1-mediated transcription.
(A) Representative μCT images of 12-month-old Prx1Cre;Kdm4bw/w and Prx1Cre;Kdm4bf/f mouse femurs following PTH treatment. Scale bar, 0.4 mm. n = 8. (B) Quantitative measurements of BMD and BV/TV in 12-month-old Prx1Cre;Kdm4bw/w and Prx1Cre;Kdm4bf/f mouse femurs following PTH treatment by μCT. n = 8. (C) Tb.N and Tb.Sp in Prx1Cre;Kdm4bw/w and Prx1Cre;Kdm4bf/f mice following PTH treatment by μCT. n = 8. (D) Representative H&E staining of Prx1Cre;Kdm4bw/w and Prx1Cre;Kdm4bf/f mouse femurs following PTH treatment. Blanks arrows indicate trabecular bones, and orange arrows indicate marrow adipose tissues. Scale bar, 0.4 mm. n = 8. (E) Ob.N/BS and Ob.S/BS in Prx1Cre;Kdm4bw/w and Prx1Cre;Kdm4bf/f mouse femurs following PTH treatment. n = 8. (F) MAR and BFR as determined by dual labeling in Prx1Cre;Kdm4bw/w and Prx1Cre;Kdm4bf/f mouse femurs following PTH treatment. n = 8. (G) Representative immunostaining of FABP4 in Prx1Cre;Kdm4bw/w and Prx1Cre;Kdm4bf/f mouse femurs following PTH treatment. Scale bar, 40 μm. n = 8. (H) Fat cell density and fat tissue fraction in Prx1Cre;Kdm4bw/w and Prx1Cre;Kdm4bf/f mouse femurs following PTH treatment. n = 8. (I) qRT-PCR and Western blot showing that loss of KDM4B inhibited PTH-induced RUNX2 expression in mouse MSCs. n = 3. (J-L) ChIP assays showing the enrichment of KDM4B (J), H3K9me3 (K) and β-catenin (L) at the Runx2 promoter treated with vehicle and PTH, respectively. n = 3. (M and N) reChIP assays showing that β-catenin, Smad1 and KDM4B co-occupied on the Runx2 promoter. n = 3. All data are presented as means ± SD. For (B), (C), (E), (F) and (H-L) the results were analyzed by two-way ANOVA with Holm-Sidak posthoc test. *P < 0.05, **P < 0.01, between groups; #P < 0.05, ##P < 0.01, treatment x genotype. For (M) and (N), *P < 0.05, **P < 0.01, Student’s t-test and one-way ANOVA with Tukey’s posthoc test. Also see Figure S6
Figure 5.
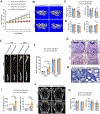
Figure 5.. Deletion of Kdm4b in MSCs exacerbates bone-fat imbalance in HFD-fed mice.
(A) Body weight growth curves of Prx1Cre;Kdm4bw/w and Prx1Cre;Kdm4bf/f mice fed a HFD or low fat diet (LFD) for 8 weeks. n = 7. (B) Representative μCT images of femurs from Prx1Cre;Kdm4bw/w and Prx1Cre;Kdm4bf/f mice fed a HFD or LFD for 8 weeks. Scale bar, 0.4 mm. n = 7. (C) Quantitative measurements of BMD and BV/TV in (B) by μCT. n = 7. (D) Quantitative measurements of Tb.N and Tb.Sp in (B) by μCT. n = 7. (E and F) μCT analysis of MAT in tibiae of Prx1Cre;Kdm4bw/w and Prx1Cre;Kdm4bf/f mice fed a HFD or LFD for 8 weeks. Scale bar, 1 mm. n = 7. (G) Representative H&E staining images of Prx1Cre;Kdm4bw/w and Prx1Cre;Kdm4bf/f mouse femurs fed a HFD or LFD for 8 weeks. Scale bar, 0.4 mm. n = 7. (H) Representative immunostaining of FABP4 in Prx1Cre;Kdm4bw/w and Prx1Cre;Kdm4bf/f mouse femurs fed a HFD for 8 weeks. Scale bar, 50 μm. n = 7. (I) Fat cell density and fat tissue fraction in femurs of Prx1Cre;Kdm4bw/w and Prx1Cre;Kdm4bf/f mice fed a HFD or LFD for 8 weeks. n = 7. (J) Representative μCT images of the 4th lumbar vertebrae (L4) from Prx1Cre;Kdm4bw/w and Prx1Cre;Kdm4bf/f mice fed a HFD or LFD. Scale bar, 0.7 mm. n = 7. (K) Quantitative measurements of BMD and BV/TV by μCT in L4 from Prx1Cre;Kdm4bw/w and Prx1Cre;Kdm4bf/f mice fed a HFD or LFD. n = 7. Data represent mean ± SD (error bars) from the pool of two independent experiments and were analyzed by two-way ANOVA with Holm-Sidak posthoc test. *P<0.05, **P<0.01, between groups; #P<0.05, ##P<0.01, diet x genotype interaction.
Figure 6.
Figure 6.. Loss of KDM4B impairs MSC self-renewal.
(A) Representative images of CFU-Fs formed by cells from Prx1Cre;Kdm4bw/w and Prx1Cre;Kdm4bf/f mice. Scale bar, 8 mm. n = 5. (B) GSEA shows a significant decrease of stem cell core gene signatures in Kdm4b−/− MSCs. (C) Representative H&E staining images of the first transplants from Kdm4b+/+ and Kdm4b−/− MSCs. Scale bar, 150 μm. n = 8 for Kdm4b+/+ MSCs; n = 7 for Kdm4b−/− MSCs. (D) Fluorescence images of bone tissue in the transplants from Kdm4b+/+ and Kdm4b−/− MSCs. Scale bar, 150 μm. n = 8 for Kdm4b+/+ MSCs; n = 7 for Kdm4b−/− MSCs. (E) Representative images of FABP4-expressing tdTomato+ adipocytes in transplants from Kdm4b+/+ and Kdm4b−/− MSCs. Scale bar, 40 μm. n = 8 for Kdm4b+/+ MSCs; n = 7 for Kdm4b−/− MSCs. (F and G) CFU-F (F) and CFU-OB (G) assays of cells from the first transplants. Scale bar, 8 mm. n = 3. (H) Bone areas and fat areas in the secondary transplants. n = 7 for Kdm4b+/+ MSCs. n = 3 for Kdm4b−/− MSCs. (I) CFU-F assays of cells from the secondary transplants. Scale bar, 8 mm. n = 3. Data represent mean ± SD (error bars). For (A) the results were analyzed by two-way ANOVA with Holm-Sidak posthoc test. *P < 0.05, **P < 0.01, between groups; #P < 0.05, ##P < 0.01, age x genotype interaction. For (D-I), *P < 0.05, **P < 0.01, Student t’s test.
Figure 7.
Figure 7.. Loss of KDM4B induces SAHF formation in MSCs and reduces MSC pool in aged mice.
(A) EdU incorporation assay of MSCs from Prx1Cre;Kdm4bw/w;tdTomato and Prx1Cre;Kdm4bf/f;tdTomato mice at P1 and P5, respectively. Scale bar, 40 μm. n = 4. (B) SA-β-gal staining of MSCs from 3-month-old Prx1Cre;Kdm4bw/w and Prx1Cre;Kdm4bf/f mice at P1 and P5. Scale bar, 50 μm. n = 6. (C) Restoration of KDM4B, but not KDM4B(H189A), recued the replicative senescence in Kdm4b−/− MSCs. Scale bar, 100 μm. n = 3. (D) SA-β-gal staining of MSCs from 20-month-old Prx1Cre;Kdm4bw/w mice and Prx1Cre;Kdm4bf/f mice at passage 1. Scale bar, 50 μm. n = 4. (E and F) Representative immunostaining of H3K9me3 (E) and HP1α (F) in Sca1+Tomato+CD45CD11b MSCs from 3- and 20-month-old Prx1Cre;Kdm4bw/w;tdTomato mice and Prx1Cre;Kdm4bf/f;tdTomato mice. Scale bars, 6 μm. n = 3. (G) Measurements of SAHF positive cells and nuclear size in Sca1+Tomato+CD45CD11b MSCs from 3- and 20-month-old Prx1Cre;Kdm4bw/w;tdTomato mice and Prx1Cre;Kdm4bf/f;tdTomato mice. n = 3. 200 nuclei were analyzed in each group. (H) Loss of KDM4B accelerated a decrease in Sca1+CD29+CD45CD11b MSCs in aged Prx1Cre;Kdm4bw/w mice and Prx1Cre;Kdm4bf/f mice. n = 5. (I) CFU-Fs formed by the cells from 18-month-old Prx1Cre;Kdm4bw/w and Prx1Cre;Kdm4bf/f mice treated with vehicle and PTH, respectively. Scale bar, 8 mm. n = 3. (J) Flow cytometry analysis for Sca1+CD29+CD45CD11b MSC population in bone marrow of 18-month-old Prx1Cre;Kdm4bw/w and Prx1Cre;Kdm4bf/f mice treated with vehicle and PTH, respectively. n = 3. Data represent mean ± SD. For (A), (B), and (G-J), the results were analyzed by the two-way ANOVA with Holm-Sidak posthoc test. *P < 0.05, **P < 0.01, between groups; #P < 0.05 passage x genotype interaction, age x genotype interaction, or treatment x genotype interaction. For (C), *P < 0.05, one-way ANOVA with Tukey’s posthoc test; and for (D), **P < 0.01, the Student t’s test. Also see Figure S7

Similar articles

Cited by

References

    1. Akune T, Ohba S, Kamekura S, Yamaguchi M, Chung U-I, Kubota N, Terauchi Y, Harada Y, Azuma Y, Nakamura K et al. (2004). PPARgamma insufficiency enhances osteogenesis through osteoblast formation from bone marrow progenitors. J Clin Invest 113, 846–855. - PMC - PubMed
    1. Bianco P, Cao X, Frenette PS, Mao JJ, Robey PG, Simmons PJ, and Wang C-Y (2013). The meaning, the sense and the significance: translating the science of mesenchymal stem cells into medicine. Nat Med 19, 35–42. - PMC - PubMed
    1. Burge R, Dawson-Hughes B, Solomon DH, Wong JB, King A, and Tosteson A (2007). Incidence and Economic Burden of Osteoporosis-Related Fractures in the United States, 2005–2025. J Bone Miner Res 22, 465–475. - PubMed
    1. Chang J, Wang Z, Tang E, Fan Z, McCauley L, Franceschi R, Guan K, Krebsbach PH, and Wang CY (2009). Inhibition of osteoblastic bone formation by nuclear factor-kappaB. Nat Med 15, 682–689. - PMC - PubMed
    1. Chen Q, Shou P, Zheng C, Jiang M, Cao G, Yang Q, Cao J, Xie N, Velletri T, Zhang X, et al. (2016). Fate decision of mesenchymal stem cells: adipocytes or osteoblasts? Cell Death Differ 23, 1128–1139. - PMC - PubMed

Publication types