. 2021 Apr 20;120(8):1396-1416.
doi: 10.1016/j.bpj.2021.01.032. Epub 2021 Feb 9.

A theoretical study of polymorphism in VQIVYK fibrils

Affiliations

A theoretical study of polymorphism in VQIVYK fibrils

Jaehoon Yang et al. Biophys J. .

Abstract

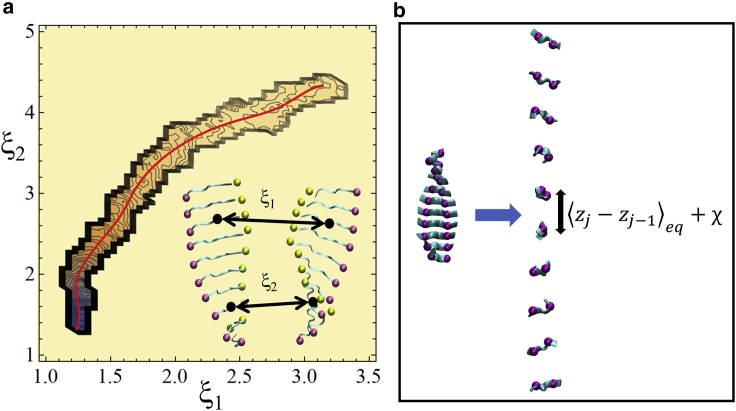
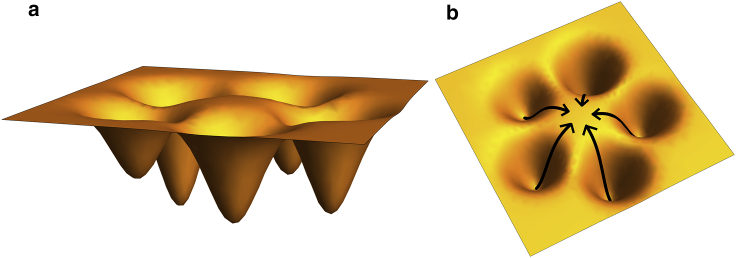
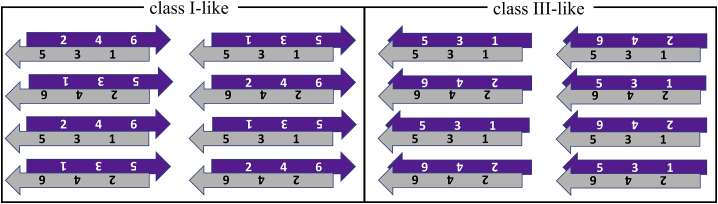
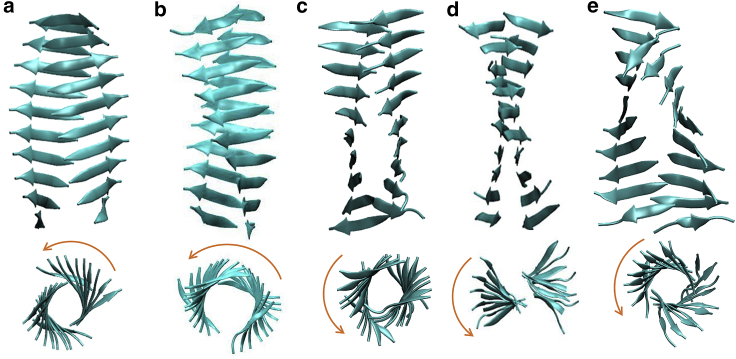
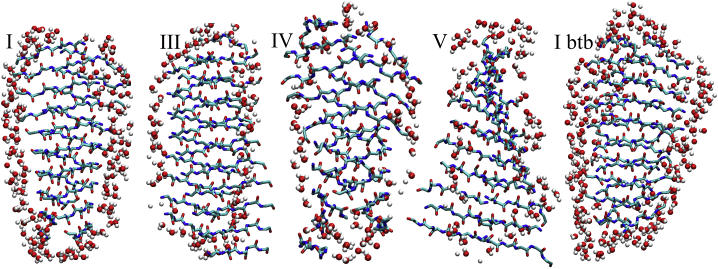
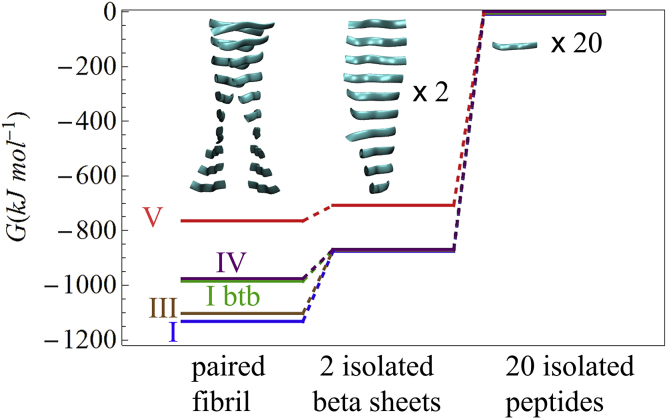
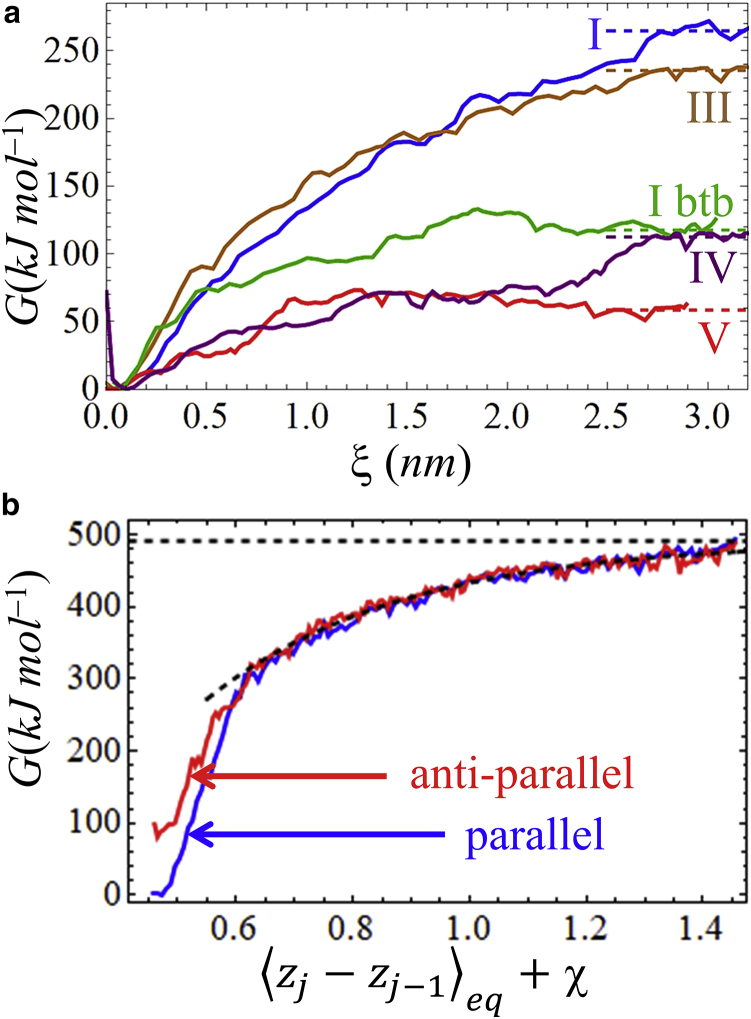
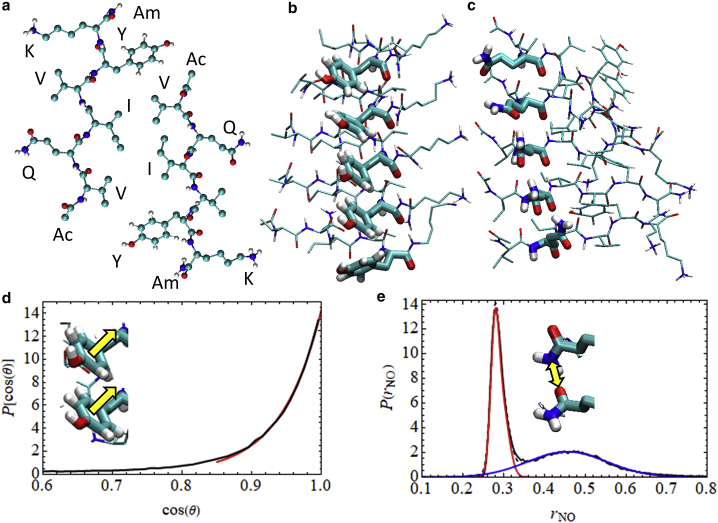
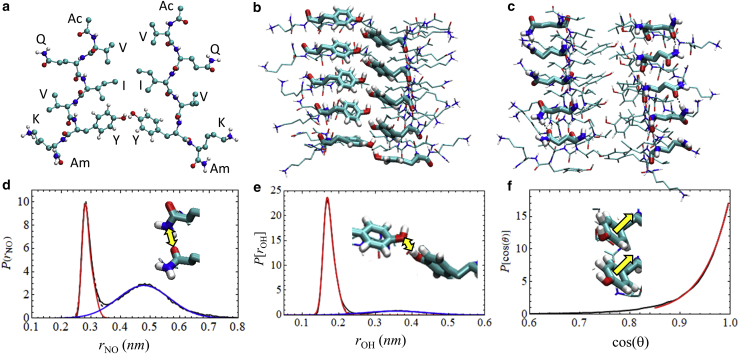
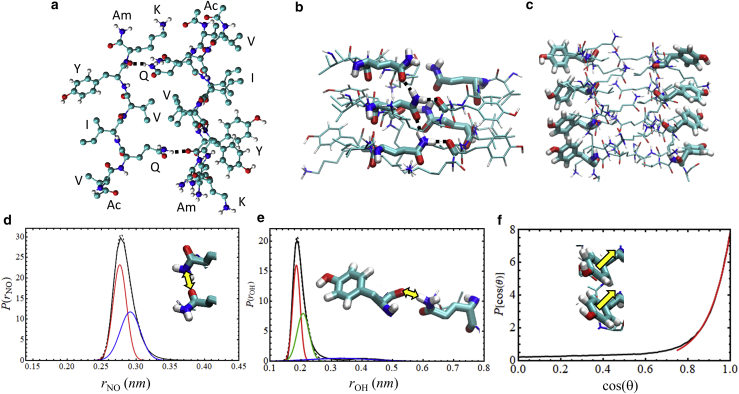
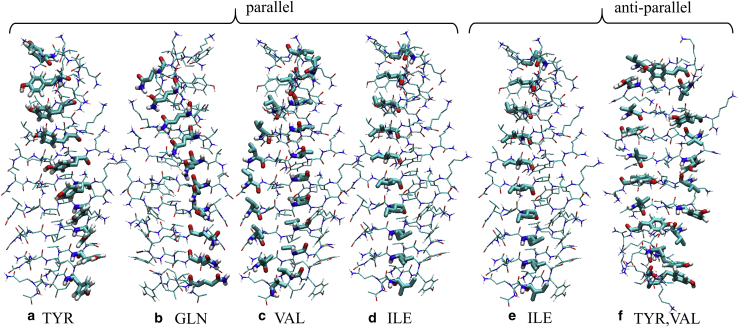
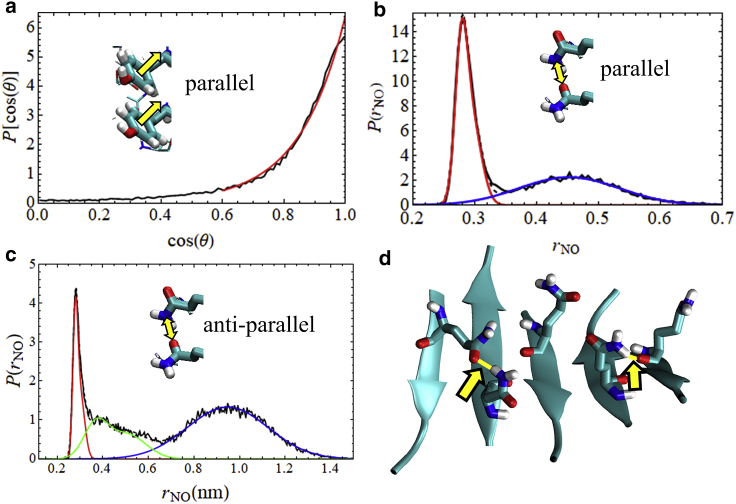
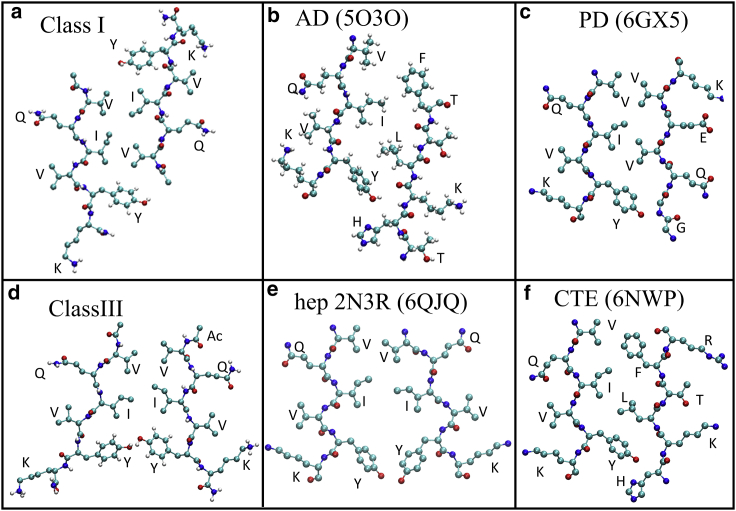
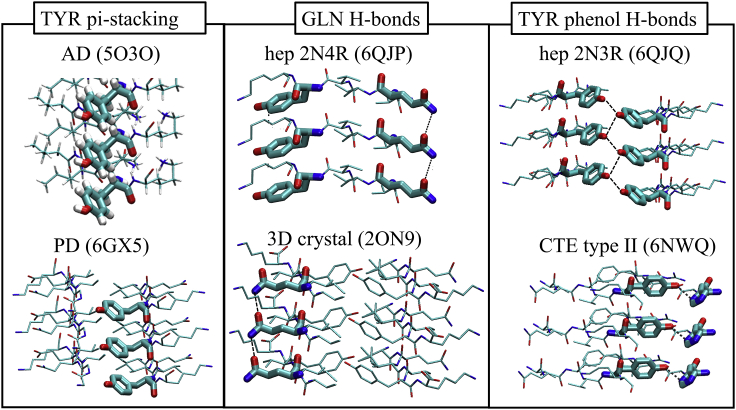
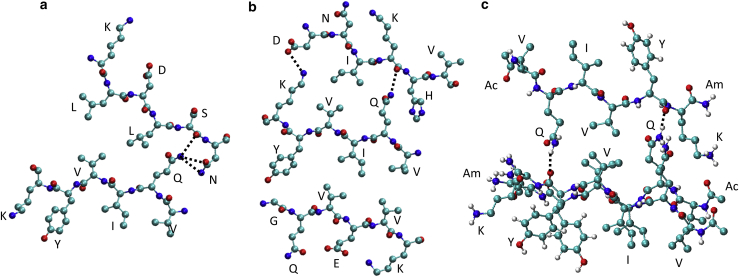
The VQIVYK fragment from the Tau protein, also known as PHF6, is essential for aggregation of Tau into neurofibrillary lesions associated with neurodegenerative diseases. VQIVYK itself forms amyloid fibrils composed of paired β-sheets. Therefore, the full Tau protein and VQIVYK fibrils have been intensively investigated. A central issue in these studies is polymorphism, the ability of a protein to fold into more than one structure. Using all-atom molecular simulations, we generate five stable polymorphs of VQIVYK fibrils, establish their relative free energy with umbrella sampling methods, and identify the side chain interactions that provide stability. The two most stable polymorphs, which have nearly equal free energy, are formed by interdigitation of the mostly hydrophobic VIY "face" sides of the β-sheets. Another stable polymorph is formed by interdigitation of the QVK "back" sides. When we turn to examine structures from cryo-electron microscopy experiments on Tau filaments taken from diseased patients or generated in vitro, we find that the pattern of side chain interactions found in the two most stable face-to-face as well as the back-to-back polymorphs are recapitulated in amyloid structures of the full protein. Thus, our studies suggest that the interactions stabilizing PHF6 fibrils explain the amyloidogenicity of the VQIVYK motif within the full Tau protein and provide justification for the use of VQIVYK fibrils as a test bed for the design of molecules that identify or inhibit amyloid structures.


Figures

Figure 1
Figure 1
(a) The inset illustrates the two reaction coordinates, ξ1 and ξ2, for separating the paired helical filament into noninteracting β-sheets. The contour plot shows the free energy surface for the class I structure (Polymorphs and their structural properties) as one β-sheet was pulled from the other. The red line is the minimal free energy path from paired sheets to noninteracting sheets, and the single reaction coordinate ξ is the arc length along this path. (b) The reaction coordinate χ is the length by which the equilibrium distance between strands is extended. See text for further discussion. To see this figure in color, go online.
Figure 2
Figure 2
(a) Schematic depiction of a free energy surface with wells representing different polymorphs of (VQIVYK)20. (b) Top view of the free energy surface is shown. The relative free energy of the different polymorphs is determined by calculating the free energy along the five different paths that bring the structures to a physically equivalent configuration. To see this figure in color, go online.
Figure 3
Figure 3
Possible steric zippers, which are composed of parallel β-sheet in which both sides of the sheet consist of alternating VIY and QVK side groups. Two of many possibilities for mutual registration of the sheets are shown for each structure. To see this figure in color, go online.
Figure 4
Figure 4
Snapshots of protofilaments obtained after initiating simulations of two β-sheets, 10 strands in each sheet, in structures consistent with classes (a) I, (b) III, (c) V, (d) I back to back, (e) IV and subsequent 10 ns of equilibration. Irregular structures obtained for other classes are described in Supporting materials and methods, Section S4. Each panel contains a view along the fibril axis in which an arrow indicates the direction, left-handed in all cases, in which the strand orientations rotate as one proceeds down the axis. To see this figure in color, go online.
Figure 5
Figure 5
Snapshots of class I, III, IV, V, and I-btb fibrils together with all water molecules simultaneously within 0.5 nm of an atom from both of the β-sheets. No such water molecules are found in the region between the two β-sheets. The snapshot for class V is most clear near the bottom of the image. No single view of the class V structure exposed its rather small overlap region over the full length of the fibril. To see this figure in color, go online.
Figure 6
Figure 6
Summary of the free energetics of fibril formation. The free energy changes are corrected for rotational entropy, as explained in Free energy calculations. To see this figure in color, go online.
Figure 7
Figure 7
(a) Free energy for class I, III, IV, V, and I-btb structures along a one-dimensional reaction coordinate, ξ, a progress variable from paired fibril to separated β-sheet. ξ is the arc length along the minimal free energy path, shown for class I in Fig. 1a. (b) Free energy along a reaction coordinate, which is the degree by which distance between strands is increased beyond their equilibrium length zjzj1eq, is given. The free energy surfaces for parallel and antiparallel β-sheets are aligned so they match at large separation. The dashed line following the free energy surfaces at long range is an exponential fit to the curve of the form GAeχ/a, where G = 491 kJ mol−1, A = 1113 kJ mol−1, a = 0.34 nm, and χ is the reaction coordinate for pulling the β-sheet into isolated strands. The horizontal dashed line indicates the asymptotic value G of the free energy. The minimum of the antiparallel surface lies (81 ± 10) kJ mol−1 above that of the parallel surface. To see this figure in color, go online.
Figure 8
Figure 8
(a)–(c) are drawn from the same snapshot from a simulation of (VQIVYK)20 in a class I structure. (a) Two β-strands, one from each of the two β-sheets facing each other, are shown. In addition to the usual one-letter amino acid abbreviations, Am represents amide and Ac represents acetyl. (b) The tyrosine residues from one of the two β-sheets are highlighted, showing π-stacking among most of the phenol rings, although in this snapshot the bottom ring exhibits a thermally activated defect. (c) A string of hydrogen-bonded glutamine side chains is highlighted. (d) The black curve is the probability distribution of cos(θ) = |njnj + 1|, where nj is a unit normal vector to the jth phenol ring. The red curve is an exponential fit to the data for cos(θ) > 0.85. (e) Probability distribution of glutamine Nɛ-Oɛ between adjacent strands of the same chain is given. For each pair of adjacent strands, two such distances are possible, i.e., |rOjrNj+1| and |rNjrOj+1|, depending on whether the amide of strand j or j + 1 is the hydrogen bond donor. We accumulated the shortest of the two distances for each pair. The black curve is the full distribution. It was fitted to a linear combination of two Gaussian functions, which yield the red curve, and a third Gaussian function, which is the blue curve. The dashed black curve is the sum of the Gaussians. Parameters for the fits in (d) and (e) are given in Supporting materials and methods, Section S8.1. To see this figure in color, go online.
Figure 9
Figure 9
(a)–(c) are drawn from the same snapshot from a simulation of (VQIVYK)20 in a class III structure. (a) Two β-strands, one from each of the two β-sheets facing each other, are shown. Am and Ac are defined as in Fig. 8. (b) Tyrosine residues from both β-sheets are highlighted, showing the chain of hydrogen bonds formed by the phenol hydroxyl groups of one sheet alternating with the phenol group from the opposite sheet. (c) A string of hydrogen-bonded glutamine side chains is highlighted. (d) The solid black curve is the probability distribution of glutamine Nɛ-Oɛ between adjacent strands of the same chain. This plot assembled in the same way as class I, as described in Class I fibril. The peaks representing bound and unbound pairs, respectively, are described by a sum of two Gaussians (the red curve) and a single Gaussian (the blue curve). (e) The black curve (barely visible because the red and blue Gaussian fits are so accurate) is the probability distribution of O⋅⋅⋅H distances involving the phenol oxygen of one sheet and the phenol hydroxyl hydrogen of a tyrosine on the opposing sheet. For each pair of adjacent strands, two such distances are possible, i.e., |rOjrHj+1| and |rHjrOj+1|, where the O and H atoms are from the phenol hydroxyl groups on different sheets. We accumulated the shortest of the two distances for each pair. The red curve is a sum of two Gaussians that fit the peak at small separation that represents hydrogen-bonded tyrosine pairs from opposing sheets, and the blue curve is a single Gaussian that fits the unbound population. (f) The black curve is the probability distribution of cos(θ) = |njnj + 1|, where nj is a unit normal vector to the jth phenol ring. The red curve is an exponential fit to the data for cos(θ) > 0.85. Parameters for the fits in panels (d)–(f) are given in Supporting materials and methods, Section S8.2. To see this figure in color, go online.
Figure 10
Figure 10
(a)–(c) are drawn from the same snapshot extracted from a simulation of (VQIVYK)20 in the class I back-to-back structure. (a) On the left is shown one β-strand, and on the right, two adjacent strands from the opposing β-sheet. Am and Ac are defined as in Fig. 8. Dotted lines indicate the hydrogen bonds that form between the peptide bond oxygen of a tyrosine and the glutamine amide group of the other β-sheet. Two strands from the sheet on the right are shown to exhibit the two hydrogen bonds involving the strand on the left, which donates and receives a glutamine-peptide carbonyl hydrogen bond from two different, adjacent strands on the right. (b) Strings of hydrogen-bonded glutamine side chains are highlighted. (c) Tyrosine residues are highlighted to illustrate π-stacking. (d) The solid black curve is the probability distribution of glutamine Nɛ-Oɛ between adjacent strands of the same chain. This plot is assembled in the same way as class I, as described in Class I fibril. Unlike the exterior glutamine side chains in Figs. 8 and 9, there is full participation among the interior glutamine side chains of the class I-btb polymorph. The peak is well fitted by a sum of two Gaussians. (e) Probability distribution of distances from the peptide carbonyl oxygen of tyrosine to the closest amide hydrogen of an opposing glutamine side chain is shown. The main peak and a small dissociated peak are fitted adequately by three Gaussian functions. (f) The black curve is the probability distribution of cos(θ) = |njnj + 1|, where nj is a unit normal vector to the jth phenol ring. The red curve is an exponential fit to the data for cos(θ) > 0.85. Parameters of the various fitting functions are given in Supporting materials and methods, Section S8.4. To see this figure in color, go online.
Figure 11
Figure 11
Side chain interactions that stabilize parallel and antiparallel β-sheets of VQIVYK. The four images on the left are the parallel β-sheet with, in turn, TYR, GLN, VAL, and ILE residues highlighted. The two images in the right exhibit the antiparallel fibril with, in turn, ILE and TYR and VAL residues highlighted. See text for details. To see this figure in color, go online.
Figure 12
Figure 12
Structural properties of single parallel β-sheets. (a) The black curve is the probability distribution of cos(θ) = |njnj + 1|, where nj is a unit normal vector to the jth phenol ring of a parallel single β-sheet. These are the interactions highlighted in Fig. 11a. The red curve is a fit to the data for cos(θ) > 0.6. (b) The solid black curve is the probability distribution of glutamine Nɛ-Oɛ between adjacent strands of the same chain for a single parallel β-sheet. These interactions are highlighted in Fig. 11b. This plot assembled in the same way as for class I, as described in Class I fibril, and is described well by a sum of two Gaussian functions. The red curve is interpreted as hydrogen-bonded glutamine side chains on adjacent strands of the parallel β-sheet. (c) This plot is the analog of the previous (b) for the antiparallel single sheet. Here, we see three components: a sharp feature (red curve), interpreted as hydrogen-bonded glutamine side chains, is centered at 0.286 nm and is described as a sum of two Gaussians (red curve). The outer peak centered at 0.95 nm, fitted by a single Gaussian (blue curve), represents nonbonded glutamine side chains. The intermediate structure (green curve) has a complicated shape, also fitted as a sum of two Gaussians. (d) A snapshot is given of an antiparallel single sheet in which there are two instances of hydrogen bonds between adjacent glutamine side chains, indicated by the arrows and yellow lines joining hydrogen-bonded atoms. Parameters of the various fitting functions are given in Supporting materials and methods, Section S8.5. To see this figure in color, go online.
Figure 13
Figure 13
Shown here are snapshots of opposing strands, either from our simulations (a and d) or experimental cryo-EM structures (b) from Alzheimer’s disease (121), (c) Pick’s disease (123), (e) heparin-induced in vitro aggregation (125), and (f) chronic traumatic encephalopathy (127). To see this figure in color, go online.
Figure 14
Figure 14
Examples in which the intra- and intersheet patterns of side chain interactions found in our simulation fibrils are also observed in experimental cryo-EM or three-dimensional crystal structures. See text for discussion. To see this figure in color, go online.
Figure 15
Figure 15
Structures in which the QVK back side of PHF6 forms a fibril pair with another β-sheet. (a) Heparin-induced 2N4R Tau aggregate (6QJP), in which a VQIVYK β-sheet is opposed by a KLDLSN sheet, is shown. (b) CBD Tau filament, in which the VQIVYK β-sheet (center) is opposed in its back side by DNIKHV (top) and on its face by GQVEVK (bottom), is shown. (c) The VQIVYK back-to-back structure from simulations is shown. The interactions between the top two strands of (b) should be compared with (c) because both involve a VQIVYK interacting with another sheet through its QVK side chains. In all three structures, the amide nitrogen of the glutamine side chain lies within a hydrogen bonding distance of a peptide carbonyl of the opposing segment. To see this figure in color, go online.

Similar articles

Cited by

References

    1. Knowles T.P.J., Vendruscolo M., Dobson C.M. The amyloid state and its association with protein misfolding diseases. Nat. Rev. Mol. Cell Biol. 2014;15:384–396. - PubMed
    1. Knowles T.P.J., Vendruscolo M., Dobson C.M. The amyloid state and its association with protein misfolding diseases. Nat. Rev. Mol. Cell Biol. 2014;15:384–396. - PubMed
    1. Ow S.-Y., Dunstan D.E. A brief overview of amyloids and Alzheimer’s disease. Protein Sci. 2014;23:1315–1331. - PMC - PubMed
    1. Avila J., Jiménez J.S., Hernández F. Tau structures. Front. Aging Neurosci. 2016;8:262. - PMC - PubMed
    1. Eisenberg D., Jucker M. The amyloid state of proteins in human diseases. Cell. 2012;148:1188–1203. - PMC - PubMed

Publication types

LinkOut - more resources