. 2021 Mar;132(3):708-719.
doi: 10.1016/j.clinph.2020.11.036. Epub 2020 Dec 30.

Influence of unfused cranial bones on magnetoencephalography signals in human infants

Affiliations

Influence of unfused cranial bones on magnetoencephalography signals in human infants

Seok Lew et al. Clin Neurophysiol. 2021 Mar.

Abstract

Objective: To clarify the effects of unfused cranial bones on magnetoencephalography (MEG) signals during early development.

Methods: In a simulation study, we compared the MEG signals over a spherical head model with a circular hole mimicking the anterior fontanel to those over the same head model without the fontanel for different head and fontanel sizes with varying skull thickness and conductivity.

Results: The fontanel had small effects according to three indices. The sum of differences in signal over a sensor array due to a fontanel, for example, was < 6% of the sum without the fontanel. However, the fontanel effects were extensive for dipole sources deep in the brain or outside the fontanel for larger fontanels. The effects were comparable in magnitude for tangential and radial sources. Skull thickness significantly increased the effect, while skull conductivity had minor effects.

Conclusion: MEG signal is weakly affected by a fontanel. However, the effects can be extensive and significant for radial sources, thicker skull and large fontanels. The fontanel effects can be intuitively explained by the concept of secondary sources at the fontanel wall.

Significance: The minor influence of unfused cranial bones simplifies MEG analysis, but it should be considered for quantitative analysis.

Keywords: Brain development; Electroencephalography (EEG); Fontanel; Human brain mapping; Magnetoencephalography (MEG); Unfused cranial bones.


Conflict of interest statement

Declaration of Competing Interest The authors declare that they have no known competing financial interests or personal relationships that could have appeared to influence the work reported in this paper.

Figures

Fig. 1.
Fig. 1.
Configuration for simulating MEG signals in the presence of a skull defect (fontanel). (A) Spherical head model with a fontanel. The four compartments used for the 3D model of the infant head conductivity geometry. The radii for different age models are given in Table 1. (B) Sensor array layout of the 270-channel BabyMEG infant MEG system, viewed from the right and from above. The spherical scalp surface of the 12-month-old infant model is depicted with the sensor array. A fontanel of 80-mm diameter is shown in dark gray. (C) Schematic of the source plane depicted with the outline of the scalp surface and the sensor array. The three orientations of the dipoles are indicated with sample arrows: yz-tangential (left), x-tangential (middle), and radial (right), viewed from the right side and from the top of the head. The x-axis points from the subject’s left to the right, the y-axis points to the front, and the z-axis points up.
Fig. 2.
Fig. 2.
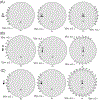
The measure D1 of the difference in the MEG signals for head models with and without a fontanel, shown for three fontanel diameters (df = 20, 40, and 80 mm). D1 is color coded on the source space for (A) tangential primary current dipolar sources parallel (yz-tangential) to the source plane, (B) tangential primary current dipolar sources perpendicular (x-tangential) to the source plane, and (C) radial dipoles. The rightmost column shows the strength (L1 norm) of the signal for the dipoles in the reference model. Note that the tangential orientation is defined relative to the head model, not relative to the fontanel wall. Units of the scales are in pT. The dipole moment of all dipoles was 25 nAm. The fontanel is depicted with a gray arc segment in each case. The 6-month model was used, with skull conductivity 0.04 S/m and thickness 2 mm.
Fig. 3.
Fig. 3.
The MAGrel measure, which describes the magnitude of the effect of the fontanel on the MEG signals, is shown as a function of the primary source current dipole location for three fontanel sizes for tangential dipoles (A) parallel (yz-tangential) and (B) perpendicular (x-tangential) to the source plane. Because MAGrel becomes unstable when the MEG signal in the reference model approaches zero, a region around the center of the sphere model was masked out. Model details as in Fig. 2.
Fig. 4.
Fig. 4.
The RDM* measure, which quantifies changes in the topography of the MEG signals due to the presence of the fontanel, is shown for three fontanel sizes for tangential dipoles (A) parallel (yz-tangential), and (B) perpendicular (x-tangential) to the source plane. Model details as in Fig. 2.
Fig. 5.
Fig. 5.
Profiles of the fontanel effect on MEG signals for dipoles distributed along the superficial arc of the source plane. (A) D1 in units of pT for 25-nAm dipoles, (B) MAGrel and (C) RDM*. The angle θ was defined between the vertical centerline in the source disk and the position vector of the dipole on the outmost rim of the source space. The straight lines on the top of each plot indicate the extent of the fontanel for df = 10, 20, 40, and 80 mm. The 9-month model was used, with skull conductivity 0.04 S/m and thickness 2 mm.
Fig. 6.
Fig. 6.
Influence of skull thickness and skull conductivity on the fontanel effect. Maximum change in MEG signal (max D1) due to the presence of a fontanel for yz-tangential dipoles is shown as a function of the fontanel diameter df. Forward models with two different values for the skull thickness (2 or 3 mm) and skull conductivity (0.04 or 0.03 S/m) were examined. The average and standard deviation over the five post-natal age models (i.e., head sizes) are shown.
Fig. 7.
Fig. 7.
Projection of the effect of a fontanel on MEG signals during development. (A) The maximum value of the difference measure D1 among all yz-tangential dipole locations is shown as a function of the fontanel size. Data from five different age models (0, 3, 6, 9, and 12 postnatal months) are superimposed. The skull conductivity was 0.04 S/m, thickness 2 mm. The dashed line indicates the 5% level of the maximal L1-norm of the magnetic signal in the reference model, averaged over the five age models. (B) Projection of developmental changes in the fontanel effect in MEG signals. The maximum value of D1 is shown for a likely sequence of fontanel and head size combinations during the first year of life. Note the relatively constant effect despite of changes in the head and fontanel sizes.
Fig. 8.
Fig. 8.
Volume currents generated by a primary current dipole. The volume current distributions are shown for a head with (column 1) and without (column 2) a fontanel, as well as their difference (column 3). Column 4 shows the MEG field of the difference shown in column 3. Skull is shown in black, scalp and fontanel in gray, and CSF in white. The cone arrows indicate the volume current field, the primary current dipole is depicted by the large yellow arrow. Four cases are illustrated: (A) a tangential dipole just below the center of the fontanel, (B) a tangential dipole just below the wall of the fontanel, (C) a radial dipole just below the center of the fontanel, and (D) a radial dipole just below the wall of the fontanel. For the tangential dipoles (A, B) the fontanel diameter is df = 20 mm and the maximum color scale is 50 nA/mm2, maximum of the difference MEG field is 0.20 pT. For the radial dipoles (C, D) df = 40 mm and maximum color scale 30 nA/mm2, and maximum of the difference MEG field is 0.20 pT. The 9-month model was used, with skull conductivity 0.04 S/m with thickness 3 mm.
Fig. 9.
Fig. 9.
Schematic illustration of secondary currents along the wall of a fontanel produced by three types of primary sources: (A) a tangential dipole perpendicular to the fontanel wall (corresponding to the yz-tangential case in our simulations), (B) a tangential dipole parallel to the fontanel wall (corresponding to the x-tangential case), and (C) a radial dipole. Each circle represents a circular skull defect (fontanel) viewed from above (cf. bottom row of Fig. 1C). The source disk is located in the mid-sagittal plane, horizontally oriented and perpendicular to the plane of the figure. The dipole is located either just outside (left column), just inside (middle), or at the center (right) of the region covered by the fontanel. The secondary currents are located at the boundary, oriented normal to it. The thick arrow indicates the primary current dipole; the radial dipoles point up from the plane of the paper. The potential V at the wall of the fontanel, shown by + or − signs, depends on the orientation and direction of the primary source. The thin arrows indicate the magnitude (schematically, not to scale) and direction of the secondary sources along the edge of the fontanel. Secondary currents at the other boundaries (top and bottom of the fontanel, brain-CSF, CSF-skull, skull-scalp, and scalp-air) were assumed radially oriented and thus to contribute only little to the near-radial component of the magnetic field measured in the present simulations. The magnitude of the secondary sources is proportional to V(σfσs). The sign of the secondary sources depends on the product of these two terms. The conductivity of the tissue within the fontanel (σf) is assumed to be greater than the conductivity of the surrounding skull (σs), i.e., σf - σs > 0. In the present study σs = 0.03 or 0.04 S/m and σf = 0.3 S/m and thus σf - σs = 0.27 or 0.26 S/m.

References

    1. Ahlfors SP, Han J, Belliveau JW, Hämäläinen MS. Sensitivity of MEG and EEG to source orientation. Brain topography. 2010a;23:227–32. - PMC - PubMed
    1. Ahlfors SP, Han J, Lin FH, Witzel T, Belliveau JW, Hämäläinen MS, Halgren E. Cancellation of EEG and MEG signals generated by extended and distributed sources. Hum Brain Mapp. 2010b;31:140–9. - PMC - PubMed
    1. Barth DS, Sutherling W, Broffman J, Beatty J. Magnetic localization of a dipolar current source implanted in a sphere and a human cranium. Electroencephalogr Clin Neurophysiol. 1986;63:260–73. - PubMed
    1. Cohen D, Cuffin BN. Demonstration of useful differences between magnetoencephalogram and electroencephalogram. Electroencephalogr Clin Neurophysiol. 1983;56:38–51. - PubMed
    1. Cohen MM Jr. Sutural biology and the correlates of craniosynostosis. Am J Med Genet. 1993;47:581–616. - PubMed

Publication types

LinkOut - more resources