. 2021 Feb 9;14(2):137.
doi: 10.3390/ph14020137.

miR-16-5p Promotes Erythroid Maturation of Erythroleukemia Cells by Regulating Ribosome Biogenesis

Affiliations

miR-16-5p Promotes Erythroid Maturation of Erythroleukemia Cells by Regulating Ribosome Biogenesis

Christos I Papagiannopoulos et al. Pharmaceuticals (Basel). .

Abstract

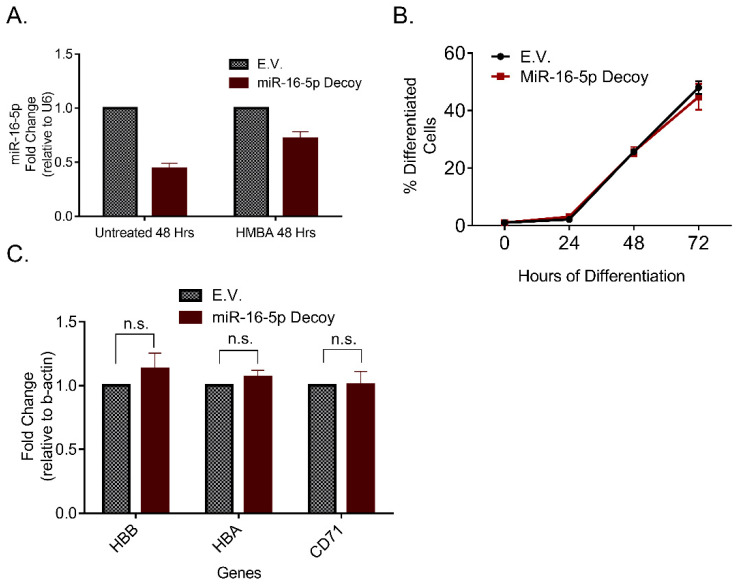
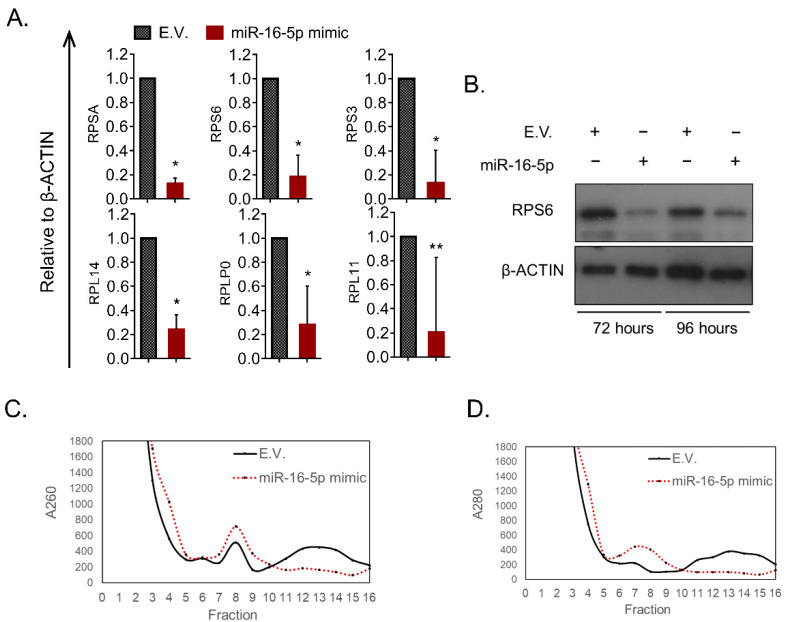
miRNAs constitute a class of non-coding RNA that act as powerful epigenetic regulators in animal and plant cells. In order to identify putative tumor-suppressor miRNAs we profiled the expression of various miRNAs during differentiation of erythroleukemia cells. RNA was purified before and after differentiation induction and subjected to quantitative RT-PCR. The majority of the miRNAs tested were found upregulated in differentiated cells with miR-16-5p showing the most significant increase. Functional studies using gain- and loss-of-function constructs proposed that miR-16-5p has a role in promoting the erythroid differentiation program of murine erythroleukemia (MEL) cells. In order to identify the underlying mechanism of action, we utilized bioinformatic in-silico platforms that incorporate predictions for the genes targeted by miR-16-5p. Interestingly, ribosome constituents, as well as ribosome biogenesis factors, were overrepresented among the miR-16-5p predicted gene targets. Accordingly, biochemical experiments showed that, indeed, miR-16-5p could modulate the levels of independent ribosomal proteins, and the overall ribosomal levels in cultured cells. In conclusion, miR-16-5p is identified as a differentiation-promoting agent in erythroleukemia cells, demonstrating antiproliferative activity, likely as a result of its ability to target the ribosomal machinery and restore any imbalanced activity imposed by the malignancy and the blockade of differentiation.

Keywords: cancer; erythroid differentiation; erythroleukemia; miR-16-5p; miRNA therapeutics; ribosomes.


Conflict of interest statement

The authors declare no conflict of interest.

Figures

Figure 1
Figure 1
miRNA levels during murine erythroleukemia (MEL) cell differentiation. (A) Schematic representation of the miRNA screening performed in Figure 1. (B) Alterations in the levels of miRNAs in HMBA 48 h treated cells against untreated cells, ranked from the most upregulated miRNA to the most downregulated. All values were normalized to U6 expression. (C) MiR-16-5p cellular levels during MEL differentiation in a time-dependent manner. One-way analysis of variance performing multiple comparisons of each time point against 0 h (* p = 0.0005, ** p< 0.0001).
Figure 2
Figure 2
The exogenous overexpression of miR-16-5p increases erythroid differentiation. (A) Timeline depicting the cell treatments performed for the experiments in Figure 2. Transfection with miR-16-5p mimic was performed in day-1 and HMBA treatment was initiated in day-0. (B) Percentage of differentiated cells in a time-dependent experiment for the indicated cell cultures. Differentiation was scored using the benzidine positivity assay, which stains hemoglobin-positive cells. (C) mRNA levels of selected biomarkers of differentiation in E.V. against miR-16-5p mimic treated cells (normalized to β-actin). (D) Western blot using specific antibodies against hemoglobin-β (HBB) and β-actin in protein lysates derived from E.V., GFP and miR-16-5p mimic (48- and 72-h treatment). (E) Quantification of the Western blot analysis in D. Statistical significance was inferred using multiple t-tests (Holm–Sidak method) between E.V. and miR-16-5p mimic treated cells (* p < 0.001, ** p < 0.0001).
Figure 3
Figure 3
Inhibition of miR-16-5p by a decoy plasmid in MEL cells. (A) Quantification of the miR-16-5p cellular levels after transfection with the decoy plasmid. The experiment was performed exactly as with the mimic plasmid shown in the timeline in Figure 2A, thus, transfection with the decoy plasmid was performed in day-1. (B) Percentage of differentiated cells in each culture in a time-dependent experiment. Differentiation was scored using the benzidine positivity assay, which stains hemoglobin-accumulating cells. (C) mRNA levels of selected biomarkers of differentiation in E.V. against miR-16-5p decoy treated cells (normalized to β-actin). Statistical analysis was performed using multiple t-tests (Holm–Sidak method) between E.V. and miR-16-5p decoy treated cells and no alteration was found to be statistically significant.
Figure 4
Figure 4
Bioinformatic analysis of the miR-16-5p target genes. (A,B) Functional enrichment analysis of the most significant pathways among the miR-16-5p target genes retrieved through (A) miRNet and (B) miRTargetLink. Each bar plot represents a KEGG pathway ranked in a descending order based on their calculated p-values. The analysis was performed using the miRNET functional enrichment tool. (C) Graphical representation of major steps of ribosome biogenesis, translation initiation and regulation, depicting the genes affected by miR-16-5p. (D) Protein–protein interaction network between the genes shown in B. The network analysis was performed with the String database tool. Network edges represent protein–protein interactions, sourced from text mining, experiments, databases, coexpression, neighborhood, gene fusion and co-occurrence.
Figure 5
Figure 5
miR-16-5p overexpression modulates ribosomes in MEL cells. (A) mRNA levels of selected members of the small and large subunit of the ribosome in E.V. against miR-16-5p mimic treated cells. All genes were normalized to β-actin expression. Statistical significance was inferred using a two-tailed t-test between E.V. and miR-16-5p mimic treated cells. * p < 0.001, ** p < 0.05. (B) Protein levels of RPS6 after 72 and 96 h of treatment with either E.V. or miR-16-5p mimic plasmid. (C) Ribosome fractionation through ultracentrifugation in a sucrose gradient, derived from cells treated with E.V. or miR-16-5p. After the ultracentrifugation the gradient was separated into 16 fractions and absorbance at 260 nm was determined using a spectrophotometer. Fractions 7-8 correspond to monosomal particles and fractions 10–16 are mainly populated by polysomes. (D) Same as with C but here absorbance at 280 nm was determined.

Similar articles

Cited by

References

    1. Macfarlane L.A., Murphy P.R. MicroRNA: Biogenesis, function and role in cancer. Curr. Genom. 2010;11:537–561. doi: 10.2174/138920210793175895. - DOI - PMC - PubMed
    1. Peng Y., Croce C.M. The role of microRNAs in human cancer. Signal Transduct. Target Ther. 2016;1:15004. doi: 10.1038/sigtrans.2015.4. - DOI - PMC - PubMed
    1. O’Brien J., Hayder H., Zayed Y., Peng C. Overview of microRNA biogenesis, mechanisms of actions, and circulation. Front. Endocrinol. 2018;9:402. doi: 10.3389/fendo.2018.00402. - DOI - PMC - PubMed
    1. Cho W.C. OncomiRs: The discovery and progress of microRNAs in cancers. Mol. Cancer. 2007;6:60. doi: 10.1186/1476-4598-6-60. - DOI - PMC - PubMed
    1. Lee Y.S., Dutta A. MicroRNAs in cancer. Ann. Rev. Pathol. 2009;4:199–227. doi: 10.1146/annurev.pathol.4.110807.092222. - DOI - PMC - PubMed

LinkOut - more resources