Review
. 2021 Feb 9;10(2):352.
doi: 10.3390/cells10020352.

Dysregulation of PGC-1α-Dependent Transcriptional Programs in Neurological and Developmental Disorders: Therapeutic Challenges and Opportunities

Affiliations
Review

Dysregulation of PGC-1α-Dependent Transcriptional Programs in Neurological and Developmental Disorders: Therapeutic Challenges and Opportunities

Laura J McMeekin et al. Cells. .

Abstract

Substantial evidence indicates that mitochondrial impairment contributes to neuronal dysfunction and vulnerability in disease states, leading investigators to propose that the enhancement of mitochondrial function should be considered a strategy for neuroprotection. However, multiple attempts to improve mitochondrial function have failed to impact disease progression, suggesting that the biology underlying the normal regulation of mitochondrial pathways in neurons, and its dysfunction in disease, is more complex than initially thought. Here, we present the proteins and associated pathways involved in the transcriptional regulation of nuclear-encoded genes for mitochondrial function, with a focus on the transcriptional coactivator peroxisome proliferator-activated receptor gamma coactivator-1alpha (PGC-1α). We highlight PGC-1α's roles in neuronal and non-neuronal cell types and discuss evidence for the dysregulation of PGC-1α-dependent pathways in Huntington's Disease, Parkinson's Disease, and developmental disorders, emphasizing the relationship between disease-specific cellular vulnerability and cell-type-specific patterns of PGC-1α expression. Finally, we discuss the challenges inherent to therapeutic targeting of PGC-1α-related transcriptional programs, considering the roles for neuron-enriched transcriptional coactivators in co-regulating mitochondrial and synaptic genes. This information will provide novel insights into the unique aspects of transcriptional regulation of mitochondrial function in neurons and the opportunities for therapeutic targeting of transcriptional pathways for neuroprotection.

Keywords: Huntington’s Disease; Parkinson’s Disease; dopaminergic neuron; interneuron; mitochondrial transcription factor A; neuronal vulnerability; nuclear respiratory factor 1; nuclear respiratory factor 2; nuclear-encoded mitochondrial genes; spiny projection neuron.


Conflict of interest statement

The authors declare no conflict of interest. The funders had no role in the design of the study; in the collection, analyses, or interpretation of data; in the writing of the manuscript, or in the decision to publish the results.

Figures

Figure 1
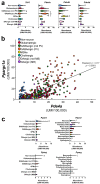
Figure 1
(a) A publicly available single-cell transcriptomic dataset [64] was used to explore cell-type-specific mRNA expression abundance in different neuronal populations of the mouse brain. Note the differences in the x-axes scales. (b) mRNA abundance for Ppargc1a and the interneuron-specific developmental marker Sox6 was measured in neurons expressing parvalbumin (Pvalb, white arrowheads) or somatostatin (Sst, white arrows) mRNA using small molecule fluorescent in situ hybridization [62] in cortex from mice on postnatal day 14 (n = 3/group, total cell number indicated in white). Kruskal-Wallis analyses were used in (a), with * p < 0.05, ** p < 0.01, and letters indicating other statistically significant differences <0.05. a = different than all but cholinergic and DAergic (MB); b = different than all but cholinergic and DAergic (not MB); c = different than all but DAergic (MB); d = different than glutamatergic, GABAergic (not PV), and GABAergic (PV); e = different than all but SPNs, Cholinergic, and DAergic (MB); f = different than all but SPNs, Cholinergic, and DAergic (not MB); g = different than all but GABAergic (PV), SPNs, DAergic (not MB). Unpaired t-tests were used in (b); 165–208 cells and four representative sections /mouse, three mice; ** p < 0.01. UMI = unique molecular identifier. PV = parvalbumin-expressing neurons. SPNs = spiny projection neurons. MB = midbrain.
Figure 2
Figure 2
(a) Ppargc1a and synaptotagmin 2 (Syt2) or (b) Ppargc1a and Tfam mRNA expression is compared in different cell types using publicly available single-cell transcriptomic profiles [64]. Circles indicate clustering of datapoints for parvalbumin-positive interneurons (orange), spiny projection neurons (yellow), or dopaminergic neurons of the midbrain (purple). (c) Abundance of mRNA for Syt2 and Tfam by cell type. Two-tailed correlation analyses were used in (a,b), and Kruskal-Wallis analysis was used in (c), with * p < 0.05, and letters indicating other statistically significant differences <0.05. a = different than all but cholinergic and DAergic (MB); b = different than all but DAergic (MB); c = different than all but cholinergic. UMI = unique molecular identifier. PV = parvalbumin-expressing neurons. SPNs = spiny projection neurons. MB = midbrain.
Figure 3
Figure 3
(a) A publicly available single-cell transcriptomic dataset [64] was used to explore cell-type-specific mRNA abundance of putative drug targets for manipulation of PGC-1α expression and/or activity. While Sirt1 mRNA expression is low and ubiquitous, other transcripts which are putative targets of resveratrol are expressed more abundantly and in different cell-type-specific distributions. Note the difference in the x-axes scales. (b) A strong correlation was observed between the cell-type-specific abundance of Ppargc1a and Pde4a mRNA. (c) Ppard shows differential enrichment in neuronal and non-neuronal populations, while Pparg is expressed relatively lowly at the mRNA level. Note the differences in the x-axes scales. Kruskal-Wallis analyses were used in a and c, with * p < 0.05, ** p < 0.01, and letters indicating other statistically significant differences <0.05. a = different than non-neurons; b = different than all the rest; c = different than all but DAergic (not MB) and DAergic (MB); d = different than all but cholinergic and DAergic (not MB); e = different than glutamatergic, GABAergic (not PV), and SPNs; f = different than endothelial cells, fibroblast-like, and mural cells; g = different than all but microglia; h = different than all but macrophages and astrocytes; i = different than all but fibroblast-like, mural cells, microglia; j = different than fibroblast-like, mural cells, oligodendrocytes, and polydendrocytes; UMI = unique molecular identifier. PV = parvalbumin-expressing. SPNs = spiny projection neurons. MB = midbrain.
Figure 4
Figure 4
(a) In the brain, maintenance of NRF-1-target genes such as Tfam occurs independently of PGC-1α expression (no reduction in expression in brain of knockout mice [79]). (b) Brain maturation is associated with an increase in PGC-1α expression and the upregulation of genes enriched in parvalbumin-expressing neurons (Pvalb, Syt2, Nefh) as well as subsets of genes involved in oxidative phosphorylation. These genes could be driven by PGC-1α-containing complexes or by transcription factors regulated by PGC-1α. Any interference with PGC-1α expression and/or its interactions with transcription factors have the potential to impair the expression of synaptic genes and subsets of nuclear-encoded mitochondrial genes. These genes are reduced to the greatest extent in forebrain of PGC-1α knockout mice. (c) With overexpression, PGC-1α has the potential to engage transcriptional programs for mitochondrial respiration/biogenesis and neuronal transmission and integrity, depending on the cell type and transcription factors present. (d) Currently, it is not clear which transcription factors are required for the induction of neuron-enriched PGC-1α-dependent genes, although there are a number of possibilities. Created with BioRender.com.

References

    1. Goffart S., Wiesner R.J. Regulation and co-ordination of nuclear gene expression during mitochondrial biogenesis. Exp. Physiol. 2003;88:33–40. doi: 10.1113/eph8802500. - DOI - PubMed
    1. Scarpulla R.C. Nuclear control of respiratory gene expression in mammalian cells. J. Cell Biochem. 2006;97:673–683. doi: 10.1002/jcb.20743. - DOI - PubMed
    1. Scarpulla R.C. Nuclear control of respiratory chain expression by nuclear respiratory factors and PGC-1-related coactivator. Ann. N. Y. Acad. Sci. 2008;1147:321–334. doi: 10.1196/annals.1427.006. - DOI - PMC - PubMed
    1. Scarpulla R.C. Metabolic control of mitochondrial biogenesis through the PGC-1 family regulatory network. Biochim. Biophys. Acta. 2011;1813:1269–1278. doi: 10.1016/j.bbamcr.2010.09.019. - DOI - PMC - PubMed
    1. Haberle V., Stark A. Eukaryotic core promoters and the functional basis of transcription initiation. Nat. Rev. Mol. Cell Biol. 2018;19:621–637. doi: 10.1038/s41580-018-0028-8. - DOI - PMC - PubMed

Publication types

MeSH terms

Substances

LinkOut - more resources