. 2021 Jan 31;22(3):1423.
doi: 10.3390/ijms22031423.

Diabetes Induces a Transcriptional Signature in Bone Marrow-Derived CD34+ Hematopoietic Stem Cells Predictive of Their Progeny Dysfunction

Affiliations

Diabetes Induces a Transcriptional Signature in Bone Marrow-Derived CD34+ Hematopoietic Stem Cells Predictive of Their Progeny Dysfunction

Yuri D'Alessandra et al. Int J Mol Sci. .

Abstract

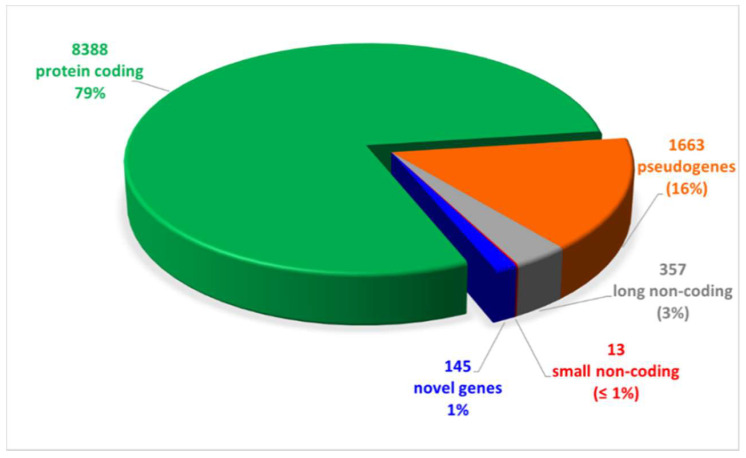
Hematopoietic stem/progenitor cells (HSPCs) participate in cardiovascular (CV) homeostasis and generate different types of blood cells including lymphoid and myeloid cells. Diabetes mellitus (DM) is characterized by chronic increase of pro-inflammatory mediators, which play an important role in the development of CV disease, and increased susceptibility to infections. Here, we aimed to evaluate the impact of DM on the transcriptional profile of HSPCs derived from bone marrow (BM). Total RNA of BM-derived CD34+ stem cells purified from sternal biopsies of patients undergoing coronary bypass surgery with or without DM (CAD and CAD-DM patients) was sequenced. The results evidenced 10566 expressed genes whose 79% were protein-coding genes, and 21% non-coding RNA. We identified 139 differentially expressed genes (p-value < 0.05 and |log2 FC| > 0.5) between the two comparing groups of CAD and CAD-DM patients. Gene Set Enrichment Analysis (GSEA), based on Gene Ontology biological processes (GO-BP) terms, led to the identification of fourteen overrepresented biological categories in CAD-DM samples. Most of the biological processes were related to lymphocyte activation, chemotaxis, peptidase activity, and innate immune response. Specifically, HSPCs from CAD-DM patients displayed reduced expression of genes coding for proteins regulating antibacterial and antivirus host defense as well as macrophage differentiation and lymphocyte emigration, proliferation, and differentiation. However, within the same biological processes, a consistent number of inflammatory genes coding for chemokines and cytokines were up-regulated. Our findings suggest that DM induces transcriptional alterations in HSPCs, which are potentially responsible of progeny dysfunction.

Keywords: CD34+, transcriptional profile; bone marrow; diabetes; hematopoietic stem cells; inflammation.


Conflict of interest statement

The authors declare no conflict of interest.

Figures

Figure 1
Figure 1
Schematic representation of the study. CAD: Coronary artery disease, DM: Diabetes mellitus, MNCs: Mononuclear cells.
Figure 2
Figure 2
Pie chart of expressed genes, grouped by biotypes provided by the ensemble annotation. Out of 10,566 expressed genes, 79% (8388) was represented by protein coding genes. The remaining 21% was constituted by non-coding RNAs (16% pseudogenes, 3% and 1% long and small non-coding, respectively, and 1% novel genes).
Figure 3
Figure 3
Volcano plot and Heatmap representation of differentially expressed genes. (A) The statistical analysis results are represented as a volcano plot of log2 fold-change (CAD-DM vs. CAD, x-axis) versus −log10 P values (y-axis). Among the 139 differentially expressed genes (p < 0.05), 84 genes were over-expressed (p-value < 0.05 and |log2 FC| > 0.5) in CAD-DM (red dots), whereas 55 in CAD (blue dots). (B) The heatmap shows that clustering based on the differentially expressed genes allowed complete separation between CAD-DM (orange squares) and CAD (green squares) samples. Gene expression levels were standardized and displayed as gradient colors from higher (dark orange) to lower (dark blue).
Figure 4
Figure 4
Gene-Set Enrichment Analysis (GSEA). To visually interpreting biological data from GSEA analysis, a network of the most significant Gene Ontology biological processes (GO-BP) terms (p < 0.05) was drawn. Blue and red nodes represent pathways mainly associated with CAD and CAD-DM conditions, respectively. The node gradient color is proportional to node significance, from lower (light node; p = 0.05) to higher (dark node; p << 0.0001); node size is proportional to the gene-set size. Edge thickness is proportional to the similarity between two gene-sets.
Figure 5
Figure 5
Technical validation of gene expression. The expression level of 6 genes was assessed using RT-qPCR single assays and RNA-seq. Pearson’s correlation coefficient (R) was computed to evaluate the strength of association between the two methodologies. The 95% confidence interval of the trendline (purple line) is depicted in light purple. Data are plotted as -dct (y-axis) versus log-normalized value (x-axis) for FPR2 (panel A), CSFR1 (panel B), DEFA3 (panel C), CCL2 (panel D), MS4A3 (panel E), and CXCR4 (panel F). The R coefficient as well as the corresponding p-values for each gene are shown in the relative panel.
Figure 6
Figure 6
Panel A: Analysis of FPR2, CSFR1, DEFA3, CCL2, MS4A3, and CXCR4 mRNA expression in CD34+ HSPCs from CAD and CAD-DM by qPCR. Data are expressed as log2 fold-change (logFC). CAD has been used as controls (* p < 0.05; ** p < 0.01 vs. CAD; unpaired t test). Panel B: CXCR4 membrane expression level in CD34+ HSPCs from CAD and CAD-DM by flow cytometry (* p < 0.05 vs. CAD; unpaired t test). Data are expressed as percentage of positive cells.

References

    1. Gregg E.W., Li Y., Wang J., Burrows N.R., Ali M.K., Rolka D., Williams D.E., Geiss L. Changes in diabetes-related complications in the United States, 1990–2010. N. Engl. J. Med. 2014;370:1514–1523. doi: 10.1056/NEJMoa1310799. - DOI - PubMed
    1. Haffner S.M., Lehto S., Ronnemaa T., Pyorala K., Laakso M. Mortality from coronary heart disease in subjects with type 2 diabetes and in nondiabetic subjects with and without prior myocardial infarction. N. Engl. J. Med. 1998;339:229–234. doi: 10.1056/NEJM199807233390404. - DOI - PubMed
    1. Wellen K.E., Hotamisligil G.S. Inflammation, stress, and diabetes. J. Clin. Investig. 2005;115:1111–1119. doi: 10.1172/JCI25102. - DOI - PMC - PubMed
    1. Donath M.Y., Shoelson S.E. Type 2 diabetes as an inflammatory disease. Nat. Rev. Immunol. 2011;11:98–107. doi: 10.1038/nri2925. - DOI - PubMed
    1. Lowe G., Woodward M., Hillis G., Rumley A., Li Q., Harrap S., Marre M., Hamet P., Patel A., Poulter N., et al. Circulating inflammatory markers and the risk of vascular complications and mortality in people with type 2 diabetes and cardiovascular disease or risk factors: The ADVANCE study. Diabetes. 2014;63:1115–1123. doi: 10.2337/db12-1625. - DOI - PubMed

MeSH terms