. 2021 Jan 29;10(2):192.
doi: 10.3390/antiox10020192.

Cytoprotective Effects of Punicalagin on Hydrogen-Peroxide-Mediated Oxidative Stress and Mitochondrial Dysfunction in Retinal Pigment Epithelium Cells

Affiliations

Cytoprotective Effects of Punicalagin on Hydrogen-Peroxide-Mediated Oxidative Stress and Mitochondrial Dysfunction in Retinal Pigment Epithelium Cells

Maria Elisabetta Clementi et al. Antioxidants (Basel). .

Abstract

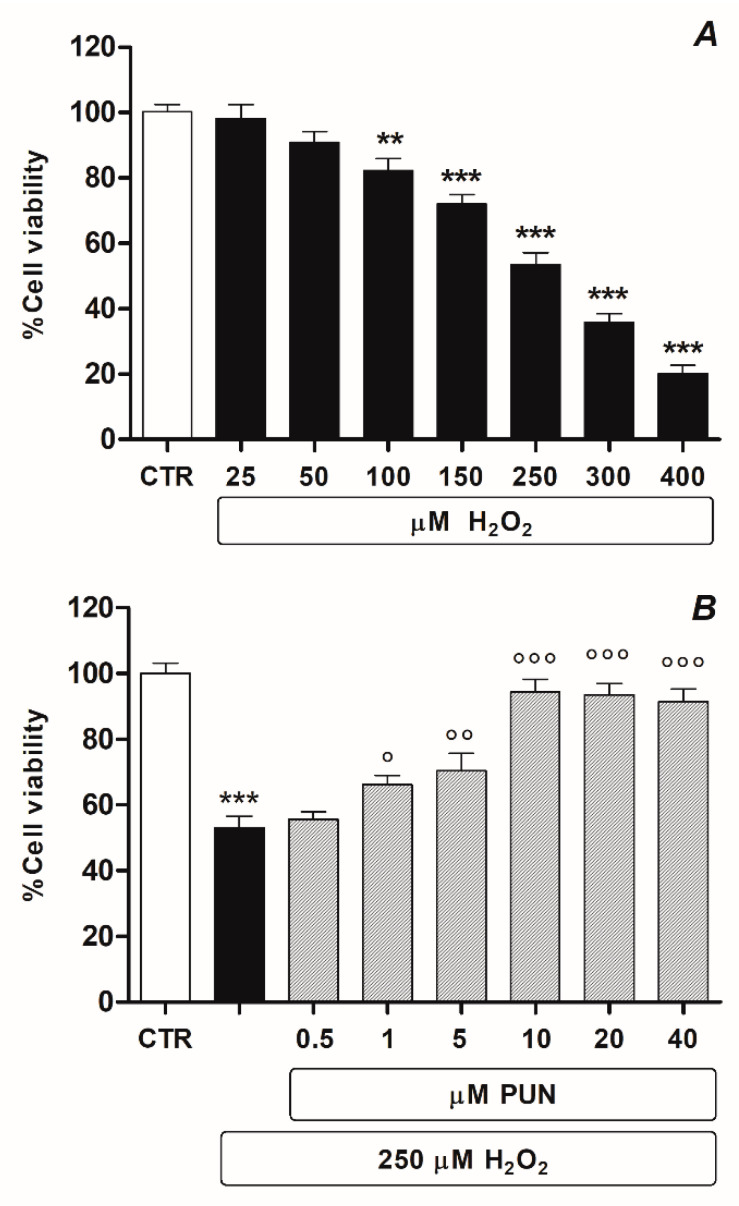
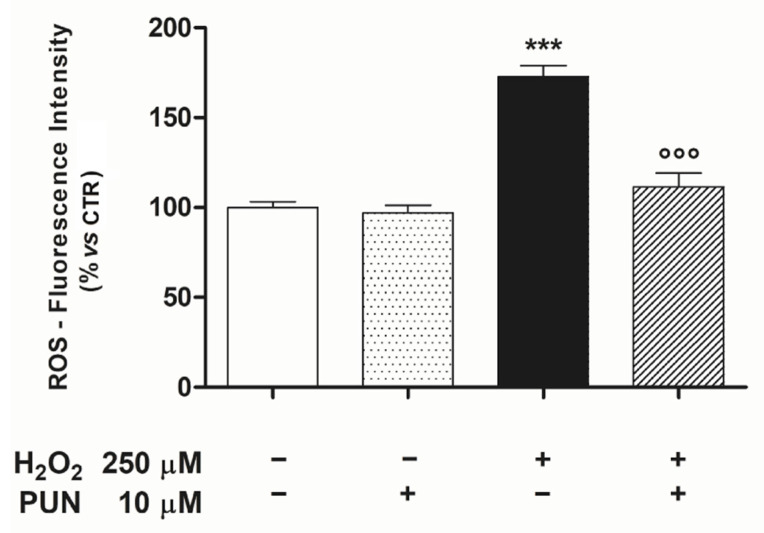
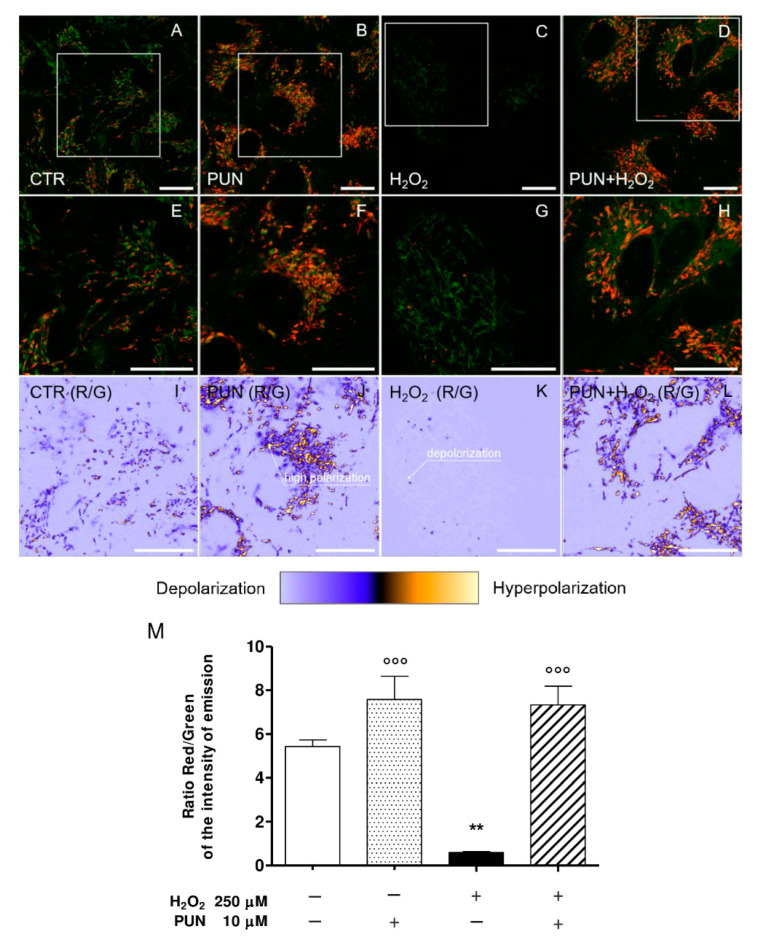
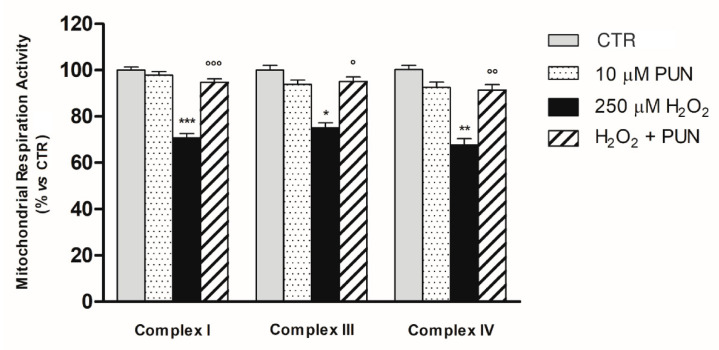
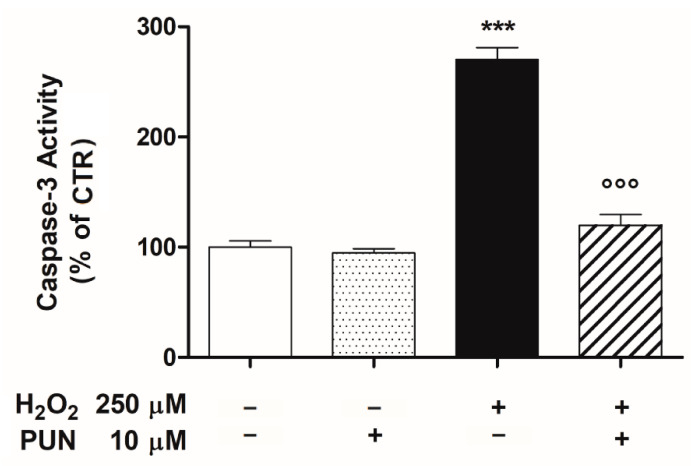
The retinal pigment epithelium (RPE) is a densely pigmented, monostratified epithelium that provides metabolic and functional support to the outer segments of photoreceptors. Endogenous or exogenous oxidative stimuli determine a switch from physiological to pathological conditions, characterized by an increase of intracellular levels of reactive oxygen species (ROS). Accumulating evidence has elucidated that punicalagin (PUN), the major ellagitannin in pomegranate, is a potent antioxidant in several cell types. The present study aimed to investigate the protective effect of PUN on mitochondrial dysfunction associated with hydrogen peroxide (H2O2)-induced oxidative stress. For this purpose, we used a human RPE cell line (ARPE-19) exposed to H2O2 for 24 h. The effects of PUN pre-treatment (24 h) were examined on cell viability, mitochondrial ROS levels, mitochondrial membrane potential, and respiratory chain complexes, then finally on caspase-3 enzymatic activity. The results showed that supplementation with PUN: (a) significantly increased cell viability; (b) kept the mitochondrial membrane potential (ΔΨm) at healthy levels and limited ROS production; (c) preserved the activity of respiratory complexes; (d) reduced caspase-3 activity. In conclusion, due to its activity in helping mitochondrial functions, reducing oxidative stress, and subsequent induction of cellular apoptosis, PUN might be considered a useful nutraceutical agent in the treatment of oxidation-associated disorders of RPE.

Keywords: ARPE–19 (human–RPE cell line); mitochondrion; oxidative stress; punicalagin.


Conflict of interest statement

The authors declare no conflict of interest.

Figures

Figure 1
Figure 1
Viability of ARPE–19 cells treated with H2O2 (range 25–400 µM) for 24 h (A) and protective effect of 24 h pre–treatment with multidose PUN (range 0.5–40 µM) (B). Data from two independent experiments are expressed as percentage viability values with respect to untreated cells (control = 100%) and are presented as the mean ± SEM of six replicates per experimental group. One–way ANOVA analysis was carried out followed by Dunnett’s or Newman–Keuls test for multiple comparisons with a control or for pairwise comparisons among sample means. Note: ** = p < 0.01 and *** = p < 0.001 vs. untreated control; ° = p < 0.05, °° = p < 0.01, °°° = p < 0.001 vs. H2O2 alone.
Figure 2
Figure 2
It was possible to reduce the H2O2–induced increase of mitochondrial ROS levels by pre–treating the ARPE–19 cells with PUN for 24 h. Values are expressed as percentages relative to the untreated control (100%) and are presented as means ± SEM of data from two distinct experiments, each in quadruplicate. One–way ANOVA analysis was carried out followed by post hoc Newman–Keuls test. Note: *** = p < 0.001 vs. control; °°° = p < 0.001 vs. 250 µM H2O2 alone.
Figure 3
Figure 3
Representative confocal images of ARPE–19 cells untreated (CTR, first column), treated with 10 µM punicalagin (PUN, second column), treated with 250 µM hydrogen peroxide (H2O2, third column), or pre–treated with punicalagin 24 h before H2O2 (PUN+ H2O2, fourth column). Composite dual–channel images (AD) are shown in the first row, along with a magnification of CTR (E), PUN (F), H2O2 (G), and PUN+ H2O2 (H), respectively. The green channel (emission: 525/50 nm) indicates the fluorescence intensity from monomers, while the red channel (emission: 595/50 nm) represents the emissions from aggregates. In the third row, representative maps of the red/green fluorescence intensity ratio (indicated as R/G) are reported for CTR (I), PUN (J), H2O2 (K), and PUN+ H2O2 (L), respectively. Each pixel’s color spans from light purple (low R/G emission intensity ratio, mitochondrial depolarization) to yellow (high R/G emission intensity ratio, mitochondrial hyperpolarization). Values of the emission intensity ratio range from 0 to 15. The means ± 1 SEM of the ratio are summarized in the bar plot reported in (M). Results are from two independent experiments, each including three replicates per experimental group. One–way ANOVA analysis was carried out followed by post hoc Newman–Keuls test. ** = p < 0.01 vs. control; °°° = p < 0.001 vs. 250 µM H2O2 alone.
Figure 4
Figure 4
The activities of mitochondrial respiratory chain complexes I, III, and IV were measured in mitochondria isolated of ARPE–19 cells. Enzyme activities were determined using specific assay kits (see Section 2.6 in Material and Methods). Results are shown as percentages relative to control for the single complex, which was set at 100%. Data are presented as the mean ± SEM of six replicates per experimental group from two independent experiments. One–way ANOVA analysis was carried out followed by post hoc Newman–Keuls test for each single respiratory complex. *, p < 0.05; ** = p < 0.01 and *** = p < 0.001 vs. Control; ° = p < 0.05; °° = p < 0.01 and °°° = p < 0.001 vs. H2O2 (250 µM) alone.
Figure 5
Figure 5
Pre–treatment with 10µM punicalagin (PUN) for 24 h downregulated the H2O2–induced caspase–3 activity in ARPE–19 cells. Data are expressed as a percentage relative to the untreated cells (control = 100%) and are presented as the means ± SEM of 6 replicates per group from two independent experiments. One–way ANOVA analysis was carried out followed by post hoc Newman–Keuls test. *** p < 0.001 vs. Control; °°° p < 0.001 vs. H2O2 alone.

Similar articles

Cited by

References

    1. Lakkaraju A., Umapathy A., Tan L.X., Daniele L., Philp N.J., Boesze-Battaglia K., Williams D.S. The cell biology of the retinal pigment epithelium. Prog. Retin. Eye Res. 2020;78:100846. doi: 10.1016/j.preteyeres.2020.100846. - DOI - PMC - PubMed
    1. Strauss O. The Retinal Pigment Epithelium in Visual Function. Physiol. Rev. 2005;85:845–881. doi: 10.1152/physrev.00021.2004. - DOI - PubMed
    1. Strauß O. Pharmacology of the retinal pigment epithelium, the interface between retina and body system. Eur. J. Pharmacol. 2016;787:84–93. doi: 10.1016/j.ejphar.2016.03.066. - DOI - PubMed
    1. Kay P., Yang Y.C., Paraoan L. Directional protein secretion by the retinal pigment epithelium: Roles in retinal health and the development of age-related macular degeneration. J. Cell. Mol. Med. 2013;17:833–843. doi: 10.1111/jcmm.12070. - DOI - PMC - PubMed
    1. Ponnalagu M., Subramani M., Jayadev C., Shetty R., Das D. Retinal pigment epithelium–secretome: A diabetic retinopathy perspective. Cytokine. 2017;95:126–135. doi: 10.1016/j.cyto.2017.02.013. - DOI - PubMed

LinkOut - more resources